

1 List of Qualified Tools in 2026
6 tools were submitted this year. They all successfully went through a qualification process requiring about 2 184 runs (each tool had to answer each examination for the first instance of each “known” model).
We introduce two classes of tools:
Original tools: these are tools prepared for the current year; it may also be an association of different tools, or some previously existing tools but with additional features. But it must be an original work.
Special tools: these have not been submitted by developers:
- Gold-2025 is a composite tool made of the gold medals of the MCC’2025, for each category. It allows measuring the progress made between 2025 and 2026.
- BVT-2026 is a virtual tool that serves as a reference by computing all the values declared correct in this contest. It provides a baseline for measuring coverability against the problems submitted this year, and can be seen as an oracle.
1.1 Reproducibility
For any tool, you can download the disk image that was provided with all its data. You may use these to reproduce measures locally and perform comparison with your own tool on the same benchmark.
All tool developers agreed to provide the original image disk embedding the tool they submitted this year (see links in the table below). You may operate these tools on your own. To do so, you need to mount the model disk image, that contains all models for 2026 together with the generated formulas, alongside the mains disk image of the tool you want to use.
You also have access to the archive containing all models and the corresponding formulas for 2026 outside of this second disk image.
1.2 Participating tools
The list of participating tools is presented in the table below.
| Tool Name | Supported Petri Nets | Representative Author | Institution | Type of execution | link to disk image |
|---|---|---|---|---|---|
| tedd | P/T and Colored | B. Berthomieu | LAAS-CNRS | Collateral Processing |  |
| smpt | P/T and Colored | N. Amat | ONERA | Collateral Processing | |
| tapaal | P/T and Colored | J. Srba | Aalborg University | Collateral Processing | |
| petrivet | P/T | M. Dyer | Technical University of Munich | Sequential processing | |
| TY | P/T and Colored | A. Yates | Ferrite Technology | Collateral Processing | |
| ITS-Tools | P/T and Colored | Y. Thierry-Mieg | LIP6, Sorbonne Université and CNRS | Collateral Processing | |
| Gold-2025 | P/T and Colored | F. Kordon (assembling) | Aalborg University and LAAS-CNRS and Sorbonne Université | Collateral Processing | |
2 Experimental Conditions of the MCC’2026
Each tool was submitted to 25 389 executions in various conditions (1 953 model/instances × 13 examinations per model/instance) for which it could report:
- DNC (do not compete),
- CC (cannot compute),
- or the result of the query.
These executions were handled by BenchKit, that was developed in the context of the MCC for massive testing of software. Then, from the raw data provided by BenchKit, some post-analysis scripts consolidated the data and computed a ranking.
16 GB of memory were allocated to each virtual machine (both parallel and sequential tools) and a confinement of one hour was considered (execution aborted after one hour). So, a total of 281 112 runs (execution of one examination by the virtual machine) generated 84 GB of raw data (essentially log files and CSV of sampled data).
The table below shows some data about the involved machines and their contribution to the computation of these results. This year, we only allocated physical cores to the virtual machines (discarding logical cores obtained from hyper-threading) so the balance between the various machines we used is quite different from the one of past years.
We could benefit from the use of the following computers:
- Tall (we used 13 nodes) and small (we used 23 nodes) are clusters at LIP6, Sorbonne Université & CNRS.
- Octoginta-2 was made available by colleagues at Université Paris Nanterre and was partially funded by LIP6
The organizing committee thanks these organizations for allowing exclusive use of these computers for a few weeks.
The processing of all the participating tools + Gold-2025 among a total of 177 723 runs1 lasted approximatively 19 days and 19 hours (consolidation phase excluded) for a total of about 6 years, 6 months, 29 days and 8 hours of CPU.
Distribution of the execution is shown below:
| Computer | octoginta-2 | small | tall | Total |
|---|---|---|---|---|
| Number of nodes | 1 | 23 | 13 | 37 |
| Physical cores per node | 80 | 12 | 32 | 772 |
| Frequency | 2.4GHz | 2.1GHz | 2.4GHz | — |
| Memory (GB) per node | 1536 | 64 | 384 | 8 000 |
| Maximum number of sequential VM | 79 | 3 | 31 | — |
| Maximum number of parallel VM | 19 | 2 | 7 | — |
| Number of processed runs | 18 928 | 63 154 | 95 641 | 177 723 |
| CPU consumed (day) | 272 | 862 | 1265 | 2 399 |
| CPU consumed (hour) | 17 | 12 | 1 | 30 |
| CPU consumed (minutes) | 59 | 31 | 51 | 141 |
| CPU consumed (seconds) | 15 | 28 | 48 | 91 |
3 Access to detailed results of the MCC’2026
This First table below presents detailed results about the MCC’2026. You may click on the arrows to access details of results and scoring.
| Examination | Results and Scoring | Model Performance Charts | Tool Resource Consumption |
|---|---|---|---|
| StateSpace |  |
|
|
| ReachabilityDeadlock | |
|
|
| QuasiLiveness | |
|
|
| StableMarking | |
|
|
| Liveness | |
|
|
| OneSafe | |
|
|
| UpperBounds | |
|
|
| ReachabilityCardinality | |
|
|
| ReachabilityFireability | |
|
|
| CTLCardinality | |
|
|
| CTLFireability | |
|
|
| LTLCardinality | |
|
|
| LTLFireability | |
|
|
This Second table below presents some performance analysis related to tools during the MCC’2026, for all models and also separately for know ones and surprise ones.
| Tool | All models | “surprise” models only | “Known” models only |
|---|---|---|---|
| ITS-Tools | |
|
|
| petrivet | |
|
|
| smpt | |
|
|
| Tapaal | |
|
|
| tedd | |
|
|
| TY | |
|
|
| 2025-gold | |
|
|
| BVT-2026 | |
|
|
You can download the full archive of the 25 389 runs processed to compute the results of the MCC’2026. This archive contains execution traces, execution logs and sampling, as well as a large CSV files that summarizes all the executions. You may get separately the two mostly interesting CSV files:
- GlobalSummary.csv that summarizes all results from all runs in the contest,
- raw-result-analysis.csv that contains the same data as the previous one but enriched with scoring information and the expected results (computed as a majority of tools pondered by their confidence rate).
Note that from the two CSV file, you can identify the unique run identifier that allows you to find the traces and any information in the archive (they are also available on the web site when the too did participated).
4 The Winners for the MCC’2026
This section presents the results for the main examinations that are:
- State Space generation,
- Upper Bounds computation,
- Global Properties computation (ReachabilityDeadlock, QuasiLiveness, StableMarking, Liveness, and OneSafe),
- Reachability Formulas (ReachabilityCardinality, ReachabilityFireability),
- CTL Formulas (CTLCardinality, CTLFireability),
- LTL Formulas (LTLCardinality, LTLFireability),
To avoid too large a disparity between models with numerous instances and those with only one, a normalization was applied so that the score, for an examination and a model, varies between 102 and 221 points. Therefore, providing a correct value may bring a different number of points according to the considered model. A multiplier was applied depending on the model category:
- x 1 for “Known” models,
- x 13 for “Surprise” models.
“Blue Whale” and “James Cook” Awards
Let us introduce two awards :
- the Blue Whale award celebrates depth, strength, and a massive appetite for data. It is awarded to the tool that computes the highest number of correct, partial results in a category, such as the verdict for a formula or general property, a number of states, an upper bound, etc. Every value counts equally and, to keep the playing field level, special tools are excluded and score multipliers for surprise models are not used.
- the James Cook award celebrates exploration, and tools that can give an answer when nobody else can. It is awarded to the tool answering the largest number of unique, correct results for a given category, meaning a partial result that has not been computed by another tool (excluding special tools). While the name might bring the Cook-Levin theorem to mind, this award is named after Captain James Cook, celebrating the spirit of exploring uncharted territories.
Blue Whale and James Cook Awards for all examinations
We consider here these awards among all the examinations together. - When considering all examinations, Tapaal got the Blue Whale award with a maximum of 199 837 computed values out of the 236 313 possible values, which is 84.56% of what could be computed (BVT-2026 computes 92.14% and 2025-gold 88.17%).
- When considering all examinations, Tapaal got the James Cook award with a maximum of 17 169 unique values (2025-gold computes 163 unique values).
4.1 Winners in the StateSpace Category
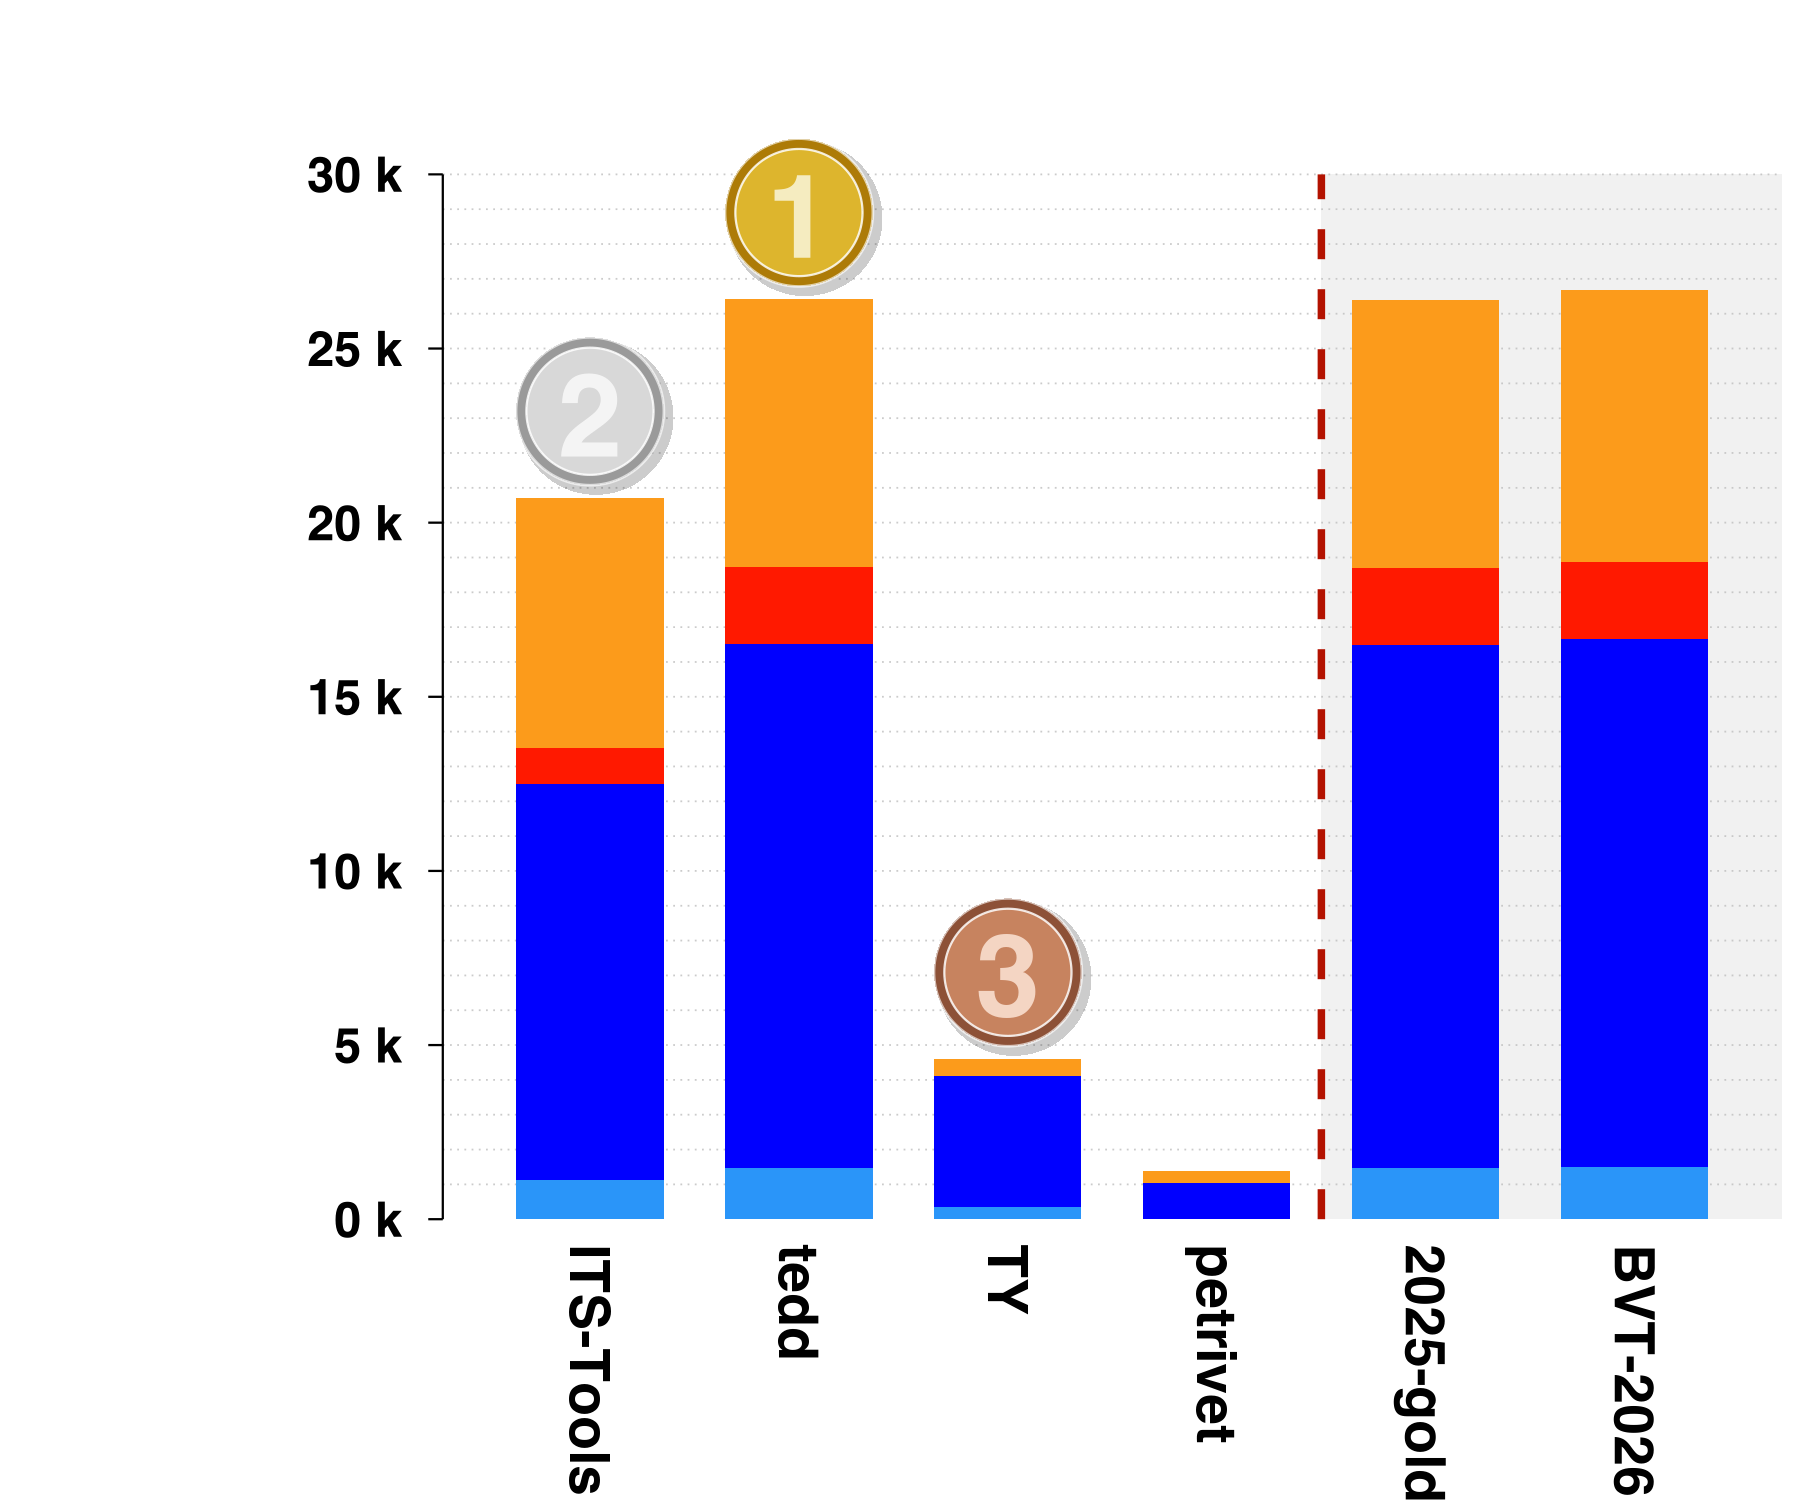
4 tools out of 6 participated in this examination. Results based on the scoring shown below is :
tedd is ranked first with 25 365 points,
ITS-Tools is ranked second with 20 708 points,
TY is ranked third with 4 599 points.
Then, tools rank in the following order: petrivet (1 047 points). The Gold-medal of 2025 collected 25 337 points. BVT-2026 (Best Virtual Tool) collected 25 640 points.
Awards
For StateSpace, tedd got the Blue Whale award with a maximum of 5 904 computed values out of the 7 812 possible values, which is 75.58% of what could be computed (BVT-2026 computes 76.64% and 2025-gold computes 75.46%).
For StateSpace, tedd got the James Cook award with a maximum of 2 049 unique values (2025-gold computes 1 unique values).
4.2 Winners in the GlobalProperties Category
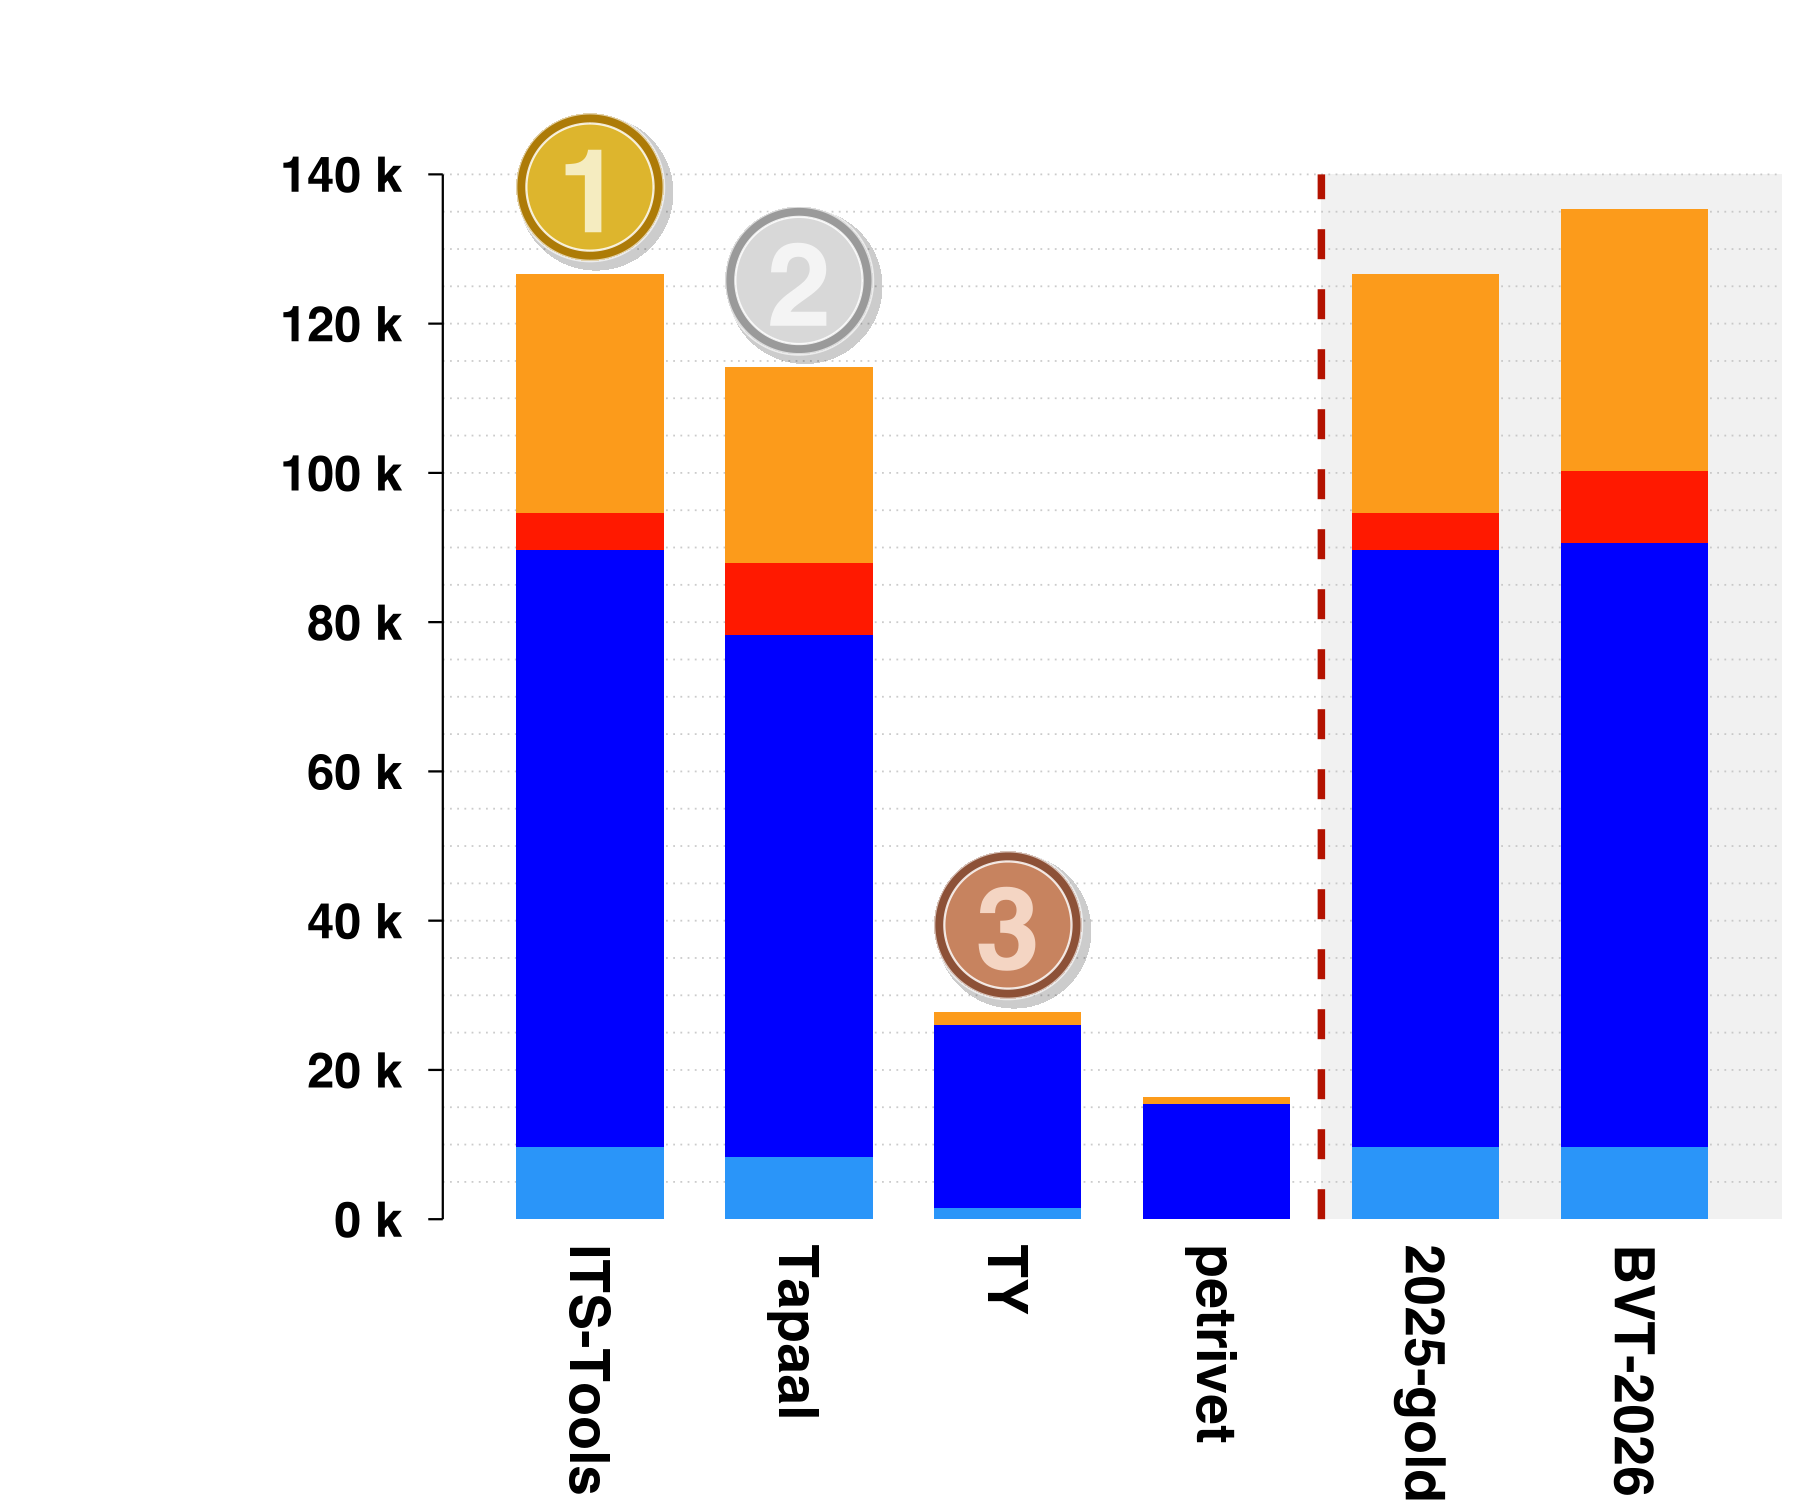
4 tools out of 6 participated in this examination. Results based on the scoring shown below is :
ITS-Tools is ranked first with 126 679 points,
Tapaal is ranked second with 109 455 points,
TY is ranked third with 27 798 points.
Then, tools rank in the following order: petrivet (16 333 points). The Gold-medal of 2025 collected 126 686 points. BVT-2026 (Best Virtual Tool) collected 130 607 points.
Awards
For GlobalProperties, ITS-Tools got the Blue Whale award with a maximum of 9 187 computed values out of the 9 765 possible values, which is 94.08% of what could be computed (BVT-2026 computes 95.14% and 2025-gold computes 94.11%).
For GlobalProperties, ITS-Tools got the James Cook award with a maximum of 1 192 unique values (2025-gold computes 16 unique values).
4.3 Winners in the UpperBounds Category
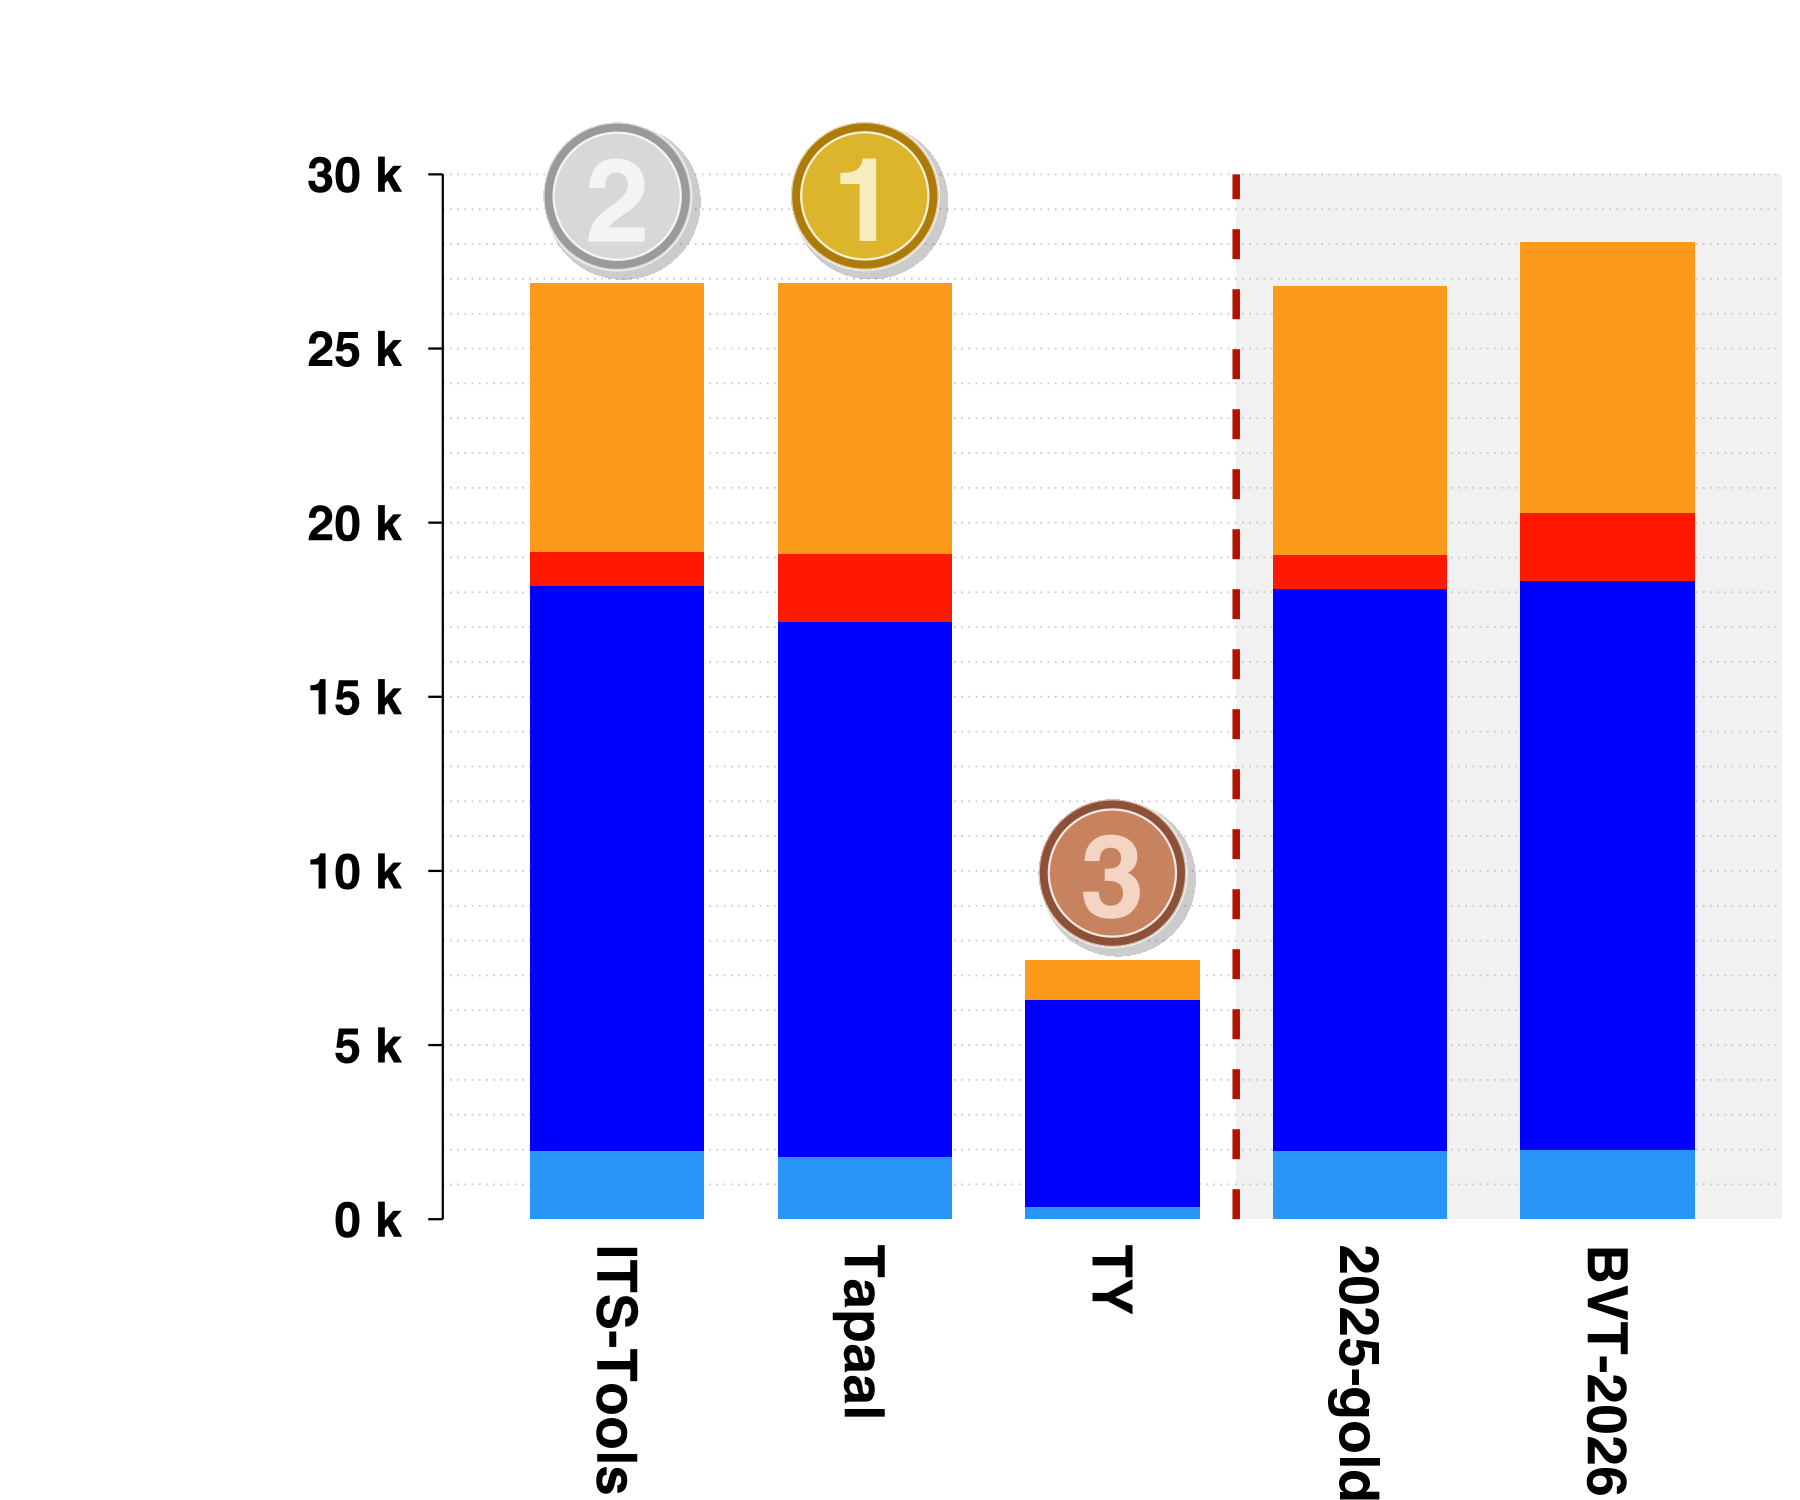
3 tools out of 6 participated in this examination. Results based on the scoring shown below is :
ITS-Tools is ranked first with 26 883 points,
Tapaal is ranked second with 25 910 points,
TY is ranked third with 7 449 points.
The Gold-medal of 2025 collected 26 807 points. BVT-2026 (Best Virtual Tool) collected 27 080 points.
Awards
For UpperBounds, ITS-Tools got the Blue Whale award with a maximum of 29 982 computed values out of the 31 248 possible values, which is 95.95% of what could be computed (BVT-2026 computes 96.60% and 2025-gold computes 95.59%).
For UpperBounds, ITS-Tools got the James Cook award with a maximum of 1 719 unique values (2025-gold computes 46 unique values).
4.4 Winners in the Reachability Formulas Category
4 tools out of 6 participated in this examination. Results based on the scoring shown below is :
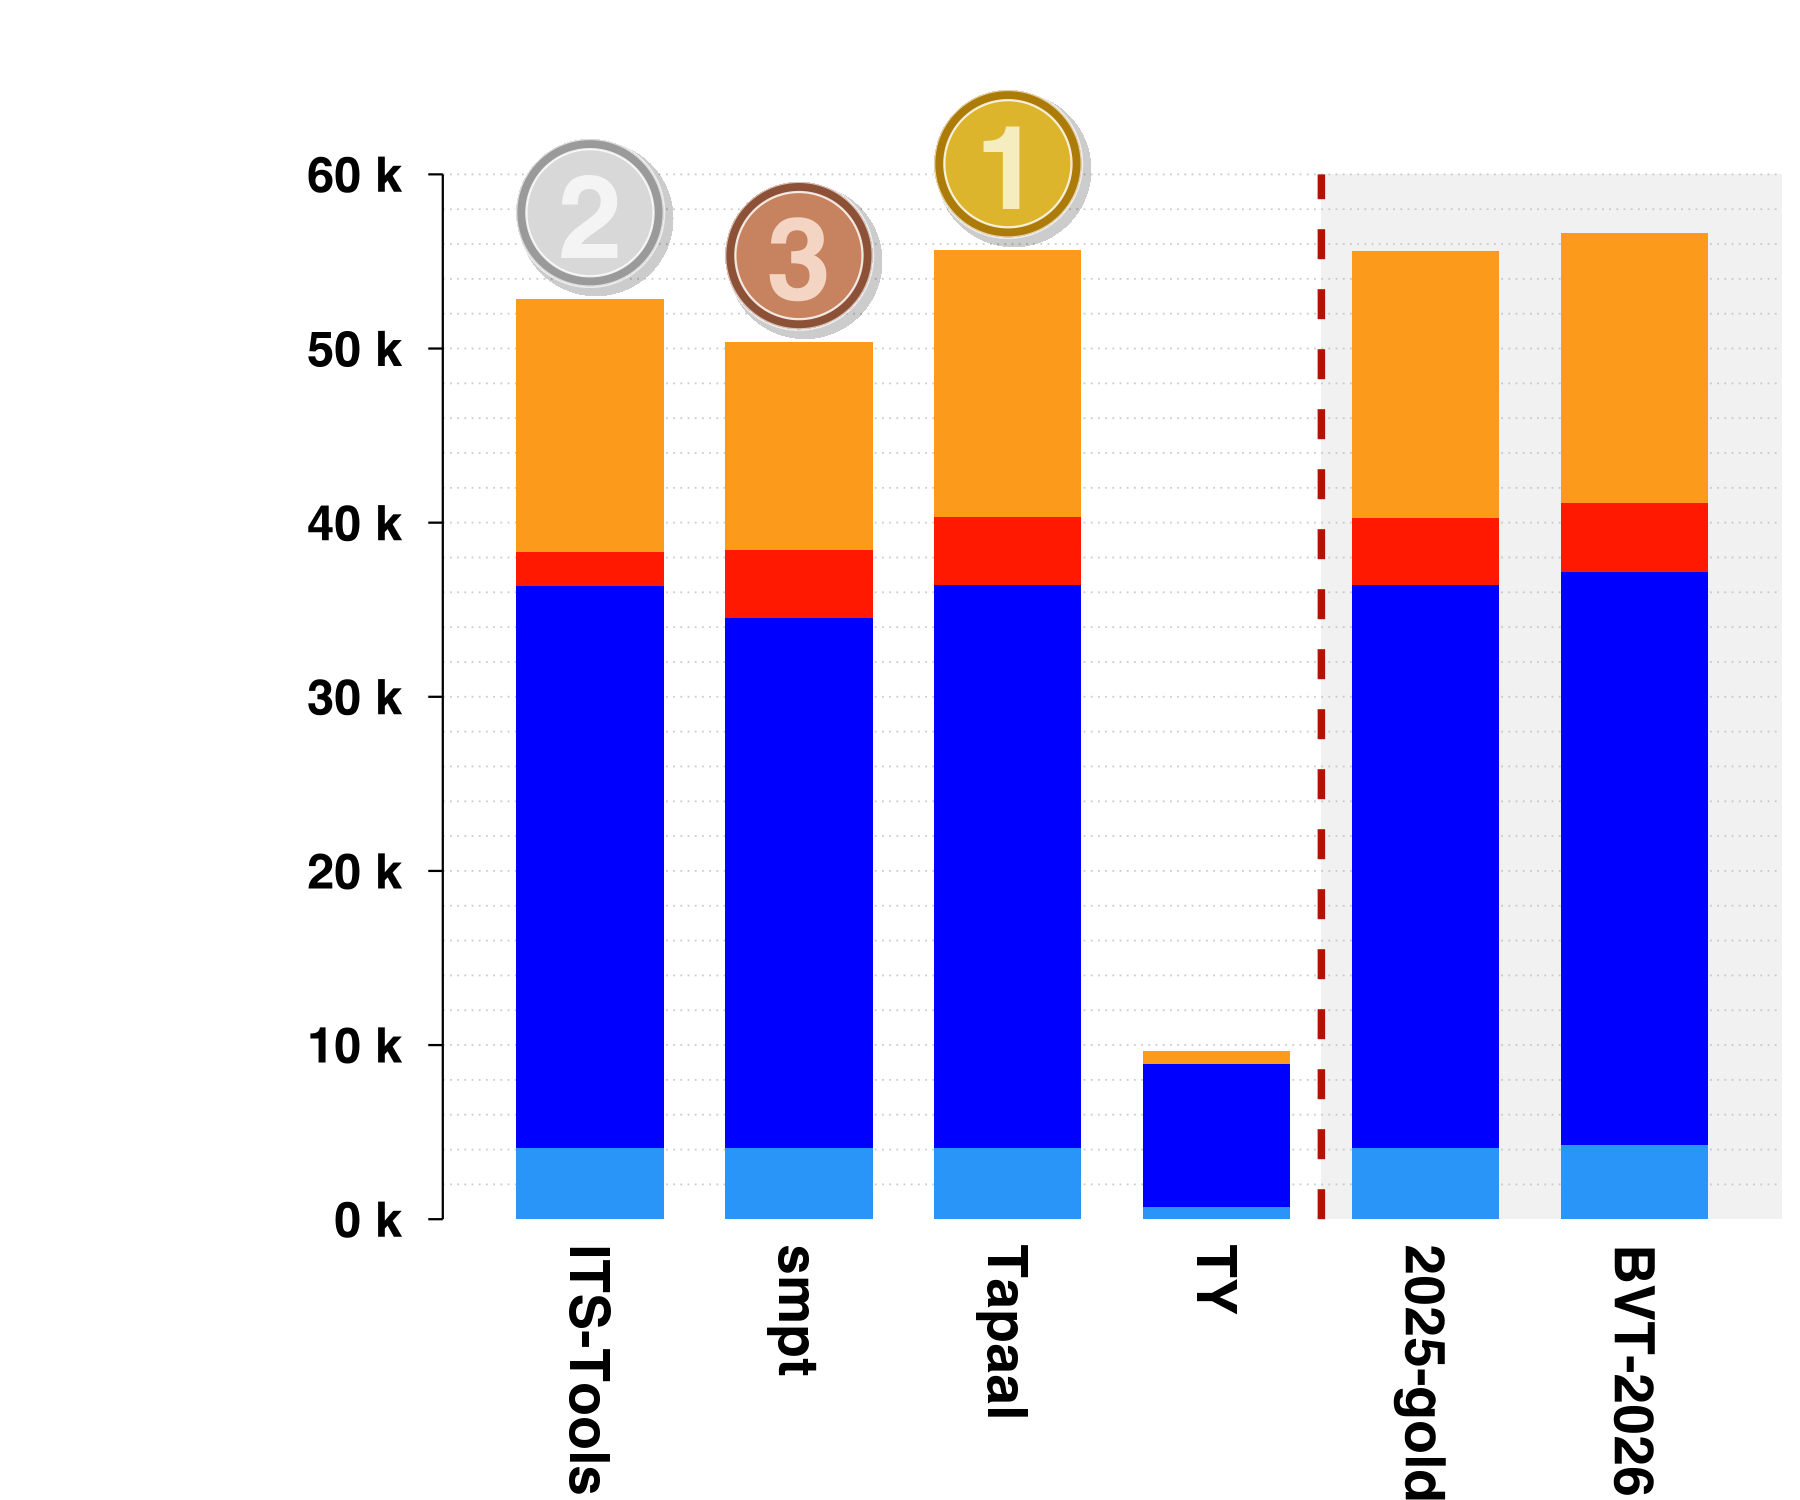
Tapaal is ranked first with 53 680 points,
ITS-Tools is ranked second with 52 817 points,
smpt is ranked third with 48 411 points.
Then, tools rank in the following order: TY (9 680 points). The Gold-medal of 2025 collected 53 670 points. BVT-2026 (Best Virtual Tool) collected 54 651 points.
Awards
For Reachability, Tapaal got the Blue Whale award with a maximum of 59 820 computed values out of the 62 496 possible values, which is 95.72% of what could be computed (BVT-2026 computes 97.92% and 2025-gold computes 95.68%).
For Reachability, Tapaal got the James Cook award with a maximum of 913 unique values (2025-gold computes 27 unique values).
4.5 Winners in the CTL Formulas Category
3 tools out of 6 participated in this examination. Results based on the scoring shown below is :
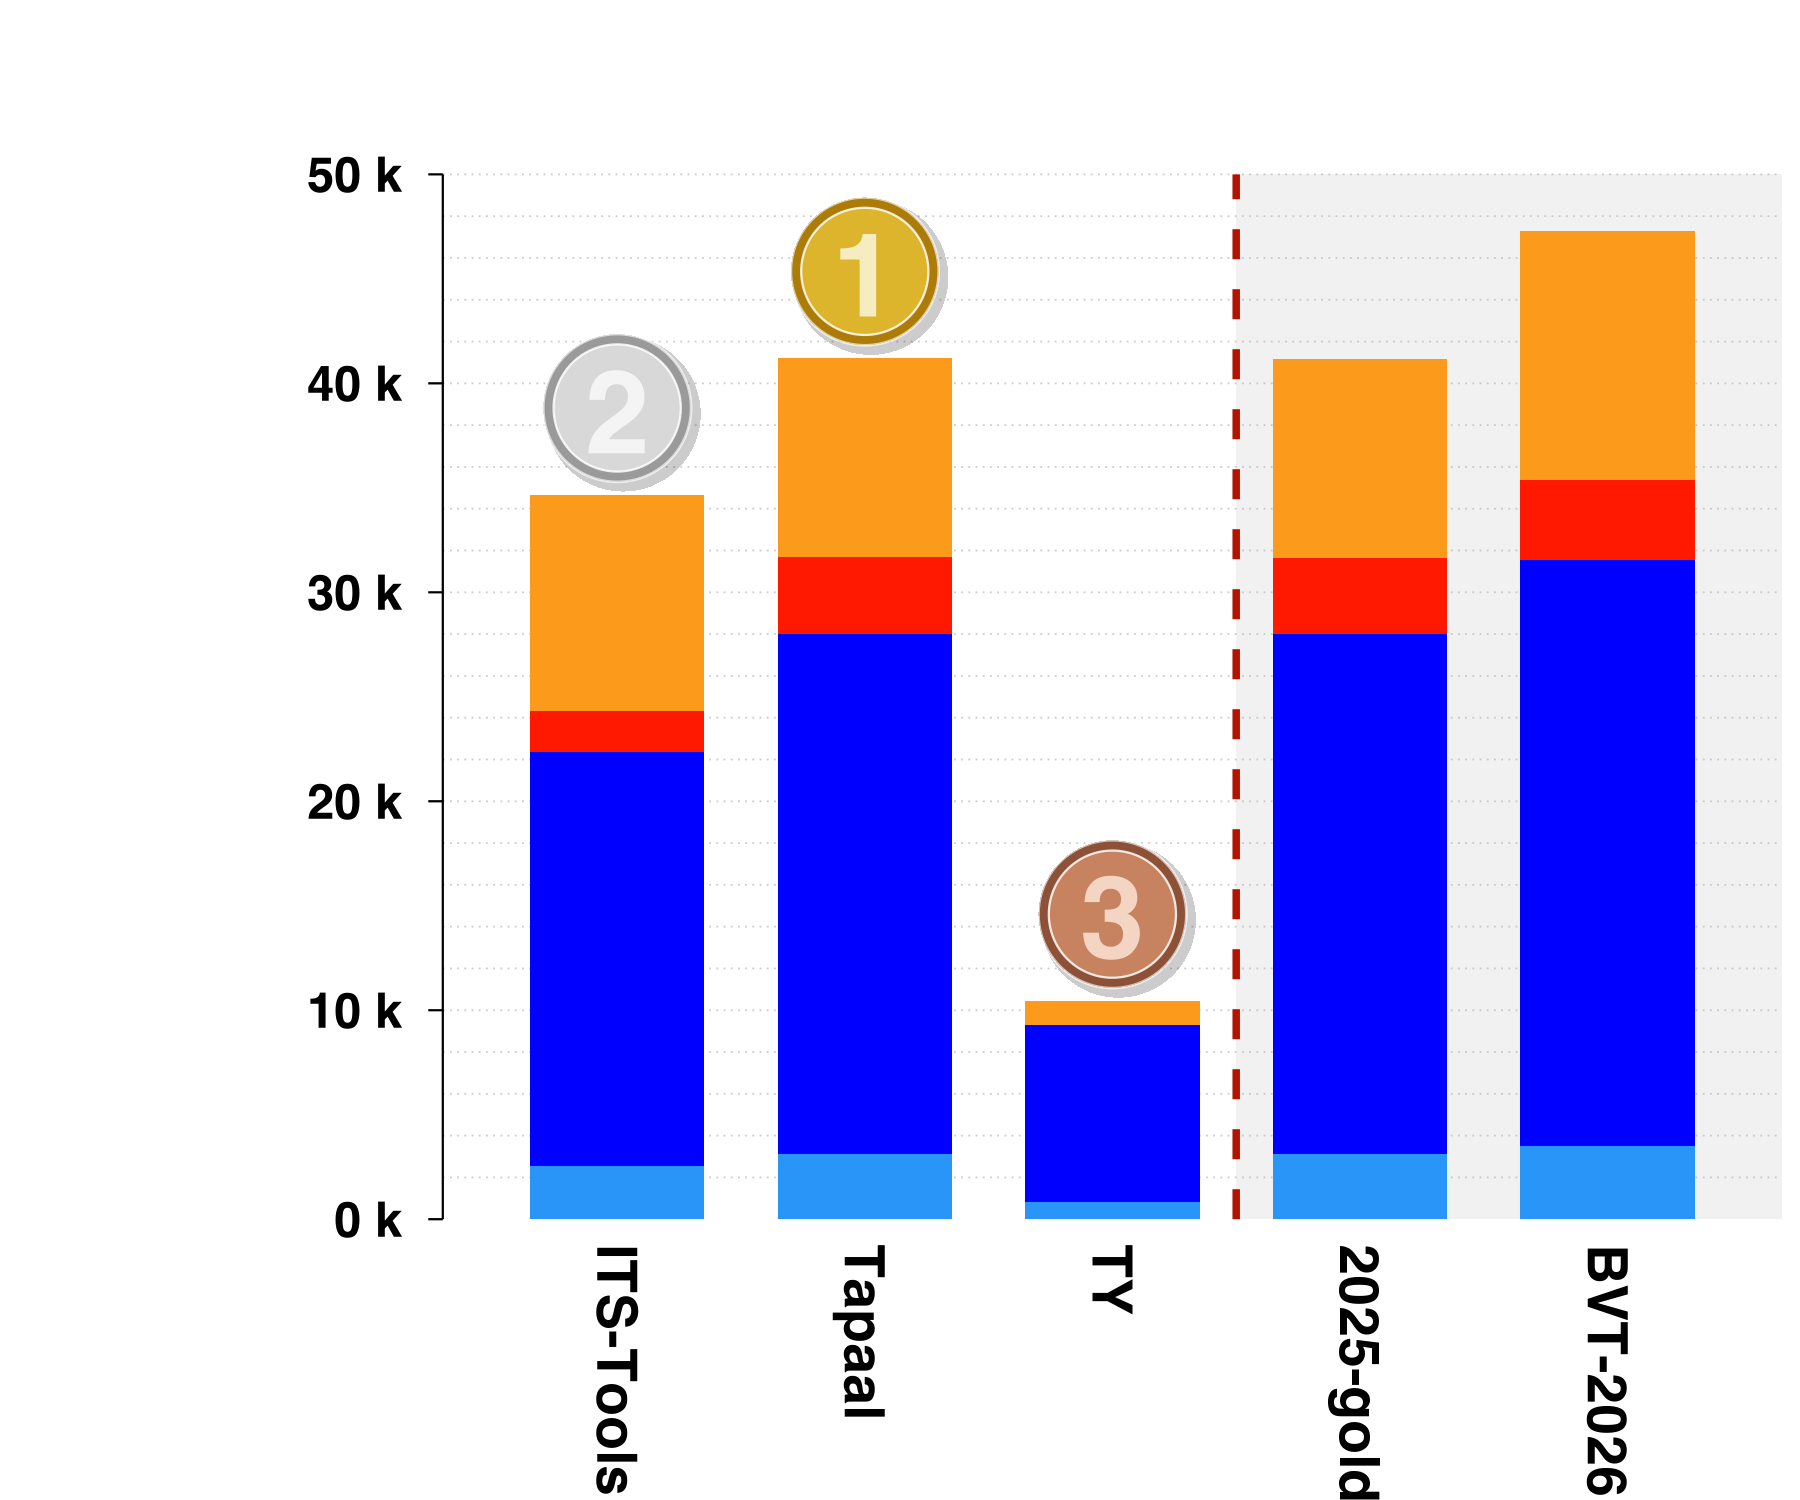
Tapaal is ranked first with 39 312 points,
ITS-Tools is ranked second with 34 671 points,
TY is ranked third with 10 448 points.
The Gold-medal of 2025 collected 39 257 points. BVT-2026 (Best Virtual Tool) collected 45 413 points.
Awards
For CTL, Tapaal got the Blue Whale award with a maximum of 45 770 computed values out of the 62 496 possible values, which is 73.24% of what could be computed (BVT-2026 computes 81.75% and 2025-gold computes 73.21%).
For CTL, Tapaal got the James Cook award with a maximum of 13 591 unique values (2025-gold computes 65 unique values).
4.6 Winners in the LTL Formulas Category
3 tools out of 6 participated in this examination. Results based on the scoring shown below is :
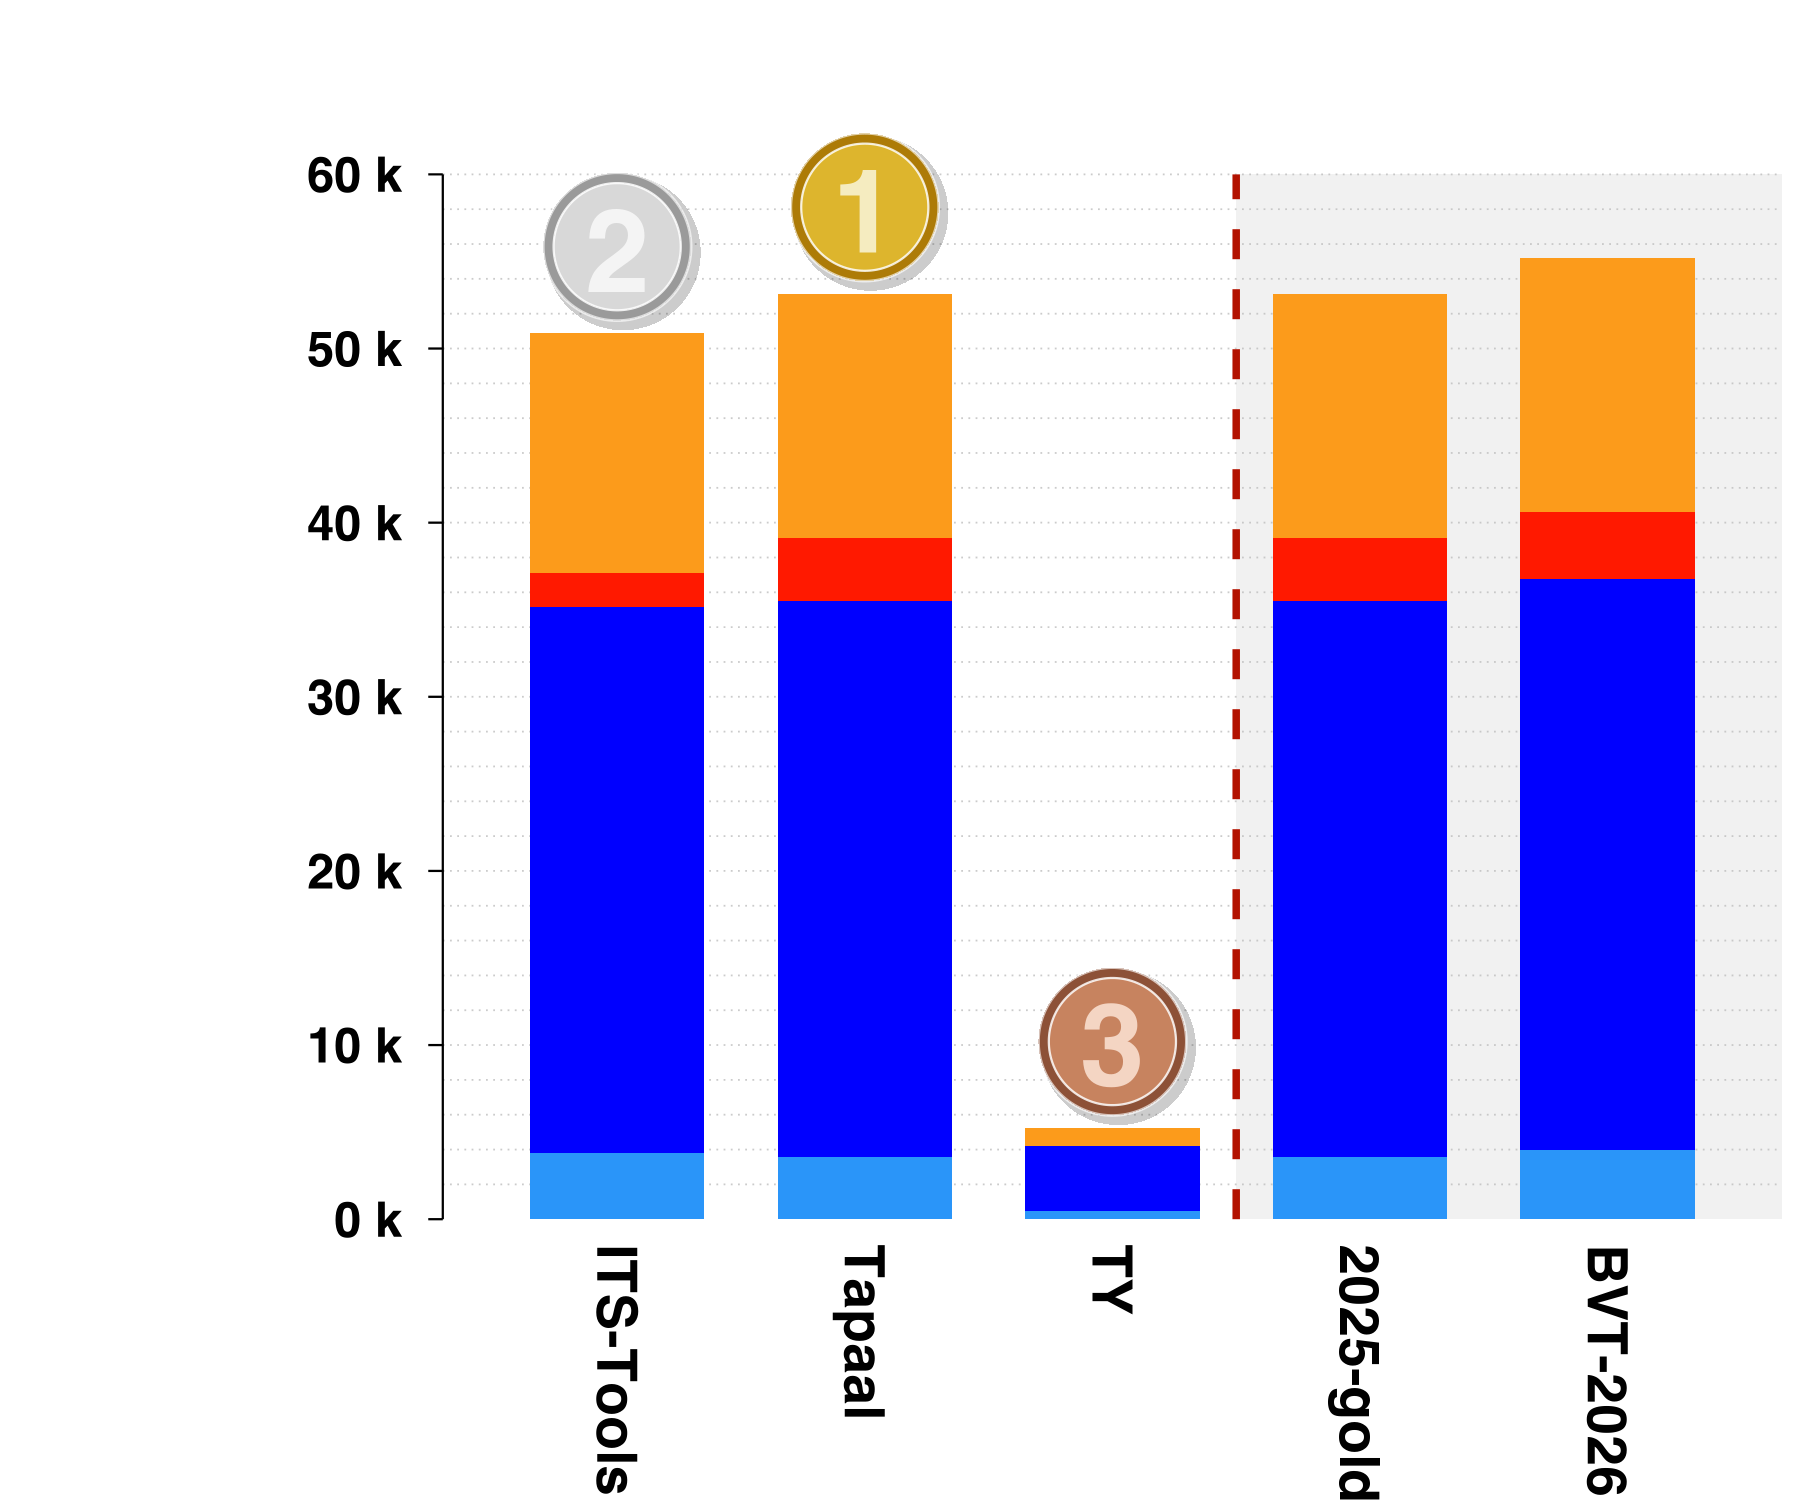
Tapaal is ranked first with 51 214 points,
ITS-Tools is ranked second with 50 867 points,
TY is ranked third with 5 221 points.
The Gold-medal of 2025 collected 51 218 points. BVT-2026 (Best Virtual Tool) collected 53 305 points.
Awards
For LTL, Tapaal got the Blue Whale award with a maximum of 57 822 computed values out of the 62 496 possible values, which is 92.52% of what could be computed (BVT-2026 computes 96.01% and 2025-gold computes 92.55%).
For LTL, Tapaal got the James Cook award with a maximum of 2 442 unique values (2025-gold computes 8 unique values).
5 Estimation of the Global Tool Confidence in 2026
A confidence analysis ensures that we only consider the computation of “right results”, which is defined based on the answers of all participating tools. The decision of what is a right result takes into account each value provided in the contest (a value is a partial result, such as the verdict of a formula or a number provided for state space, bound computation, etc.). We proceed as follows:
- For each tool, we selected all “significant values” where at least 3 tools agree.
- Based on this subset of values, we computed the ratio between the selected values for the tool and the number of good answers they provide for such values. This ratio gives a tool confidence rate that is provided in the table below.
- The tool confidence rate is used to compute the scores presented in the dedicated sections.
5.1 Global Tool Confidence (all examinations)
The table below provides, in first column, the computed confidence rates (that are naturally lower for tools where a bug was detected). Then, the table provides the number of correct results (column 2) out of the number of “significant values” selected for the tool (column 3). The last column shows the number of examinations (and their type) the tool was involved in.
| Tool name | Confidence rate | Correct values | Significant values | Involved examinations |
|---|---|---|---|---|
| ITS-Tools | 99.998% | 183 859 | 183 862 | 13, CTLCardinality CTLFireability Liveness LTLCardinality LTLFireability OneSafe QuasiLiveness ReachabilityCardinality ReachabilityDeadlock ReachabilityFireability StableMarking StateSpace UpperBounds |
| smpt | 100.000% | 55 622 | 55 622 | 2, ReachabilityCardinality ReachabilityFireability |
| Tapaal | 100.000% | 182 819 | 182 819 | 12, CTLCardinality CTLFireability Liveness LTLCardinality LTLFireability OneSafe QuasiLiveness ReachabilityCardinality ReachabilityDeadlock ReachabilityFireability StableMarking UpperBounds |
| tedd | 100.000% | 3 849 | 3 849 | 1, StateSpace |
| TY | 99.674% | 44 894 | 45 041 | 13, CTLCardinality CTLFireability Liveness LTLCardinality LTLFireability OneSafe QuasiLiveness ReachabilityCardinality ReachabilityDeadlock ReachabilityFireability StableMarking StateSpace UpperBounds |
| petrivet | 97.536% | 1 821 | 1 867 | 6, Liveness OneSafe QuasiLiveness ReachabilityDeadlock StableMarking StateSpace |
| 2025-gold | 99.999% | 186 751 | 186 752 | 13, CTLCardinality CTLFireability Liveness LTLCardinality LTLFireability OneSafe QuasiLiveness ReachabilityCardinality ReachabilityDeadlock ReachabilityFireability StableMarking StateSpace UpperBounds |
| BVT-2026 | 100.000% | 186 724 | 186 724 | 13, CTLCardinality CTLFireability Liveness LTLCardinality LTLFireability OneSafe QuasiLiveness ReachabilityCardinality ReachabilityDeadlock ReachabilityFireability StableMarking StateSpace UpperBounds |
5.2 Tool Confidence for the StateSpace category
The table below show the confidence for tools participating in the StateSpace category.
| Tool name | Confidence rate | Correct values | Significant values |
|---|---|---|---|
| ITS-Tools | 100,000% | 3 522 | 3 522 |
| tedd | 100,000% | 3 849 | 3 849 |
| TY | 100,000% | 1 252 | 1 252 |
| petrivet | 93,696% | 431 | 460 |
| 2025-gold | 100,000% | 3 849 | 3 849 |
| BVT-2026 | 100,000% | 3 794 | 3 794 |
5.3 Tool Confidence for the GlobalProperties category
The table below show the confidence for tools participating in the GlobalProperties category.
| Tool name | Confidence rate | Correct values | Significant values |
|---|---|---|---|
| ITS-Tools | 99,987% | 7 984 | 7 985 |
| TY | 99,377% | 2 391 | 2 406 |
| petrivet | 98,792% | 1 390 | 1 407 |
| Tapaal | 100,000% | 7 915 | 7 915 |
| 2025-gold | 99,987% | 7 984 | 7 985 |
| BVT-2026 | 100,000% | 7 985 | 7 985 |
5.4 Tool Confidence for the UpperBounds category
The table below show the confidence for tools participating in the UpperBounds category.
| Tool name | Confidence rate | Correct values | Significant values |
|---|---|---|---|
| ITS-Tools | 100,000% | 28 234 | 28 234 |
| TY | 99,863% | 9 466 | 9 479 |
| Tapaal | 100,000% | 28 234 | 28 234 |
| 2025-gold | 100,000% | 28 234 | 28 234 |
| BVT-2026 | 100,000% | 28 234 | 28 234 |
5.5 Tool Confidence for the Reachability Formulas category
The table below show the confidence for tools participating in the Reachability Formulas category.
| Tool name | Confidence rate | Correct values | Significant values |
|---|---|---|---|
| ITS-Tools | 99,997% | 58 293 | 58 295 |
| TY | 99,214% | 12 374 | 12 472 |
| Tapaal | 100,000% | 59 190 | 59 190 |
| smpt | 100,000% | 55 622 | 55 622 |
| 2025-gold | 100,000% | 59 209 | 59 209 |
| BVT-2026 | 100,000% | 59 230 | 59 230 |
5.6 Tool Confidence for the CTL Formulas category
The table below show the confidence for tools participating in the CTL Formulas category.
| Tool name | Confidence rate | Correct values | Significant values |
|---|---|---|---|
| ITS-Tools | 100,000% | 30 508 | 30 508 |
| TY | 99,881% | 13 447 | 13 463 |
| Tapaal | 100,000% | 32 137 | 32 137 |
| 2025-gold | 100,000% | 32 132 | 32 132 |
| BVT-2026 | 100,000% | 32 138 | 32 138 |
5.7 Tool Confidence for the LTL Formulas category
The table below show the confidence for tools participating in the LTL Formulas category.
| Tool name | Confidence rate | Correct values | Significant values |
|---|---|---|---|
| ITS-Tools | 100,000% | 55 318 | 55 318 |
| TY | 99,916% | 5 964 | 5 969 |
| Tapaal | 100,000% | 55 343 | 55 343 |
| 2025-gold | 100,000% | 55 343 | 55 343 |
| BVT-2026 | 100,000% | 55 343 | 55 343 |
One run is the execution of one tool to process one examination.↩︎