

1. Introduction
This page summarizes the results for the 2017 edition of the Model Checking Contest (MCC’2017). This page is divided in three sections:
- First, we list the qualified tools for the MCC'2017,
- Then, we provide some informations about the experimental conditions of the MCC'2017,
- Then, we present an access to details about results,
- Then, we provide the list of winners of the MCC'2017,
- Finally, we provide an attempt to evaluate tool reliability based on the comparison of the results provided in the contest.
IMPORTANT:all these documents can be reused in scientific material and papers but must respect the Creative Common licence CC-BY-NC-SA.
2. List of Qualified Tools in 2017
Ten tools where submitted this year. They all successfully went through a qualification process requiring about 1500 runs (each tool had to answer each examination for the first instance of each «known» model).
Data about these tools are summarized in the table below. For any tool, you can download the disk image that was provided with all its data. You may use these to reproduce measures locally and perform comparison with your own tool on the same benchmark.
| Summary of the Participating Tools (alphabetical order) | ||||||
| Tool name | Supported Petri nets |
Representative Author | Origin | Type of execution | Link to the submitted disk image | Reported Techniques (all examinations) |
|---|---|---|---|---|---|---|
| GreatSPN-Meddly | P/T and colored | Elvio Amparore | Univ. Torino (Italy) | Sequential Processing |  |
DECISION_DIAGRAMS TOPOLOGICAL UNFOLDING_TO_PT USE_NUPN |
| ITS-Tools | P/T and colored | Yann Thierry-Mieg | UNiv. P & M. Curie (France) | Collateral Processing | |
BMC DECISION_DIAGRAMS EXPLICIT INITIAL_STATE K_INDUCTION LTSMIN PARTIAL_ORDER SAT_SMT TAUTOLOGY TOPOLOGICAL USE_NUPN |
| LoLA | P/T and colored | Karsten Wolf & Torsten Liebke | Univ. Rostock (Germany) | Collateral Processing | |
EXPLICIT SAT_SMT SEQUENTIAL_PROCESSING STATE_COMPRESSION STUBBORN_SETS SYMMETRIES TOPOLOGICAL USE_NUPN |
| LTSMin | P/T | Jeroen Meijer & Jaco van de Pol | Univ. Twente (The Netherlands) | Parallel Processing | |
DECISION_DIAGRAMS EXPLICIT USE_NUPN |
| MARCIE | P/T and colored | Christian Rohr | Univ. Cottbus (Germany) | Sequential Processing | |
DECISION_DIAGRAMS UNFOLDING_TO_PT |
| smart | P/T | Andrew Miner & Gianfranco Ciardo | Iowa State University (USA) | Sequential Processing | |
DECISION_DIAGRAMS |
| Spot | P/T and colored | Maximilien Colange | Epita (France) | Sequential Processing | |
EXPLICIT STATE_COMPRESSION |
| Tapaal | P/T and colored | Jiri Srba | Univ. Aalborg (Denmark) | Collateral Processing | |
EXPLICIT STATE_COMPRESSION STRUCTURAL_REDUCTION STUBBORN_SETS LINEAR_PROGRAMMING |
| Tina.sift | P/T and colored | Bernard Berthomieu & Silvano Dal Zilio | LAAS/CNRS, Univ. de Toulouse (France) | Sequential Processing | |
EXPLICIT STATE_COMPRESSION STRUCTURAL_REDUCTION |
| Tina.tedd | P/T and colored | Bernard Berthomieu & Silvano Dal Zilio | LAAS/CNRS, Univ. de Toulouse (France) | Sequential Processing | |
DECISION_DIAGRAMS STATE_COMPRESSION STRUCTURAL_REDUCTION |
The table below lists the techniques reported per examination (and for all the tool variants when applicable).
| Techniques Reported by the Participating Tools (per examination) | |||||
| Tool name | StateSpace | UpperBounds | Reachability | CTL | LTL |
|---|---|---|---|---|---|
| GreatSPN | DECISION_DIAGRAMS TOPOLOGICAL UNFOLDING_TO_PT USE_NUPN | DECISION_DIAGRAMS TOPOLOGICAL UNFOLDING_TO_PT USE_NUPN | DECISION_DIAGRAMS TOPOLOGICAL UNFOLDING_TO_PT USE_NUPN | DECISION_DIAGRAMS TOPOLOGICAL UNFOLDING_TO_PT USE_NUPN | — |
| ITS-Tools | DECISION_DIAGRAMS TOPOLOGICAL USE_NUPN | DECISION_DIAGRAMS TOPOLOGICAL USE_NUPN | BMC DECISION_DIAGRAMS EXPLICIT INITIAL_STATE K_INDUCTION LTSMIN PARTIAL_ORDER SAT_SMT TAUTOLOGY TOPOLOGICAL USE_NUPN | DECISION_DIAGRAMS TOPOLOGICAL USE_NUPN | DECISION_DIAGRAMS EXPLICIT LTSMIN PARTIAL_ORDER SAT_SMT TOPOLOGICAL USE_NUPN |
| LoLA | — | EXPLICIT STATE_COMPRESSION STUBBORN_SETS USE_NUPN | EXPLICIT SAT_SMT STATE_COMPRESSION STUBBORN_SETS SYMMETRIES TOPOLOGICAL USE_NUPN | EXPLICIT STATE_COMPRESSION STUBBORN_SETS TOPOLOGICAL USE_NUPN | EXPLICIT STATE_COMPRESSION STUBBORN_SETS TOPOLOGICAL USE_NUPN |
| LTSMin | DECISION_DIAGRAMS USE_NUPN | DECISION_DIAGRAMS USE_NUPN | DECISION_DIAGRAMS USE_NUPN | DECISION_DIAGRAMS USE_NUPN | EXPLICIT USE_NUPN |
| MARCIE | DECISION_DIAGRAMS UNFOLDING_TO_PT | DECISION_DIAGRAMS UNFOLDING_TO_PT | DECISION_DIAGRAMS UNFOLDING_TO_PT | DECISION_DIAGRAMS UNFOLDING_TO_PT | — |
| smart | DECISION_DIAGRAMS | — | — | — | — |
| Spot | — | — | — | — | EXPLICIT STATE_COMPRESSION |
| Tapaal | EXPLICIT STATE_COMPRESSION | EXPLICIT STATE_COMPRESSION STRUCTURAL_REDUCTIONS | EXPLICIT STATE_COMPRESSION LINEAR_PROGRAMMING | EXPLICIT STATE_COMPRESSION STRUCTURAL_REDUCTION STUBBORN_SETS | — |
| Tina.sift | STATE_COMPRESSION EXPLICIT STRUCTURAL_REDUCTION | — | — | — | — |
| Tina.tedd | DECISION_DIAGRAMS STATE_COMPRESSION STRUCTURAL_REDUCTION | — | — | — | — |
3. Experimental Conditions of the MCC'2017
Each tool was submitted to 9 171 executions in various conditions (1019 model/instances and 9 examinations per model/instance) for which it could report: DNC (do not compete), CC (cannot compute) or the result of the query. These executions were handled by BenchKit, that was developed in the context of the MCC for massive testing of software. Then, from the raw data provided by BenchKit, some post-analysis scripts consolidated these and computed a ranking.
The number of model/instances has been reduced since 2016 because, for «Known» (and thus «Stripped») models, we removed numerous instances for which all tools where providing results in the past edition, in order to preserve a reasonable ratio between «Surprise» models and existing ones. This could save some CPU time too.
16 GB of memory were allocated to each virtual machine (both parallel and sequential tools) and a confinement of one hour was considered (execution aborted after one hour). So, a total of 91 710 runs (execution of one examination by the virtual machine) generated 29 GB of raw data (essentially log files and CSV of sampled data).
The table below shows some data about the involved machines and their contribution to the computation of these results.
| Involved Machines and Execution of the Benchmarks | |||||||
| bluewhale03 | bluewhale07 | Caserta | Ebro | Quadhexa-2 | Small | Total | |
|---|---|---|---|---|---|---|---|
| Logical Cores | 40 @ 2.8GHz | 32 @ 3.2 GHz | 96 @ 2.20 GHz | 64 @ 2.7GHz | 24 @ 2.66GHz | 12×24 @ 2.4GHz | — |
| Memory (GB) | 512 | 1024 | 1024 | 1024 | 128 | 12×64 | — |
| Used Cores (sequential tools) | 31, 31 VM in // |
31, 31 VM in // |
63, 63 VM in // |
63, 63 VM in // |
used to generate formulas |
12×3, 12×3 VM in // |
— |
| Used Cores (parallel tools) | 36 (4 per VM), 9 VM in // |
28 (4 per VM), 7 VM in // |
92 (4 per VM), 23 VM in // |
60 (4 per VM), 15 VM in // |
12×12 (4 per VM), 12×3 VM in // |
— | |
| Number of runs | 15 210 | 10 080 | 24 660 | 21 600 | 20 160 | 91 710 | |
| Total CPU required | 221d, 11h, 34m, 37s | 143d, 12h, 49m, 57s | 389d, 20h, 43m, 6s | 422d, 10h, 24m, 3s | ≈7d (not in total) |
370d, 15h, 27m, 29s | 1547d, 22h, 59m, 11s |
| Total CPU | about 4 years and 2 months and 27 days | - | |||||
| Time spent to complete benchmarks | about 15 days | - | |||||
| Estimated boot time of VMs + management (overhead) |
15d, 22h (Included in total CPU) | - | |||||
We are pleased to thanks those who helped in the execution of tools:
- Bluewhale03 and Bluewhale07 were made available by colleagues at Université de Genève,
- Caserta was made available by colleagues at University of Twente,
- Ebro was made available by colleagues at Rostock University,
- Quadhexa-2 was made available by colleagues at Université Paris Nanterre,
- Small is one of the two clusters at LI6 (we got 12 nodes out of 23) Université Pierre & Marie Curie.
4. The Results of the MCC’2017
This First table below presents detailed results about the MCC'2017.
| Details about the Examinations in the MCC'2017 (part I): Details about Results and Scoring + Model Performance Charts |
|||
| Details about Results and Scoring |
Model Performance Charts |
Tool Resource consumption |
|
|---|---|---|---|
| StateSpace | |||
| UpperBounds | |||
| ReachabilityCardinality | |||
| ReachabilityDeadlock | |||
| ReachabilityFireability | |||
| CTLCardinality | |||
| CTLFireability | |||
| LTLCardinality | |||
| LTLFireability | |||
This Second table below presents some performance analysis related to tools during the MCC'2017.
| Details about the examinations in the MCC'2017 (part II)Tool Performance Charts | ||||
| All models |
«Surprise» models only |
«Stripped» models only |
«Known» models only |
|
|---|---|---|---|---|
| GreatSPN | ||||
| ITS-Tools | ||||
| LoLA | ||||
| LTSMin | ||||
| MARCIE | ||||
| smart | ||||
| Spot | ||||
| Tapaal | ||||
| TINA.sift | ||||
| TINA.tedd | ||||
You can download the full archive (2 GB compressed and 29 GB uncompressed) of the 91 710 runs processed to compute the results of the MCC'2017. This archive contains execution traces, execution logs and sampling, as well as a large CSV files that summarizes all the executions and gnuplot scripts and data to generate the charts produced in the web site (please have a look on the READ_ME.txt file). Yo may get separately the two mostly interesting CSV files:
- GlobalSummary.csv that summarizes all results from all runs in the contest (15 MB when expanded),
- raw-result-analysis.csv that contains the same data as the previous one but enriched with scoring information and the expected results (computed as a majority of tools pondered by their confidence rate, 21 MB when expanded).
Note that from the two CSV file, you can identify the unique run identifier that allors you to find the traces and any information in the archive (theyr are also available on the web site when the too did participated).
5. The Winners for the MCC'2017
This section presents the results for the main examinations that are:
- State Space generation,
- UpperBounds computation,
- Reachability Formulas (ReachabilityCardinality, ReachabilityDeadlock, ReachabilityFireability),
- CTL Formulas (CTLCardinality, CTLFireability),
- LTL Formulas (LTLCardinality, LTLFireability),
Each examination for a given model brought 16 points (see the details in the slides). A multiplier was applied depending to the model category:
- ×1 for «Known» models,
- ×2 for «Stripped» models,
- ×6 for «Surprise» models.
We manually detected a few values (3 or 4) for which apparently the majority of tools where wrong. However, this has only a minor impact on the scoring and could not change the order of tools for any category. A way to deal with such (rare) situations will be considered for the next edition.
Presented scores are dispatched over the three categories of models (yellow for «Known» models, blue for «Stripped» models and red for «Surprise» models). The maximum number of points that a tool could get for a given examination was:
- 8 400 for «Known» models (+ a maximum of 4 200 bonus points),
- 25 200 for «Stripped» models (+ a maximum of 12 600 bonus points),
- 11 120 for «Surprise» models (+ a maximum of 5 560 bonus points).
Note that bonuses are not always collected.
5.1. Winners in the StateSpace Category
This examination had the highest participation rate (8 tools out of 10). Results based on the scoring shown below is:
- GreatSPN ranked first (20 302 pts),
- TINA.tedd ranked second (17 988 pts),
- ITS-Tools ranked third (15 880 pts).
Then, tools rank in the following order: MARCIE (13 462 pts), smart (10 688 pts), LTSMin (8 400 pts), TINA.stif (6 402 pts), and Tapaal (5 040 pts).
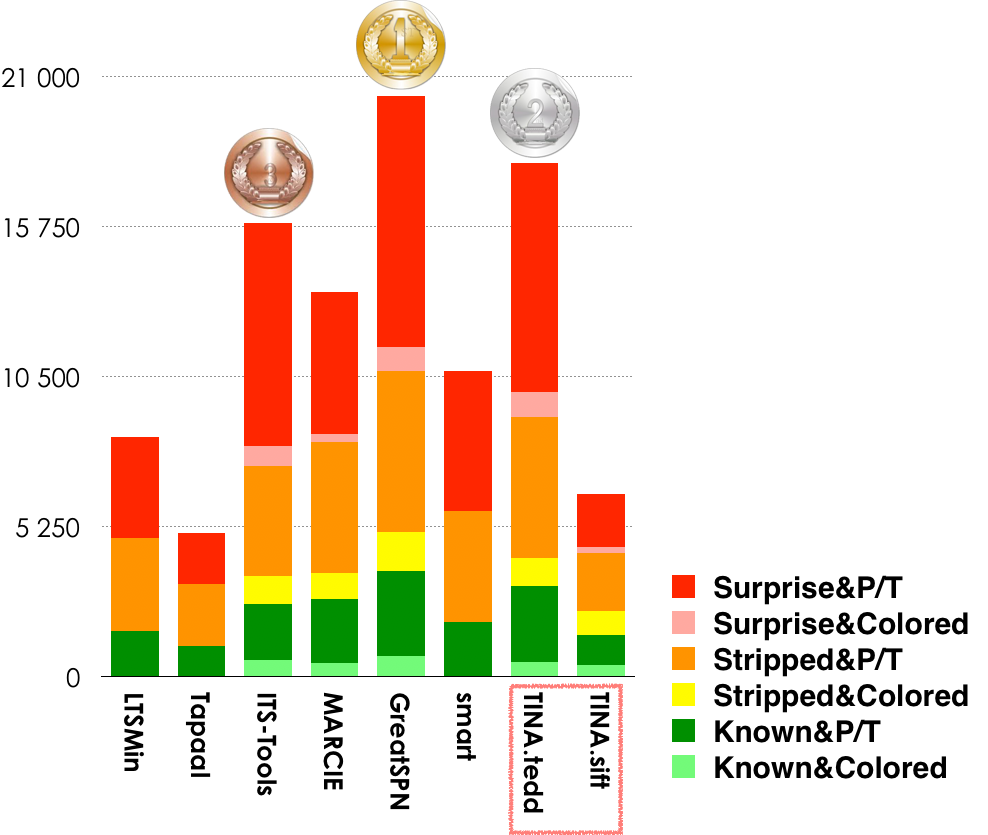
Note that all the variants of Tina were considered as one tool with regards to the scoring (see rule E-4.5.).
| Estimated Tool Confidence rate for StateSpace (based on the «significant values» computed by tools) see section 6. for details |
|||
| Tool name | Reliability | Correct Values | «significant values» |
|---|---|---|---|
| GreatSPN | 100% | 1611 | 1611 |
| ITS-Tools | 100% | 1143 | 1143 |
| LTSMin | 100% | 792 | 792 |
| MARCIE | 100% | 1499 | 1499 |
| smart | 79.59% | 862 | 862 |
| Tapaal | 100% | 477 | 477 |
| TINA.sift | 97.84% | 724 | 740 |
| TINA.tedd | 100% | 1641 | 1641 |
Please consider note 1 on tool confidence (bottom of this page).
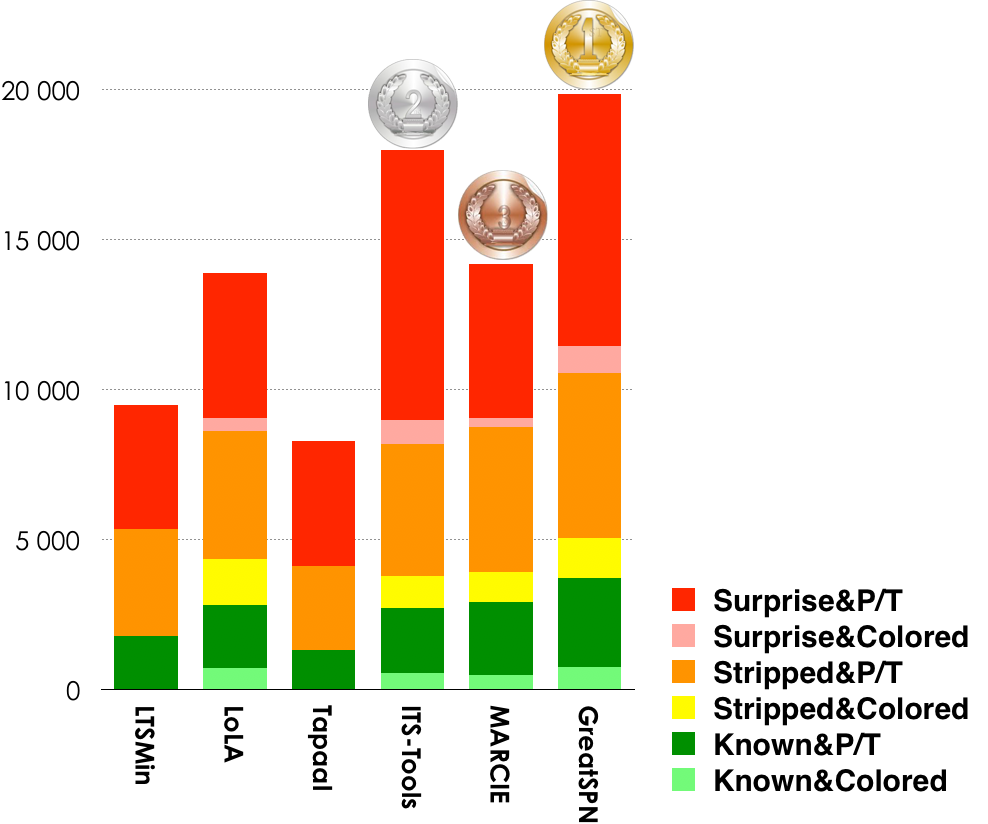
5.2. Winners in the UpperBounds Category
6 (+1, see below) tools out of 12 participated in this examination. Results based on the scoring shown below is:
- GreatSPN ranked first (19 834 pts),
- ITS-Tools ranked second (17 933 pts),
- MARCIE ranked third (14 200 pts).
Then, tools rank in the following order: LoLA (13 894 pts), LTSMin (9 496 pts), and Tapaal (8 286 pts).
| Estimated Tool Confidence rate for UpperBound (based on the «significant values» computed by tools) see section 6. for details |
|||
| Tool name | Reliability | Correct Values | «significant values» |
|---|---|---|---|
| GreatSPN | 98.89% | 5709 | 5773 |
| ITS-Tools | 100% | 5645 | 5645 |
| LoLA | 100% | 4014 | 4014 |
| LTSMin | 100% | 3958 | 3958 |
| MARCIE | 100% | 5726 | 5726 |
| Tapaal | 100% | 3088 | 3088 |
Please consider note 1 on tool confidence (bottom of this page).
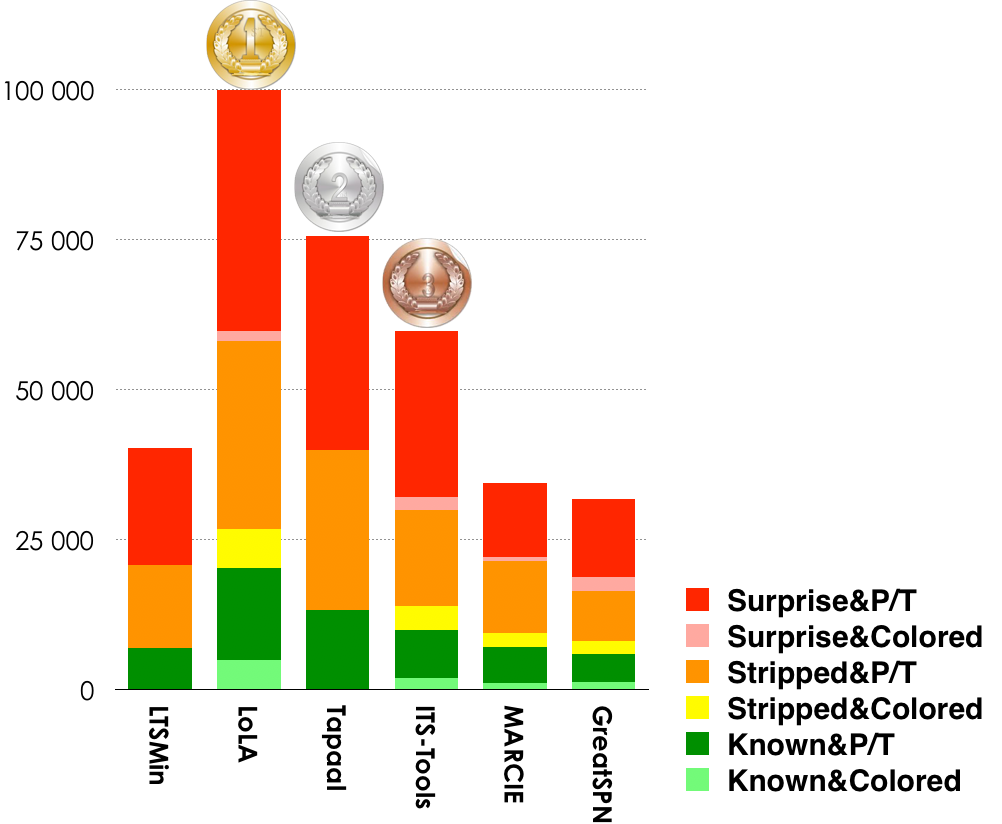
5.3. Winners in the Reachability Formulas Category
8 tools out of 12 participated in these examinations (ReachabilityDeadlock, ReachabilityCardinality and ReachabilityFireability). Results based on the scoring shown below is:
- LoLA ranked first (99 942 pts),
- Tapaal ranked second (75 669),
- ITS-Tools ranked third (59 805 pts).
Then, tools rank in the following order: LTSMin (40 217 pts), MARCIE (34 345 pts), and greatSPN (31 733 pts).
| Estimated Tool Confidence rate for Reachability (based on the «significant values» computed by tools) see section 6. for details |
|||
| Tool name | Reliability | Correct Values | «significant values» |
|---|---|---|---|
| GreatSPN | 99.18% | 7742 | 7806 |
| ITS-Tools | 94.68% | 15933 | 16828 |
| LoLA | 100% | 17908 | 17908 |
| LTSMin | 100% | 11964 | 11964 |
| MARCIE | 100% | 10701 | 10701 |
| Tapaal | 100% | 16205 | 16205 |
Please consider note 1 on tool confidence (bottom of this page).
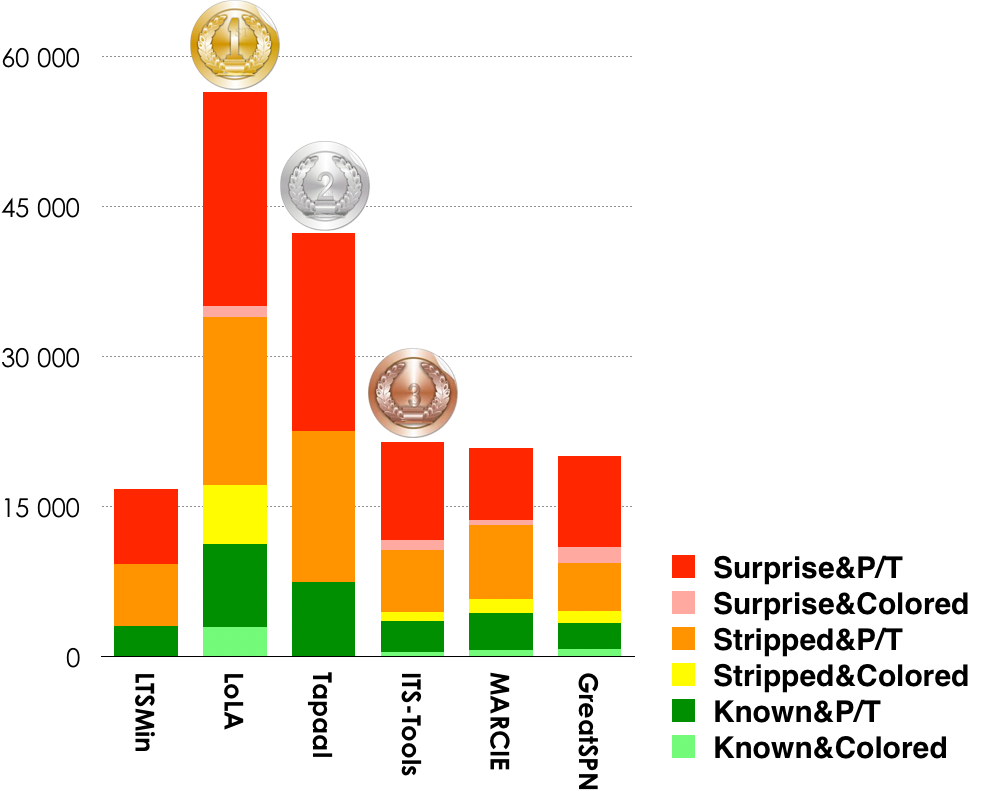
5.4. Winners in the CTL Formulas Category
5 tools out of 12 participated in these examinations (CTLCardinality and CTLFireability). Results based on the scoring shown below is:
- LoLA ranked first (56 429 pts),
- Tapaal ranked second (42 429 pts),
- ITS-Tools ranked third (21436 pts).
Then, tools rank in the following order: MARCIE (20 851 pts), GreatSPN (20 091 pts), and LSMin (16 792 pts).
| Estimated Tool Confidence rate for CTL (based on the «significant values» computed by tools) see section 6. for details |
|||
| Tool name | Reliability | Correct Values | «significant values» |
|---|---|---|---|
| GreatSPN | 99.07% | 6864 | 6928 |
| ITS-Tools | 100% | 7603 | 7603 |
| LoLA | 99.62% | 8598 | 8630 |
| LTSMin | 100% | 7055 | 7055 |
| MARCIE | 100% | 9115 | 9115 |
| Tapaal | 100% | 7462 | 7462 |
Please consider note 1 on tool confidence (bottom of this page).
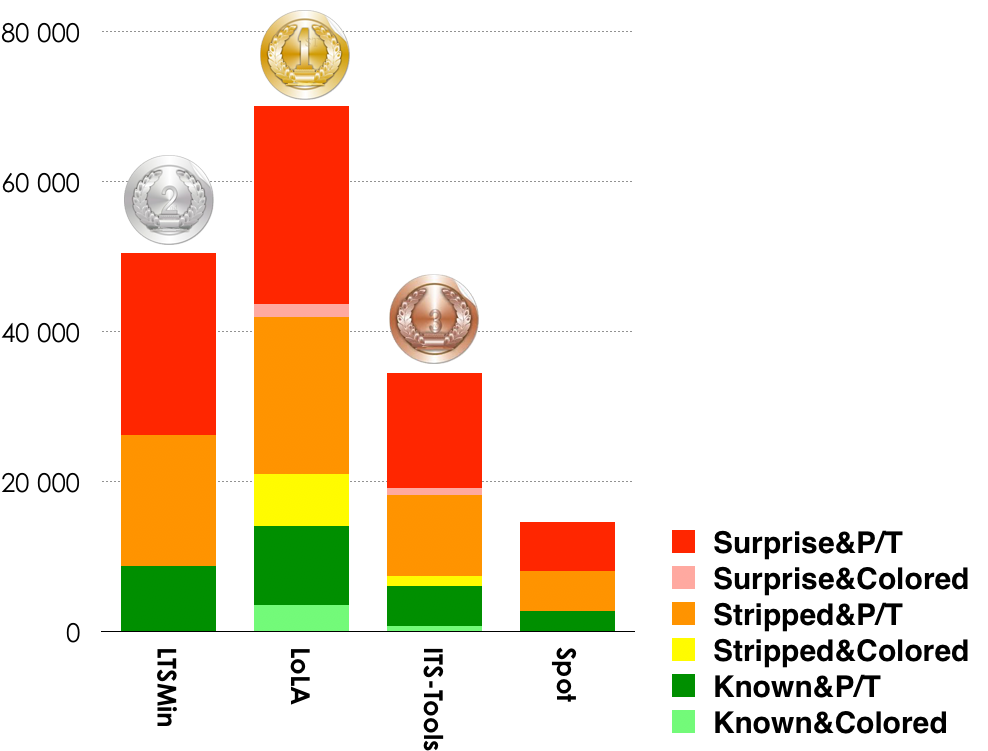
5.5. Winners in the LTL Formulas Category
4 tools out of 12 participated in these examinations (LTLCardinality and LTLFireability). Results based on the scoring shown below is:
- LoLA ranked first (70 127 pts),
- LTSMin ranked second (50 520 pts),
- ITS-Tools ranked third (34 419 pts).
Then, Spot ranks 4th (14 591 pts). Please note hat Spot was participating in the LTLCardinality examination only, which explains the gap between 3rd and 4th ranked tools.
| Estimated Tool Confidence rate for LTL (based on the «significant values» computed by tools) see section 6. for details |
|||
| Tool name | Reliability | Correct Values | «significant values» |
|---|---|---|---|
| ITS-Tools | 96.33% | 11809 | 12259 |
| LoLA | 99.97% | 13647 | 13651 |
| LTSMin | 100% | 13718 | 13718 |
| Spot | 100% | 5764 | 5764 |
Please consider note 1 on tool confidence (bottom of this page).
6. Estimation of Tool Confidence
As for last year, we tried to introduce some confidence analysis to enforce the computation of «right results» based on the answers of participating tools. To do so, we considered each value provided in the contest (a value is a partial result such as the result of a formula or a number provided for state space, bound computation, etc.). To do so, we processed as follows:
- For each «line» (all tools for a given examination for a given instance), we selected all «significant values» where at least 3 tools do agree.
- Based on this subset of values, we computed the ratio between the selected values for the tool and the number of good answers. This ratio gave us a tool confidence rate (called reliability rate last year) that is provided in the table below.
- This tool confidence rate rate was then applied to compute the scores presented in the dedicated section.
The table below provides, in first column, the computed confidence rates (that are naturally lower for tools where a bug was detected). Then, the table provides the number of correct results (column 2) out of the number of «significant values» selected for the tool (column 3). The last column shows the number of examination (and their type) the tool was involved in.
| Estimated Tool Confidence rate (based on the «significant values» computed by tools) | ||||
| Tool name | Reliability | Correct Values | «significant values» | Involved Examinations |
|---|---|---|---|---|
| GreatSPN | 99.13% | 21926 | 22118 | 7 (StateSpace, UpperBounds, ReachabilityDeadlock, ReachabilityCardinality, ReachabilityFireability, CTLCardinality, CTLFireability) |
| ITS-Tools | 96.91% | 42133 | 43478 | 9 (StateSpace, UpperBounds, ReachabilityDeadlock, ReachabilityCardinality, ReachabilityFireability, CTLCardinality, CTLFireability, LTLCardinality, LTLFireability) |
| LoLA | 99.92% | 44567 | 44603 | 7 (UpperBounds, ReachabilityCardinality, ReachabilityFireability, CTLCardinality, CTLFireability, LTLCardinality, LTLFireability) |
| LTSMin | 100% | 37487 | 37487 | 9 (StateSpace, UpperBounds, ReachabilityDeadlock, ReachabilityCardinality, ReachabilityFireability, CTLCardinality, CTLFireability, LTLCardinality, LTLFireability) |
| MARCIE | 100% | 27041 | 27041 | 7 (StateSpace, UpperBounds, ReachabilityDeadlock, ReachabilityCardinality, ReachabilityFireability, CTLCardinality, CTLFireability) |
| smart | 79.59% | 862 | 1083 | 1 (StateSpace) |
| Spot | 100% | 5764 | 5764 | 1 (LTLCardinality) |
| Tapaal | 100% | 27498 | 27498 | 7 (StateSpace, UpperBounds, ReachabilityDeadlock, ReachabilityCardinality, ReachabilityFireability, CTLCardinality, CTLFireability) |
| Tina.sift | 97.84% | 724 | 740 | 1 (StateSpace) |
| Tina.tedd | 100% | 1641 | 1641 | 1 (StateSpace) |
Note 1 on tool confidence: there was a late change in the «Known» model Simpleloadbal (and, subsequently, for its corresponding «Stripped» version) due to an unambiguity in the definition of color domains, detected during the qualification phase of some tools. Since it generated inconsistencies between the colored and version and its P/T equivalents depending of the ambiguous interpretation, it could potentially affecting the values of some results. Thus, tool confidence has been computed without the instances of this model. Simpleloadbal was not considered too when computing scores.