
Introduction
This page summarizes the results for the 2014 edition of the Model Checking Contest. This section is divided in three sections:
- the Participants section lists which tool participated in 2014 (with references to the tool distribution and the submission to the MCC),
- the Result section shows the winners, provides some factual information and also allows to access precise data about tool's execution and outputs,
- then Interpreting the correctness mask explains how to read details tables and provides an idea of our analysis algorithm to evaluate result correctness of results,
- finally, About score computation details the algorithm for computing points and honor points.
The Participants in 2014
Nine tools where submitted this year. Data about these submissions are summarized in the table below. For any tool, you may download the disk image that was provided with all its data. You may use these to reproduce measures locally and perform comparison with your own tool on the same benchmark.
| Summary of the Participating Tools (alphabetical order) | ||||
| Tool name | Representative Author | Origin | Link to the submitted disk image | Reported Techniques |
| Cunf | C. Rodriguez | ENS de Cachan & Univ. Oxford |  |
Net Unfolding, SAT/SMT |
| GreatSPN | M. Beccuti | Univ. Torino | |
Decision Diagrams, Symmetries |
| Helena | S. Evangelista | Univ Paris 13 | |
Explicit, Stubborn Sets |
| LoLa | N. Lohmann | Univ. Rostock | |
Explicit, State Compression, Stubborn Sets, Symmetries, Topological |
| Marcie | C. Rohr | Univ. Cottbus | |
Decision Diagrams |
| PNMC | A. Hamez | ISAE | |
Decision Diagrams |
| PNXDD | E. Paviot-Adet | Uiv. P. & M. Curie | |
Decision Diagrams, Topological |
| Stratagem | E. Lopez | Univ. Geneva | |
Decision Diagrams, Topological |
| Tapaal | J. Srba | Univ. Aalborg | |
Explicit, Structural Reductions |
The results
We first propose an access to the winner page for the categories of examinations and then some facts about this edition. You may also access detailed results (model per model) for a deeper analysis.
Winners
We set-up four categories of examinations to rate tools:
- State Space generation,
- Reachability analysis (gathering ReachabilityComputeBounds ReachabilityBounds ReachabilityDeadlock
ReachabilityCardinality
ReachabilityFireabilitySimple ReachabilityFireability), - CTL analysis (gathering CTLCardinality CTLFireabilitySimple CTLFireability),
- LTL analysis (gathering LTLCardinality LTLFireabilitySimple LTLFireability).
Access to detailed results
Results of the MCC'2014 are summarized as follows:
- A table per examination providing, a results computed for each examination,
- A table per examination providing, a correctness mask computed from the results of tools for each examination,
- A table per examination providing, the performances of tools for each model (we just report the execution information regardless of the results' correctness),
- A table per examination providing, a score for each tool; it also summarizes some data such as the computation rate or the correctness rate,
For those who want very detailed information ;-), you have:
- Consolidated CSV and XLS files (compressed, 3.1 MB),
- The full outputs from the benchmark execution, including traces from tools (compressed, 268 MB)
Facts about the MCC'2014
Each tool was submitted to 8040 executions in various conditions (670 model/instances and 12 examination per model/instance) for which it could report: DNC (do not compete), CC (cannot compute) or the result of the query. These executions were handled by BenchKit, that was developped in the context of the MCC for massive testing of software. Then, from the raw data provided by BenchKit, some post-analysis scripts consolidated these and computed a ranking. The table below shows some data about the involved machines and their contribution to the computation of these results.
| Involved Machines and Execution of the Benchmarks | |||
| Quadhexa-2 | Rented Machine | Total | |
| Cores | 24 @ 2.66GHz | 40 @ 2.5GHz | |
| Memory (GB) | 128 | 256 | |
| Used Cores | 21 | 39 | |
| Number of runs | 48 395 | 34 913 | 83 308 |
| Total computation time | 157 days, 0 hour, 10 minutes and 51 seconds | ||
| Time spent to complete benchmarks | 8 days, 21 hours, 50 minutes and 29 seconds | ||
| Boot time of VMs (overhead) | Approx 19 days, 4 hours (estimation) | ||
Please note that Quadhexa-2 was made available by colleagues at Université Paris Ouest Nanterre. The other machine was rent thanks to of the ImPro ANR blanc project.
Interpreting the correctness mask
Each result provided by a tool, is compared to those of others tools. The valid result (first blue column on Figure 1) is decided after the majority (second blue column on Figure 1). In our example, the examination involved 10 formulas which result is either true (T) of false (F).
When no majority is found for a result, we cannot decide and a dedicated sign (?) is used.
Please note that at this stage, our algorithm considers only the table line by line. Further improvements are planned to improve the confidence of tools according to their global results for the next editions of the MCC.
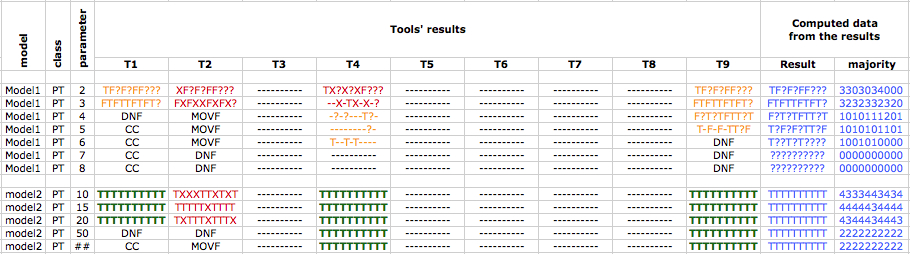
Figure 1 : snippet from a correctness mask
Then, for each tool and for each result, a mask is computed. It shows where the tool was right, where it was wrong, and where we cannot decide. The masks are displayed in the sub-columns of section "Tool's results" on Figure 1. Each digit must be read as follows:
- «T» or «F»: means a correct result for the corresponding formula (respectively true and false values),
- «X»: means that the tool was wrong compared to the computed solution,
- «?»: means that our current algorithm could not decide (no majority for a given solution),
- «-»: means that no result at all is computed (the tool states it cannot computes).
Such a table can help tool developers to see a comparison of their results against the majority of results in the contest. This should help then to detect bugs. They can also consider the reason why their tool did not computed any result:
- DNC means «Do Not Compete» (not seen in Figure 1),
- CC means «Cannot Compute» (Computation started but either the tool stated no results at all or it stated that a problem was encountered)
when a tool state a problem for one formula only, then, the result is noted «-», - DNF means «Do Not Finish» (computation exceeded the allocated time),
- MOVF means «Memory OVerFlow» (The tool could not finish due to memory problem - usually an overflow).
About score computation
Scores are computed as follows:
- First of all, we decided that no point should be provided as soon as a result is wrong in a given examination. So, when a result contains at least one «X» (red results in Figure 1), no point is given at all for this result, whatever the other results are. We also compare the result of each «scrambled» model to the corresponding «known» one and reject them when they differ for the computed values. Important: if only one tool computed a result, then no point is allocated too (no quorum to decide). Such points are then considered as «honor» points (since our decision algorithm reliability needs to be increased).
- Then, no point is given when our algorithm cannot state about a result («?»)
- Then, p points are allocated when the result is true(orange and green results in Figure 1). To maintain a balance between the examinations, the value of p is decided as follows:
- StateSpace: p=4 for the number of states and p=2 for the other values (number of transitions, maximum token per making, maximum token in any marking),
- ReachabilityDeadlock: p=5 since there are only two formulas to compute,
- all other formulas examinations: p=1 since there are 10 formulas to evaluate.
- Finally, bonuses are applied:
- +1 for the fastest tool in the line,
- +1 for the smallest tool in the line (in terms of memory footprint),
- +2 per model for the tool(s) that compute (correctly) the highest number of instances (gained even if the tool is alone for some executions),
- +3 per model for the tool(s) that compute (correctly) all instances for the model (gained even if the tool is alone for some executions)
- x2 for «scrambled» models («known» showed as if they where «surprise» ones, i.e. without tool-specific additional information)
- x3 for «surprise» models (those submitted in 2014)
Let us exemplify this on the snippet of Figure 1 (we do not consider the bonus for scrambled or surprise models):
- Tool T1 gets 14 points for model1 and 30 points for model 2 ; in addition, it will get +1 each time it is the fastest or the smallest,
- Tool T2 gets 0 points,
- Tool T4 gets 1 point for model1 and 50 + 2 + 3 point for model 2 ; in addition, it will get +1 each time it is the fastest or the smallest,
- Tool T9 gets 27 + 2 points for model1 and 50 + 2 + 3 points for model 2 ; in addition, it will get +1 each time it is the fastest or the smallest,
All others tools do not compete for his examination (or could not complete any result).