

1. Introduction
This page summarizes the results for the 2020 edition of the Model Checking Contest (MCC’2020). This page is divided in three sections:
- First, we list the qualified tools for the MCC'2020,
- Then, we provide some informations about the experimental conditions of the MCC'2020,
- Then, we present an access to details about results,
- Then, we provide the list of winners of the MCC'2020,
- Finally, we provide an attempt to evaluate tool reliability based on the comparison of the results provided in the contest.
IMPORTANT:all these documents can be reused in scientific material and papers but must respect the Creative Common license CC-BY-NC-SA.
2. List of Qualified Tools in 2020
Ten tools where submitted this year. They all successfully went through a qualification process requiring about 1500 runs (each tool had to answer each examination for the first instance of each «known» model).
Data about these tools are summarized in the table below. For any tool, you can download the disk image that was provided with all its data. You may use these to reproduce measures locally and perform comparison with your own tool on the same benchmark. Please note that one tool (with two variants) was out of competition this year: this was agreed between the tool developer and the organizers and is part of an experiment with precomputed deep-learning.
IMPORTANT: all tool developers agreed to provide the original image disk embedding the tool they submitted his year (see links in the table below). You may operate these tools on your own. To do so, you need the second disk image (mounted by the other one) that contains all models for 2020 together with the produced formulas. This image is mounted with the default configuration, as well as in he default disk image provided in the tool submission kit (see here).
IMPORTANT: You also have access to the archive containing all models and the corresponding formulas for 2020 here.
| Summary of the Participating Tools | ||||||
| Tool name | Supported Petri nets |
Representative Author | Origin | Type of execution | Link to the submitted disk image | Reported Techniques (all examinations) |
|---|---|---|---|---|---|---|
| enPAC | P/T | Cong He & Shuo Li | Tongji University, Shanghai (China) | Sequential Processing |  |
ABSTRACTIONS EXPLICIT SEQUENTIAL_PROCESSING USE_NUPN |
| GreatSPN-Meddly | P/T and colored | Elvio Amparore | Univ. Torino (Italy) | Collateral Processing | |
DECISION_DIAGRAMS PARALLEL_PROCESSING TOPOLOGICAL UNFOLDING_TO_PT USE_NUPN |
| ITS-Tools | P/T and colored | Yann Thierry-Mieg | Sorbonne Université | Collateral Processing | |
BESTFIRST_WALK COLLATERAL_PROCESSING DECISION_DIAGRAMS EXHAUSTIVE_WALK INITIAL_STATE K_INDUCTION OVER_APPROXIMATION PARIKH_WALK PROBABILISTIC_WALK RANDOM_WALK SAT_SMT STRUCTURAL_REDUCTION TAUTOLOGY TOPOLOGICAL USE_NUPN |
| ITS-LoLA | P/T and colored | Yann Thierry-Mieg | Sorbonne Université | Collateral Processing | |
BESTFIRST_WALK COLLATERAL_PROCESSING EXHAUSTIVE_WALK EXPLICIT INITIAL_STATE OVER_APPROXIMATION PARIKH_WALK PROBABILISTIC_WALK RANDOM_WALK SAT_SMT SEQUENTIAL_PROCESSING STATE_COMPRESSION STRUCTURAL_REDUCTION STUBBORN_SETS SYMMETRIES TOPOLOGICAL UNFOLDING_TO_PT USE_NUPN |
| smart | P/T | Junad Babar & Andrew Miner | Iowa State University | Sequential Processing | |
DECISION_DIAGRAMS IMPLICIT IMPLICIT_RELATION RELATIONS SATURATION SEQUENTIAL_PROCESSING |
| Tapaal | P/T and colored | Jiri Srba | Aalborg Universitet | Collateral Processing | |
COLLATERAL_PROCESSING CPN_APPROX CTL_CZERO EXPLICIT LP_APPROX QUERY_REDUCTION SAT_SMT SIPHON_TRAP STATE_COMPRESSION STRUCTURAL_REDUCTION STUBBORN_SETS TOPOLOGICAL TRACE_ABSTRACTION_REFINEMENT UNFOLDING_TO_PT |
| TINA.tedd | P/T and colored | Bernard Berthomieu & Silvano Dal Zilio | LAAS/CNRS/Université de Toulouse | Sequential Processing | |
DECISION_DIAGRAMS IMPLICIT LINEAR_EQUATIONS SEQUENTIAL_PROCESSING STRUCTURAL_REDUCTION TOPOLOGICAL UNFOLDING_TO_PT USE_NUPN |
The table below lists the techniques reported per examination (and for all the tool variants when applicable).
| Techniques Reported by the Participating Tools (per examination) | ||||||
| Tool name | StateSpace | GlobalProperties | UpperBounds | Reachability | CTL | LTL |
|---|---|---|---|---|---|---|
| enPAC | — | — | — | — | — | ABSTRACTIONS EXPLICIT SEQUENTIAL_PROCESSING USE_NUPN |
| GreatSPN-Meddly | DECISION_DIAGRAMS PARALLEL_PROCESSING TOPOLOGICAL UNFOLDING_TO_PT USE_NUPN | DECISION_DIAGRAMS PARALLEL_PROCESSING TOPOLOGICAL UNFOLDING_TO_PT USE_NUPN | DECISION_DIAGRAMS PARALLEL_PROCESSING TOPOLOGICAL UNFOLDING_TO_PT USE_NUPN | DECISION_DIAGRAMS PARALLEL_PROCESSING TOPOLOGICAL UNFOLDING_TO_PT USE_NUPN | DECISION_DIAGRAMS PARALLEL_PROCESSING TOPOLOGICAL UNFOLDING_TO_PT USE_NUPN | DECISION_DIAGRAMS PARALLEL_PROCESSING TOPOLOGICAL UNFOLDING_TO_PT USE_NUPN |
| ITS-Tools | DECISION_DIAGRAMS TOPOLOGICAL USE_NUPN | DECISION_DIAGRAMS RANDOM_WALK SAT_SMT STRUCTURAL_REDUCTION TOPOLOGICAL USE_NUPN | DECISION_DIAGRAMS TOPOLOGICAL USE_NUPN | BESTFIRST_WALK COLLATERAL_PROCESSING DECISION_DIAGRAMS EXHAUSTIVE_WALK INITIAL_STATE K_INDUCTION OVER_APPROXIMATION PARIKH_WALK PROBABILISTIC_WALK RANDOM_WALK SAT_SMT STRUCTURAL_REDUCTION TAUTOLOGY TOPOLOGICAL USE_NUPN | DECISION_DIAGRAMS INITIAL_STATE TOPOLOGICAL USE_NUPN | DECISION_DIAGRAMS INITIAL_STATE TOPOLOGICAL USE_NUPN |
| ITS-LoLA | — | COLLATERAL_PROCESSING EXPLICIT INITIAL_STATE SAT_SMT SEQUENTIAL_PROCESSING STATE_COMPRESSION STUBBORN_SETS SYMMETRIES TOPOLOGICAL UNFOLDING_TO_PT USE_NUPN | COLLATERAL_PROCESSING EXPLICIT INITIAL_STATE SAT_SMT SEQUENTIAL_PROCESSING STATE_COMPRESSION STUBBORN_SETS SYMMETRIES TOPOLOGICAL UNFOLDING_TO_PT USE_NUPN | BESTFIRST_WALK COLLATERAL_PROCESSING EXHAUSTIVE_WALK EXPLICIT INITIAL_STATE OVER_APPROXIMATION PARIKH_WALK PROBABILISTIC_WALK RANDOM_WALK SAT_SMT STATE_COMPRESSION STRUCTURAL_REDUCTION STUBBORN_SETS SYMMETRIES TOPOLOGICAL UNFOLDING_TO_PT USE_NUPN | COLLATERAL_PROCESSING EXPLICIT INITIAL_STATE SAT_SMT STATE_COMPRESSION STUBBORN_SETS SYMMETRIES TOPOLOGICAL UNFOLDING_TO_PT USE_NUPN | COLLATERAL_PROCESSING EXPLICIT INITIAL_STATE SAT_SMT STATE_COMPRESSION STUBBORN_SETS SYMMETRIES TOPOLOGICAL UNFOLDING_TO_PT USE_NUPN |
| smart | DECISION_DIAGRAMS IMPLICIT RELATIONS SEQUENTIAL_PROCESSING | DECISION_DIAGRAMS IMPLICIT_RELATION SATURATION | DECISION_DIAGRAMS SEQUENTIAL_PROCESSING | DECISION_DIAGRAMS SEQUENTIAL_PROCESSING | DECISION_DIAGRAMS SEQUENTIAL_PROCESSING | — |
| Tapaal | EXPLICIT STATE_COMPRESSION | COLLATERAL_PROCESSING CTL_CZERO EXPLICIT LP_APPROX QUERY_REDUCTION SAT_SMT SIPHON_TRAP STATE_COMPRESSION STRUCTURAL_REDUCTION STUBBORN_SETS TOPOLOGICAL TRACE_ABSTRACTION_REFINEMENT UNFOLDING_TO_PT | COLLATERAL_PROCESSING EXPLICIT QUERY_REDUCTION SAT_SMT STATE_COMPRESSION STRUCTURAL_REDUCTION STUBBORN_SETS TRACE_ABSTRACTION_REFINEMENT | COLLATERAL_PROCESSING CPN_APPROX EXPLICIT LP_APPROX QUERY_REDUCTION SAT_SMT STATE_COMPRESSION STRUCTURAL_REDUCTION STUBBORN_SETS TRACE_ABSTRACTION_REFINEMENT UNFOLDING_TO_PT | COLLATERAL_PROCESSING CPN_APPROX CTL_CZERO EXPLICIT LP_APPROX QUERY_REDUCTION SAT_SMT STATE_COMPRESSION STRUCTURAL_REDUCTION STUBBORN_SETS TRACE_ABSTRACTION_REFINEMENT UNFOLDING_TO_PT | — |
| TINA.tedd | DECISION_DIAGRAMS IMPLICIT LINEAR_EQUATIONS SEQUENTIAL_PROCESSING STRUCTURAL_REDUCTION TOPOLOGICAL UNFOLDING_TO_PT USE_NUPN | — | — | — | — | — |
3. Experimental Conditions of the MCC'2020
Each tool was submitted to 15 977 executions in various conditions (1 229 model/instances and 13 examinations per model/instance) for which it could report: DNC (do not compete), CC (cannot compute) or the result of the query. These executions were handled by BenchKit, that was developed in the context of the MCC for massive testing of software. Then, from the raw data provided by BenchKit, some post-analysis scripts consolidated these and computed a ranking.
16 GB of memory were allocated to each virtual machine (both parallel and sequential tools) and a confinement of one hour was considered (execution aborted after one hour). So, a total of 127 816 runs (execution of one examination by the virtual machine) generated 30 GB of raw data (essentially log files and CSV of sampled data).
The table below shows some data about the involved machines and their contribution to the computation of these results. This year, we affected only physical cores to the virtual machines (discarding logical cores obtained from hyper-threading) so the balance between the various machine we used is quite different from he one of past years.
| Involved Machines and Execution of the Benchmarks | |||||||
| Caserta | Tajo | Ebro | Octoginta-2 | Small | Total | ||
|---|---|---|---|---|---|---|---|
| Physical Cores | 96 @ 2.20GHz | 96 @ 2.40GHz | 32 @ 2.7GHz | 80 @ 2.4GHz | 11×12 @ 2.4GHz | — | |
| Memory (GB) | 2048 | 1536 | 1024 | 1536 | 11×64 | — | |
| Used Cores (sequential tools) | 95, 95 VM in // |
95, 95 VM in // |
31, 31 VM in // |
79, 79 VM in // |
11×3, 11×3 VM in // |
— | |
| Used Cores (parallel tools) | 92 (4 per VM), 23 VM in // |
92 (4 per VM), 23 VM in // |
28 (4 per VM), 7 VM in // |
76 (4 per VM), 19 VM in // |
11×8 (4 per VM), 13×2 VM in // |
— | |
| Number of runs | 20 096 | 38 792 | 8 112 | 34 112 | 26 104 | 127 816 | |
| Total CPU consumed | 323d, 12h, 20m, 55s | 653d, 0h, 10m, 39s | 138d, 13h, 41m, 20s | 500d, 21h, 44m, 44s | 488d, 0h, 45m, 27s | 2104d, 0h, 43m, 5s | |
| Total CPU | About 5 years, 9 months and 9 days | — | |||||
| Time spent to complete benchmarks | About 29 days | — | |||||
| Estimated boot time of VMs + management (overhead) |
11d, 4h (Included in total CPU) so ≅ 5 ‰ overhead | — | |||||
We are pleased to thanks those who helped in the execution of tools:
- Caserta was made available by colleagues at University of Twente,
- Tajo and Ebro were made available by colleagues at Rostock University,
- Octoginta-2 were made available by colleagues at Université Paris Nanterre and was partially funded by LIP6,
- Quadhexa-2 were made available by colleagues at Université Paris Nanterre (used to produce formulas),
- Small is one of the two clusters at LIP6 (we got 11 nodes out of 23) Sorbonne Université.
4. The Results of the MCC’2020
This First table below presents detailed results about the MCC'2020.
| Details about the Examinations in the MCC'g (part I): Details about Results and Scoring + Model Performance Charts |
|||
| Details about Results and Scoring |
Model Performance Charts |
Tool Resource consumption |
|
|---|---|---|---|
| StateSpace | |||
| ReachabilityDeadlock (GlobalProperties) | |||
| QuasiLiveness (GlobalProperties) | |||
| StableMarking (GlobalProperties) | |||
| Liveness (GlobalProperties) | |||
| OneSafe (GlobalProperties) | |||
| UpperBounds | |||
| ReachabilityCardinality | |||
| ReachabilityFireability | |||
| CTLCardinality | |||
| CTLFireability | |||
| LTLCardinality | |||
| LTLFireability | |||
This Second table below presents some performance analysis related to tools during the MCC'2020.
| Details about the examinations in the MCC'2020 (part II)Tool Performance Charts | ||||
| All models |
«Surprise» models only |
«Known» models only |
||
|---|---|---|---|---|
| enPAC | ||||
| GreatSPN-Meddly | ||||
| ITS-Tools | ITS-LoLA | |||
| smart | ||||
| Tapaal | ||||
| TINA.tedd | ||||
| 2019-Gold | ||||
You can download the full archive (2.8 GB compressed and 30 GB uncompressed) of the 127 816 runs processed to compute the results of the MCC'2020. This archive contains execution traces, execution logs and sampling, as well as a large CSV files that summarizes all the executions and gnuplot scripts and data to generate the charts produced in the web site (please have a look on the READ_ME.txt file). Yo may get separately the two mostly interesting CSV files:
- GlobalSummary.csv that summarizes all results from all runs in the contest (24 MB when expanded),
- raw-result-analysis.csv that contains the same data as the previous one but enriched with scoring information and the expected results (computed as a majority of tools pondered by their confidence rate, 29 MB when expanded).
Note that from the two CSV file, you can identify the unique run identifier that allows you to find the traces and any information in the archive (they are also available on the web site when the too did participated).
5. The Winners for the MCC'2020
This section presents the results for the main examinations that are:
- State Space generation,
- UpperBounds computation,
- GlobalProperties computation (ReachabilityDeadlock , QuasiLiveness, StableMarking, Liveness, OneSafe),
- Reachability Formulas (ReachabilityCardinality, ReachabilityFireability),
- CTL Formulas (CTLCardinality, CTLFireability),
- LTL Formulas (LTLCardinality, LTLFireability),
To avoid a too large disparity between models with numerous instances and those with only one, a normalization was applied so that the score, for an examination and a model, varies between 102 and 221 points. Therefore, providing a correct value may brings a different number of points according to the considered model. A multiplier was applied depending to the model category:
- ×1 for «Known» models,
- ×4 for «Surprise» models.
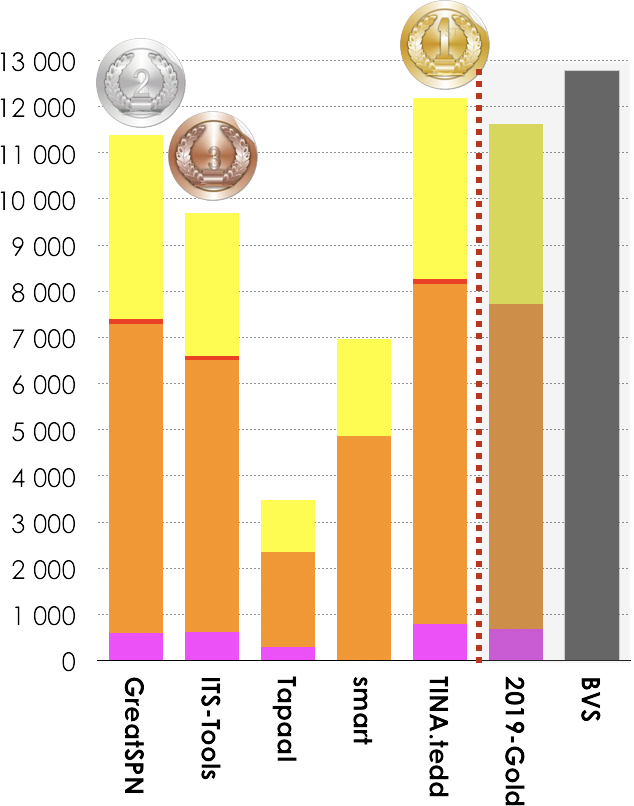
5.1. Winners in the StateSpace Category
5 tools out of 7 participated in this examination. Results based on the scoring shown below is:
- TINA.tedd ranked first (12 179 pts),
- GreatSPN ranked second (11 391),
- ITS-Tools ranked third (9 693 pts).
Then, tools rank in the following order: smart (6 956 pts), Tapaal (4 248 pts) and Tapaal (3 840 pts). The Gold-medal of 2019 collected 11 620 pts. BVS (Best Virtual Score tool) collected 12 776 points.
 |
  GreatSPN (fastest 307 times)  2019-Gold (less memory 773 times) |
| Estimated Tool Confidence rate for StateSpace (based on the «significant values» computed by tools) see section 6. for details |
|||
| Tool name | Reliability | Correct Values | «significant values» |
|---|---|---|---|
| GreatSPN | 100.00% | 2669 | 2669 |
| ITS-Tools | 99.85% | 2008 | 2011 |
| Tapaal | 100.00% | 713 | 713 |
| smart | 100.00% | 1620 | 1620 |
| TINA.tedd | 100.00% | 2791 | 2791 |
| 2019-Gold | 99.71% | 2778 | 2778 |
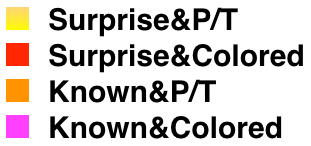
5.2. Winners in the GlobalProperties Category
5 tools out of 7 participated in these examinations (ReachabilityDeadlock , QuasiLiveness, StableMarking, Liveness, OneSafe). Results based on the scoring shown below is:
- Tapaal ranked first (71 140 pts),
- GreatSPN ranked second (52 410 pts),
- smart ranked third (28 499 pts).
Then, tools rank in the following order: ITS-LoLA (17 140 pts) and ITS-Tools (17 102 pts). There was numerous new examinations in this category so comparison with 2019-Gold has no meaning. BVS (Best Virtual Score tool) collected 77 883 points.
Tapaal got both awards (Fastest-Tool and Smallest Memory Footprint).
 |
Tapaal (fastest 4021 times) Tapaal (less memory 2699 times) |
| Estimated Tool Confidence rate for GlobalPropertiesScores (based on the «significant values» computed by tools) see section 6. for details |
|||
| Tool name | Reliability | Correct Values | «significant values» |
|---|---|---|---|
| GreatSPN | 100.00% | 1793 | 1793 |
| ITS-Tools | 100.00% | 1052 | 1052 |
| ITS-LoLA | 100.00% | 1050 | 1050 |
| Tapaal | 100.00% | 2126 | 2126 |
| smart | 100.00% | 1464 | 1464 |
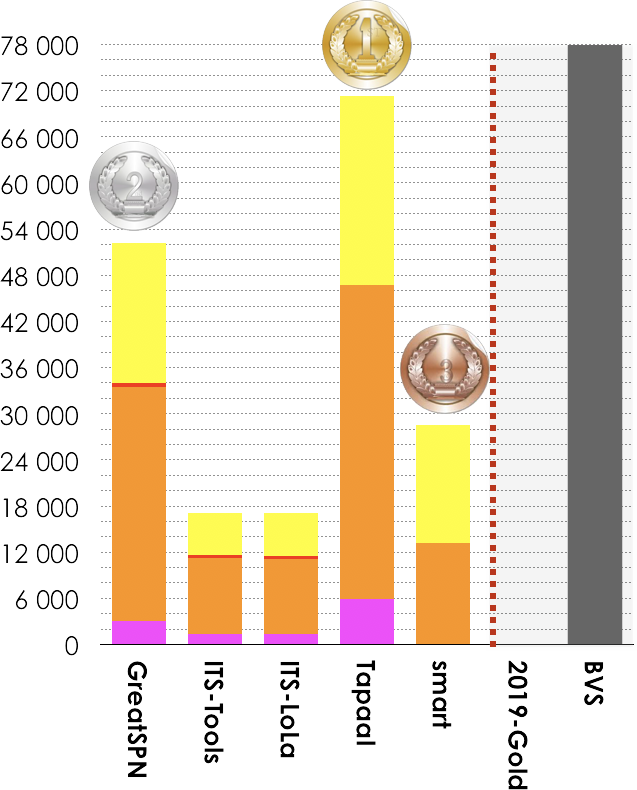
5.3. Winners in the UpperBounds Category
5 tools out of 7 participated in this examination. Results based on the scoring shown below is:
- ITS-LoLA ranked first (16 350 pts),
- Tapaal ranked second (15 629 pts),
- GreatSPN ranked third (11 199 pts).
Then, tools rank in the following order: ITS-Tools (10 611 pts), and smart (7 236 pts). The Gold-medal of 2019 collected 16 294 pts. BVS (Best Virtual Score tool) collected 16 972 points.
 |
GreatSPN (fastest 411 times) 2019-Gold (less memory 957 times) |
| Estimated Tool Confidence rate for UpperBound (based on the «significant values» computed by tools) see section 6. for details |
|||
| Tool name | Reliability | Correct Values | «significant values» |
|---|---|---|---|
| GreatSPN | 100.00% | 11457 | 11457 |
| ITS-Tools | 100.00% | 10150 | 10150 |
| ITS-LoLA | 100.00% | 16433 | 16433 |
| Tapaal | 100.00% | 16021 | 16021 |
| smart | 100.00% | 6717 | 6717 |
| 2019-Gold | 100.00% | 16674 | 16674 |
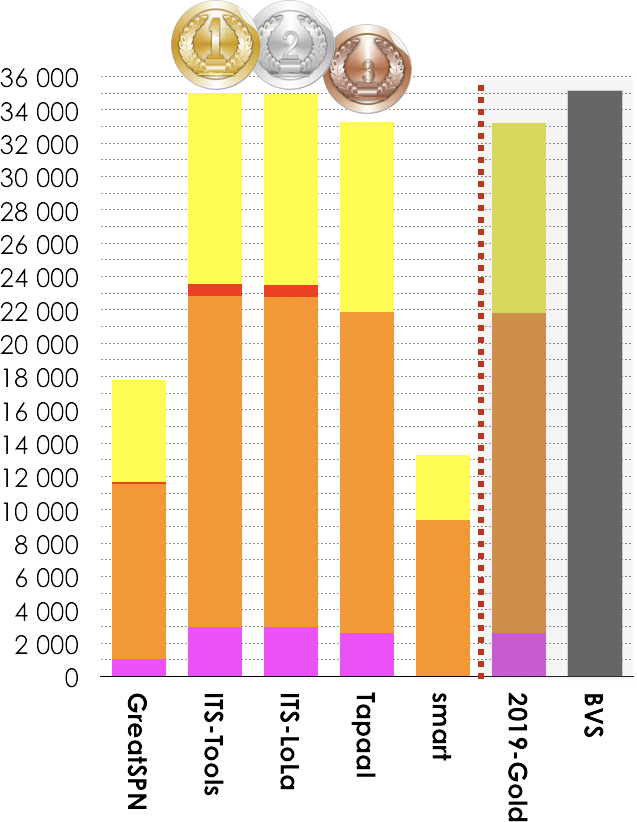
5.4. Winners in the Reachability Formulas Category
5 tools out of 7 participated in these examinations (ReachabilityCardinality and ReachabilityFireability). Results based on the scoring shown below is:
- ITS-Tools ranked first (35 001 pts),
- ITS-LoLA ranked second (34 962 pts),
- Tapaal ranked third (33 298 pts).
Then, tools rank in the following order: GreatSPN (17 783 pts), and smart (13 280 pts). The Gold-medal of 2019 collected 33 211 pts. BVS (Best Virtual Score tool) collected 35 134 points.
 |
ITS-Tools (fastest 910 times) 2019-Gold (less memory 1 943 times) |
| Estimated Tool Confidence rate for Reachability (based on the «significant values» computed by tools) see section 6. for details |
|||
| Tool name | Reliability | Correct Values | «significant values» |
|---|---|---|---|
| GreatSPN | 100.00% | 17397 | 17397 |
| ITS-Tools | 99.98% | 36210 | 36216 |
| ITS-LoLA | 99.99% | 36216 | 36219 |
| Tapaal | 100.00% | 35739 | 35739 |
| smart | 100.00% | 12690 | 12690 |
| 2019-Gold | 100.00% | 35726 | 35726 |
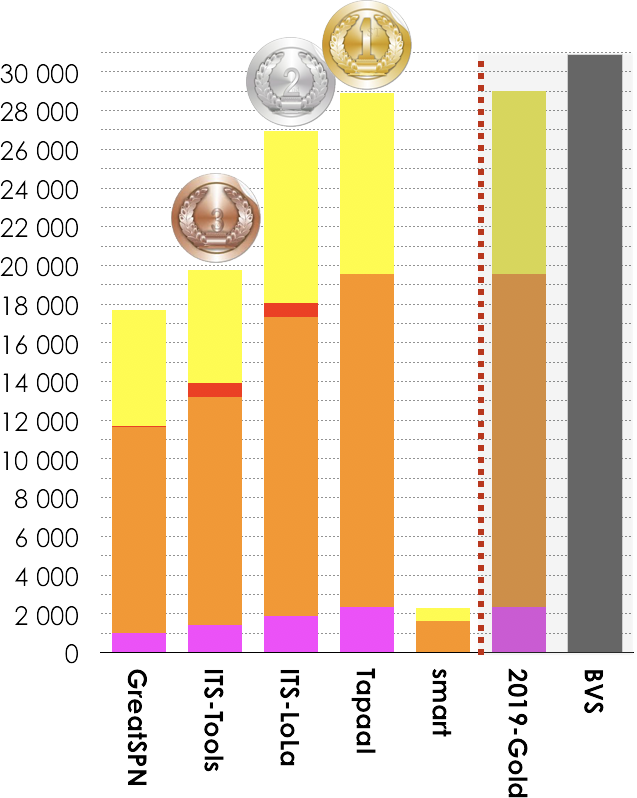
5.5. Winners in the CTL Formulas Category
5 tools out of 7 participated in these examinations (CTLCardinality and CTLFireability). Results based on the scoring shown below is:
- Tapaal ranked first (28 886 pts),
- ITS-LoLA ranked second (26 929 pts),
- ITS-Tools ranked third (19 790 pts).
Then, tools rank in the following order: GreatSPN (17 699 pts), and smart (2 279 pts). The Gold-medal of 2019 collected 29 036 pts. BVS (Best Virtual Score tool) collected 30 892 points.
 |
GreatSPN (fastest 462 times) 2019-Gold (less memory 747 times) |
| Estimated Tool Confidence rate for CTL (based on the «significant values» computed by tools) see section 6. for details |
|||
| Tool name | Reliability | Correct Values | «significant values» |
|---|---|---|---|
| GreatSPN | 100.00% | 16380 | 16380 |
| ITS-Tools | 100.00% | 18618 | 18618 |
| ITS-LoLA | 99.99% | 26485 | 26487 |
| Tapaal | 100.00% | 27816 | 27816 |
| smart | 97.51% | 2736 | 2806 |
| 2019-Gold | 100.00% | 27790 | 27790 |
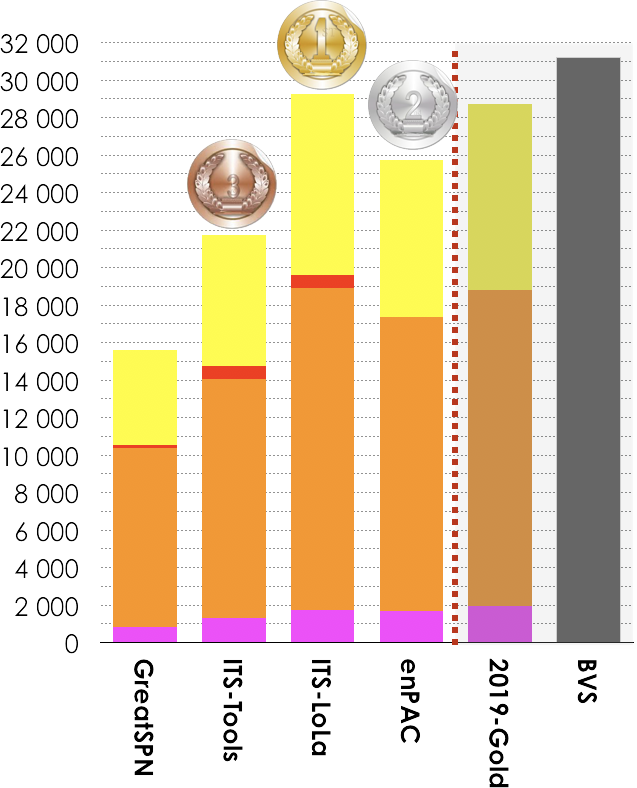
5.6. Winners in the LTL Formulas Category
4 tools out of 7 participated in these examinations (LTLCardinality and LTLFireability). Results based on the scoring shown below is:
- ITS-LoLA ranked first (29 237 pts),
- enPAC ranked second (25 751 pts, ITS-Tools.M collected 17 102 pt),
- ITS-Tools ranked third (21 715 pts).
Then, tools rank in the following order: GreatSPN (15 605 pts). The Gold-medal of 2019 collected 28 697 pts. BVS (Best Virtual Score tool) collected 31 158 points.
 |
2019-Gold (fastest 389 times) 2019-Gold (less memory 1 779 times) |
| Estimated Tool Confidence rate for LTL (based on the «significant values» computed by tools) see section 6. for details |
|||
| GreatSPN | 97.15% | 15593 | 16051 |
| ITS-Tools | 100.00% | 20734 | 20734 |
| ITS-LoLA | 99.97% | 28056 | 28064 |
| enPAC | 99.08% | 25442 | 25677 |
| 2019-Gold | 99/99% | 27501 | 27505 |
6. Estimation of the Global Tool Confidence
A confidence analysis enforces the computation of «right results» based on the answers of participating tools. To do so, we considered each value provided in the contest (a value is a partial result such as the result of a formula or a number provided for state space, bound computation, etc.). To do so, we processed as follows:
- For each «line» (all tools for a given examination for a given instance), we selected all «significant values» where at least 3 tools do agree.
- Based on this subset of values, we computed the ratio between the selected values for the tool and the number of good answers hey provide for such values. This ratio gave us a tool confidence rate that is provided in the table below.
- This tool confidence rate rate was then applied to compute the scores presented in the dedicated section.
The table below provides, in first column, the computed confidence rates (that are naturally lower for tools where a bug was detected). Then, the table provides the number of correct results (column 2) out of the number of «significant values» selected for the tool (column 3). The last column shows the number of examinations (and their type) the tool was involved in.
| Estimated Tool Confidence rate (based on the «significant values» computed by tools) | ||||
| Tool name | Reliability | Correct Values | «significant values» | Involved Examinations |
|---|---|---|---|---|
| GreatSPN | 99.30% | 65309 | 65767 | 13 CTLCardinality, CTLFireability, LTLCardinality, LTLFireability, Liveness, OneSafe, QuasiLiveness, ReachabilityCardinality, ReachabilityDeadlock, ReachabilityFireability, StableMarking, StateSpace, UpperBounds |
| ITS-Tools | 99.99% | 88772 | 88781 | 9 CTLCardinality, CTLFireability, LTLCardinality, LTLFireability, ReachabilityCardinality, ReachabilityDeadlock, ReachabilityFireability, StateSpace, UpperBounds |
| ITS-LoLA | 99.98% | 108240 | 108253 | 8 CTLCardinality, CTLFireability, LTLCardinality, LTLFireability, ReachabilityCardinality, ReachabilityDeadlock, ReachabilityFireability, UpperBounds |
| Tapaal | 100% | 82415 | 82415 | 11CTLCardinality, CTLFireability, Liveness, OneSafe, QuasiLiveness, ReachabilityCardinality, ReachabilityDeadlock, ReachabilityFireability, StableMarking, StateSpace, UpperBounds |
| enPAC | 99.08% | 25442 | 25677 | 2 LTLCardinality, LTLFireability |
| smart | 99.64% | 25227 | 25317 | 11 CTLCardinality, CTLFireability, Liveness, OneSafe, QuasiLiveness, ReachabilityCardinality, ReachabilityDeadlock, ReachabilityFireability, StableMarking, StateSpace, UpperBounds |
| TINA.tedd | 100% | 2791 | 2791 | 1 StateSpace |
| 2019-Gold | 99.99% | 110469 | 110481 | 8 CTLCardinality, CTLFireability, LTLCardinality, LTLFireability, ReachabilityCardinality, ReachabilityFireability, StateSpace, UpperBounds |