

About the Execution of ITS-Tools for GPUForwardProgress-PT-28b
| Execution Summary | |||||
| Max Memory Used (MB) |
Time wait (ms) | CPU Usage (ms) | I/O Wait (ms) | Computed Result | Execution Status |
| 479.516 | 12845.00 | 31841.00 | 40.80 | F | normal |
Execution Chart
We display below the execution chart for this examination (boot time has been removed).
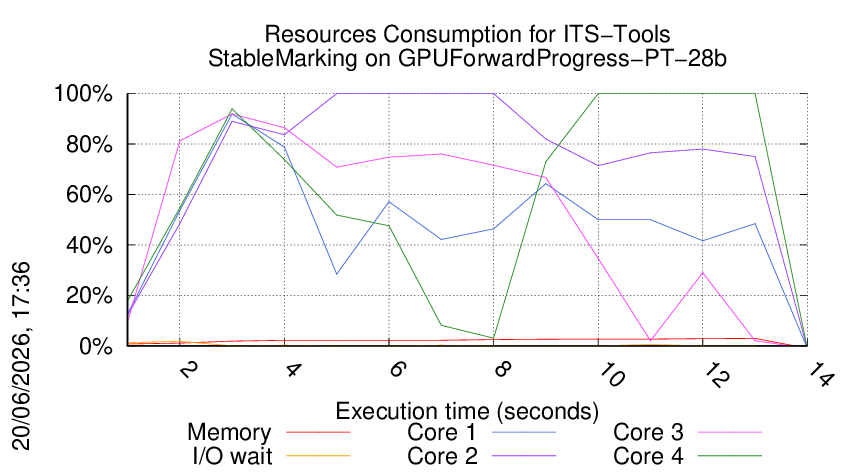
Trace from the execution
Formatting '/data/fkordon/mcc2026-input.r152-tall-177961077500303.qcow2', fmt=qcow2 size=4294967296 backing_file=/data/fkordon/mcc2026-input.qcow2 backing_fmt=qcow2 cluster_size=65536 lazy_refcounts=off refcount_bits=16
Waiting for the VM to be ready (probing ssh)
........................................................
=====================================================================
Generated by BenchKit 2-5973
Executing tool itstools
Input is GPUForwardProgress-PT-28b, examination is StableMarking
Time confinement is 1800 seconds
Memory confinement is 16384 MBytes
Number of cores is 4
Run identifier is r152-tall-177961077500303
=====================================================================
--------------------
preparation of the directory to be used:
/home/mcc/execution
total 480K
-rw-r--r-- 1 mcc users 5.5K Mar 7 11:34 CTLCardinality.txt
-rw-r--r-- 1 mcc users 53K Mar 7 11:34 CTLCardinality.xml
-rw-r--r-- 1 mcc users 5.4K Mar 7 11:34 CTLFireability.txt
-rw-r--r-- 1 mcc users 46K Mar 7 11:34 CTLFireability.xml
-rw-r--r-- 1 mcc users 3.6K Mar 15 10:38 LTLCardinality.txt
-rw-r--r-- 1 mcc users 25K Mar 15 10:38 LTLCardinality.xml
-rw-r--r-- 1 mcc users 2.3K Mar 15 10:38 LTLFireability.txt
-rw-r--r-- 1 mcc users 17K Mar 15 10:38 LTLFireability.xml
-rw-r--r-- 1 mcc users 6.7K Mar 7 11:34 ReachabilityCardinality.txt
-rw-r--r-- 1 mcc users 59K Mar 7 11:34 ReachabilityCardinality.xml
-rw-r--r-- 1 mcc users 7.6K Mar 7 11:34 ReachabilityFireability.txt
-rw-r--r-- 1 mcc users 61K Mar 7 11:34 ReachabilityFireability.xml
-rw-r--r-- 1 mcc users 1.8K Mar 15 10:38 UpperBounds.txt
-rw-r--r-- 1 mcc users 3.8K Mar 15 10:38 UpperBounds.xml
-rw-r--r-- 1 mcc users 6 Mar 3 18:30 equiv_col
-rw-r--r-- 1 mcc users 4 Mar 3 18:30 instance
-rw-r--r-- 1 mcc users 6 Mar 3 18:30 iscolored
-rw-r--r-- 1 mcc users 141K Mar 3 18:30 model.pnml
--------------------
content from stdout:
=== Data for post analysis generated by BenchKit (invocation template)
The expected result is a vector of booleans
BOOL_VECTOR
FORMULA_NAME StableMarking
=== Now, execution of the tool begins
BK_START 1779701018117
Invoking MCC driver with
BK_TOOL=itstools
BK_EXAMINATION=StableMarking
BK_BIN_PATH=/home/mcc/BenchKit/bin/
BK_TIME_CONFINEMENT=1800
BK_INPUT=GPUForwardProgress-PT-28b
BK_MEMORY_CONFINEMENT=16384
Not applying reductions.
Model is PT
StableMarking PT
Running Version 202604301425
[2026-05-25 09:23:39] [INFO ] Running its-tools with arguments : [-pnfolder, /home/mcc/execution, -examination, StableMarking, -its, -ltsmin, -greatspnpath, /home/mcc/BenchKit/bin//../itstools/bin//..//greatspn/, -order, META, -manyOrder, -smt, -timeout, 1800]
[2026-05-25 09:23:39] [INFO ] Parsing pnml file : /home/mcc/execution/model.pnml
[2026-05-25 09:23:39] [INFO ] Load time of PNML (sax parser for PT used): 91 ms
[2026-05-25 09:23:39] [INFO ] Transformed 568 places.
[2026-05-25 09:23:39] [INFO ] Transformed 597 transitions.
[2026-05-25 09:23:39] [INFO ] Found NUPN structural information;
[2026-05-25 09:23:39] [INFO ] Parsed PT model containing 568 places and 597 transitions and 1477 arcs in 182 ms.
Graph (trivial) has 510 edges and 568 vertex of which 7 / 568 are part of one of the 1 SCC in 7 ms
Free SCC test removed 6 places
Structural test allowed to assert that 269 places are NOT stable. Took 25 ms.
Ensure Unique test removed 7 transitions
Reduce redundant transitions removed 7 transitions.
[2026-05-25 09:23:40] [INFO ] Flatten gal took : 156 ms
[2026-05-25 09:23:40] [INFO ] Flatten gal took : 89 ms
RANDOM walk for 40000 steps (165 resets) in 2320 ms. (17 steps per ms) remains 134/299 properties
[2026-05-25 09:23:40] [INFO ] Time to serialize gal into /tmp/ReachabilityCardinality1642248673700400998.gal : 29 ms
BEST_FIRST walk for 403 steps (8 resets) in 18 ms. (21 steps per ms) remains 134/134 properties
BEST_FIRST walk for 404 steps (8 resets) in 8 ms. (44 steps per ms) remains 134/134 properties
BEST_FIRST walk for 402 steps (8 resets) in 8 ms. (44 steps per ms) remains 134/134 properties
[2026-05-25 09:23:40] [INFO ] Time to serialize properties into /tmp/ReachabilityCardinality4540675843593253947.prop : 2 ms
Invoking ITS tools like this :cd /home/mcc/execution;'/home/mcc/BenchKit/itstools/itstools/plugins/fr.lip6.move.gal.itstools.binaries_1.0.0.202604301425/bin/its-reach-linux64' '--gc-threshold' '2000000' '--quiet' '-i' '/tmp/ReachabilityCardinality1642248673700400998.gal' '-t' 'CGAL' '-reachable-file' '/tmp/ReachabilityCardinality4540675843593253947.prop' '--nowitness' '--gen-order' 'FOLLOW'
BEST_FIRST walk for 403 steps (8 resets) in 22 ms. (17 steps per ms) remains 134/134 properties
BEST_FIRST walk for 404 steps (8 resets) in 16 ms. (23 steps per ms) remains 134/134 properties
BEST_FIRST walk for 402 steps (8 resets) in 13 ms. (28 steps per ms) remains 134/134 properties
BEST_FIRST walk for 404 steps (8 resets) in 20 ms. (19 steps per ms) remains 134/134 properties
its-reach command run as :
/home/mcc/BenchKit/itstools/itstools/plugins/fr.lip6.move.gal.itstools.binaries_1.0.0.202604301425/bin/its-reach-linux64 --gc-threshold 2000000 --quiet ...328
BEST_FIRST walk for 401 steps (8 resets) in 21 ms. (18 steps per ms) remains 134/134 properties
BEST_FIRST walk for 404 steps (8 resets) in 11 ms. (33 steps per ms) remains 134/134 properties
BEST_FIRST walk for 403 steps (8 resets) in 8 ms. (44 steps per ms) remains 134/134 properties
BEST_FIRST walk for 404 steps (8 resets) in 14 ms. (26 steps per ms) remains 134/134 properties
BEST_FIRST walk for 404 steps (8 resets) in 9 ms. (40 steps per ms) remains 134/134 properties
BEST_FIRST walk for 403 steps (8 resets) in 8 ms. (44 steps per ms) remains 134/134 properties
BEST_FIRST walk for 402 steps (8 resets) in 18 ms. (21 steps per ms) remains 134/134 properties
Loading property file /tmp/ReachabilityCardinality4540675843593253947.prop.
BEST_FIRST walk for 403 steps (8 resets) in 10 ms. (36 steps per ms) remains 134/134 properties
BEST_FIRST walk for 403 steps (8 resets) in 10 ms. (36 steps per ms) remains 134/134 properties
BEST_FIRST walk for 402 steps (8 resets) in 9 ms. (40 steps per ms) remains 134/134 properties
BEST_FIRST walk for 403 steps (8 resets) in 9 ms. (40 steps per ms) remains 134/134 properties
BEST_FIRST walk for 404 steps (8 resets) in 6 ms. (57 steps per ms) remains 134/134 properties
BEST_FIRST walk for 403 steps (8 resets) in 11 ms. (33 steps per ms) remains 134/134 properties
BEST_FIRST walk for 403 steps (8 resets) in 7 ms. (50 steps per ms) remains 134/134 properties
BEST_FIRST walk for 404 steps (8 resets) in 6 ms. (57 steps per ms) remains 134/134 properties
BEST_FIRST walk for 404 steps (8 resets) in 7 ms. (50 steps per ms) remains 134/134 properties
BEST_FIRST walk for 403 steps (8 resets) in 8 ms. (44 steps per ms) remains 134/134 properties
BEST_FIRST walk for 404 steps (8 resets) in 6 ms. (57 steps per ms) remains 134/134 properties
BEST_FIRST walk for 404 steps (8 resets) in 8 ms. (44 steps per ms) remains 134/134 properties
BEST_FIRST walk for 403 steps (8 resets) in 5 ms. (67 steps per ms) remains 134/134 properties
BEST_FIRST walk for 402 steps (8 resets) in 4 ms. (80 steps per ms) remains 134/134 properties
BEST_FIRST walk for 404 steps (8 resets) in 7 ms. (50 steps per ms) remains 134/134 properties
BEST_FIRST walk for 403 steps (8 resets) in 6 ms. (57 steps per ms) remains 134/134 properties
BEST_FIRST walk for 402 steps (8 resets) in 6 ms. (57 steps per ms) remains 134/134 properties
BEST_FIRST walk for 403 steps (8 resets) in 6 ms. (57 steps per ms) remains 134/134 properties
BEST_FIRST walk for 404 steps (8 resets) in 6 ms. (57 steps per ms) remains 134/134 properties
BEST_FIRST walk for 404 steps (8 resets) in 5 ms. (67 steps per ms) remains 134/134 properties
BEST_FIRST walk for 402 steps (8 resets) in 6 ms. (57 steps per ms) remains 134/134 properties
BEST_FIRST walk for 402 steps (8 resets) in 5 ms. (67 steps per ms) remains 134/134 properties
BEST_FIRST walk for 404 steps (8 resets) in 6 ms. (57 steps per ms) remains 134/134 properties
BEST_FIRST walk for 404 steps (8 resets) in 5 ms. (67 steps per ms) remains 134/134 properties
BEST_FIRST walk for 404 steps (8 resets) in 6 ms. (57 steps per ms) remains 134/134 properties
BEST_FIRST walk for 403 steps (8 resets) in 7 ms. (50 steps per ms) remains 134/134 properties
BEST_FIRST walk for 404 steps (8 resets) in 5 ms. (67 steps per ms) remains 134/134 properties
BEST_FIRST walk for 402 steps (8 resets) in 8 ms. (44 steps per ms) remains 134/134 properties
BEST_FIRST walk for 404 steps (8 resets) in 6 ms. (57 steps per ms) remains 134/134 properties
BEST_FIRST walk for 403 steps (8 resets) in 5 ms. (67 steps per ms) remains 134/134 properties
BEST_FIRST walk for 402 steps (8 resets) in 7 ms. (50 steps per ms) remains 134/134 properties
BEST_FIRST walk for 403 steps (8 resets) in 6 ms. (57 steps per ms) remains 134/134 properties
BEST_FIRST walk for 404 steps (8 resets) in 8 ms. (44 steps per ms) remains 134/134 properties
BEST_FIRST walk for 403 steps (8 resets) in 7 ms. (50 steps per ms) remains 134/134 properties
BEST_FIRST walk for 404 steps (8 resets) in 8 ms. (44 steps per ms) remains 134/134 properties
BEST_FIRST walk for 404 steps (8 resets) in 6 ms. (57 steps per ms) remains 134/134 properties
Running PetriSpot : '/home/mcc/BenchKit/itstools/itstools/plugins/fr.lip6.petrispot.binaries_1.0.0.202604301425/bin/petri64' '--loadKERS=/tmp/petrispot-input-687463254350965113.kers' '--Pflows' '--basisKERS=/tmp/petrispot-output-5365700239136533879.kers'
[2026-05-25 09:23:40] [INFO ] Running PetriSpot with arguments : [--loadKERS=/tmp/petrispot-input-687463254350965113.kers, --Pflows, --basisKERS=/tmp/petrispot-output-5365700239136533879.kers]
Normalized transition count is 589 out of 590 initially.
Culling duplicate invariants (modulo rational): removing 1 columns.
Culled 1 columns in 0 ms.
// Phase 1: matrix 589 rows 561 cols 1459 entries
Finished phase 1 with 531 SingleSign rule and 1 generalized
[2026-05-25 09:23:40] [INFO ] Computed 30 invariants in 2 ms
Computed 30 P flows in 2 ms.
Exported basis to /tmp/petrispot-output-5365700239136533879.kers
Total runtime 3 ms.
[2026-05-25 09:23:40] [INFO ] State equation strengthened by 1 read => feed constraints.
SDD proceeding with computation,134 properties remain. new max is 4
SDD size :1 after 5
SDD proceeding with computation,134 properties remain. new max is 8
SDD size :5 after 10
SDD proceeding with computation,134 properties remain. new max is 16
SDD size :10 after 19
SDD proceeding with computation,134 properties remain. new max is 32
SDD size :19 after 36
SDD proceeding with computation,134 properties remain. new max is 64
SDD size :36 after 93
SDD proceeding with computation,134 properties remain. new max is 128
SDD size :93 after 33378
SDD proceeding with computation,134 properties remain. new max is 256
SDD size :33378 after 8.74333e+09
SDD proceeding with computation,134 properties remain. new max is 512
SDD size :8.74333e+09 after 7.51046e+19
All remaining problems are real, not stopping.
At refinement iteration 0 (INCLUDED_ONLY) 0/134 variables, 134/134 constraints. Problems are: Problem set: 0 solved, 134 unsolved
At refinement iteration 1 (INCLUDED_ONLY) 0/134 variables, 0/134 constraints. Problems are: Problem set: 0 solved, 134 unsolved
At refinement iteration 2 (OVERLAPS) 426/560 variables, 29/163 constraints. Problems are: Problem set: 0 solved, 134 unsolved
At refinement iteration 3 (INCLUDED_ONLY) 0/560 variables, 426/589 constraints. Problems are: Problem set: 0 solved, 134 unsolved
At refinement iteration 4 (INCLUDED_ONLY) 0/560 variables, 0/589 constraints. Problems are: Problem set: 0 solved, 134 unsolved
At refinement iteration 5 (OVERLAPS) 1/561 variables, 1/590 constraints. Problems are: Problem set: 0 solved, 134 unsolved
At refinement iteration 6 (INCLUDED_ONLY) 0/561 variables, 1/591 constraints. Problems are: Problem set: 0 solved, 134 unsolved
Error getting values : (error "Timeout of Z3 solver reached")
Solver is answering 'unknown', stopping.
After SMT solving in domain Real declared 561/1152 variables, and 591 constraints, problems are : Problem set: 0 solved, 134 unsolved in 5045 ms.
Refiners :[Domain max(s): 561/562 constraints, Generalized P Invariants (flows): 30/30 constraints, State Equation: 0/562 constraints, ReadFeed: 0/1 constraints, PredecessorRefiner: 134/134 constraints, Known Traps: 0/0 constraints, Known Traps Along Path: 0/0 constraints]
Escalating to Integer solving :Problem set: 0 solved, 134 unsolved
At refinement iteration 0 (INCLUDED_ONLY) 0/134 variables, 134/134 constraints. Problems are: Problem set: 0 solved, 134 unsolved
At refinement iteration 1 (INCLUDED_ONLY) 0/134 variables, 0/134 constraints. Problems are: Problem set: 0 solved, 134 unsolved
At refinement iteration 2 (OVERLAPS) 426/560 variables, 29/163 constraints. Problems are: Problem set: 0 solved, 134 unsolved
At refinement iteration 3 (INCLUDED_ONLY) 0/560 variables, 426/589 constraints. Problems are: Problem set: 0 solved, 134 unsolved
At refinement iteration 4 (INCLUDED_ONLY) 0/560 variables, 0/589 constraints. Problems are: Problem set: 0 solved, 134 unsolved
At refinement iteration 5 (OVERLAPS) 1/561 variables, 1/590 constraints. Problems are: Problem set: 0 solved, 134 unsolved
At refinement iteration 6 (INCLUDED_ONLY) 0/561 variables, 1/591 constraints. Problems are: Problem set: 0 solved, 134 unsolved
Solver is answering 'unknown', stopping.
After SMT solving in domain Int declared 561/1152 variables, and 591 constraints, problems are : Problem set: 0 solved, 134 unsolved in 5013 ms.
Refiners :[Domain max(s): 561/562 constraints, Generalized P Invariants (flows): 30/30 constraints, State Equation: 0/562 constraints, ReadFeed: 0/1 constraints, PredecessorRefiner: 0/134 constraints, Known Traps: 0/0 constraints, Known Traps Along Path: 0/0 constraints]
After SMT, in 10155ms problems are : Problem set: 0 solved, 134 unsolved
Skipping Parikh replay, no witness traces provided.
Support contains 134 out of 562 places. Attempting structural reductions.
Starting structural reductions in REACHABILITY mode, iteration 0 : 562/562 places, 590/590 transitions.
Ensure Unique test removed 1 places
Drop transitions (Empty/Sink Transition effects.) removed 1 transitions
Reduce isomorphic transitions removed 1 transitions.
Drop transitions (Trivial Post-Agglo cleanup.) removed 243 transitions
Trivial Post-agglo rules discarded 243 transitions
Performed 243 trivial Post agglomeration. Transition count delta: 243
Iterating post reduction 0 with 245 rules applied. Total rules applied 245 place count 561 transition count 346
Reduce places removed 243 places and 0 transitions.
Ensure Unique test removed 11 transitions
Reduce isomorphic transitions removed 11 transitions.
Drop transitions (Trivial Post-Agglo cleanup.) removed 1 transitions
Trivial Post-agglo rules discarded 1 transitions
Performed 1 trivial Post agglomeration. Transition count delta: 1
Iterating post reduction 1 with 255 rules applied. Total rules applied 500 place count 318 transition count 334
Reduce places removed 1 places and 0 transitions.
Iterating post reduction 2 with 1 rules applied. Total rules applied 501 place count 317 transition count 334
Performed 40 Pre agglomeration using Quasi-Persistent + Divergent Free condition..
Pre-agglomeration after 3 with 40 Pre rules applied. Total rules applied 501 place count 317 transition count 294
Deduced a syphon composed of 40 places in 3 ms
Reduce places removed 40 places and 0 transitions.
Iterating global reduction 3 with 80 rules applied. Total rules applied 581 place count 277 transition count 294
Discarding 3 places :
Symmetric choice reduction at 3 with 3 rule applications. Total rules 584 place count 274 transition count 291
Iterating global reduction 3 with 3 rules applied. Total rules applied 587 place count 274 transition count 291
Performed 1 Pre agglomeration using Quasi-Persistent + Divergent Free condition..
Pre-agglomeration after 3 with 1 Pre rules applied. Total rules applied 587 place count 274 transition count 290
Deduced a syphon composed of 1 places in 1 ms
Reduce places removed 1 places and 0 transitions.
Iterating global reduction 3 with 2 rules applied. Total rules applied 589 place count 273 transition count 290
Performed 64 Post agglomeration using F-continuation condition.Transition count delta: 64
Deduced a syphon composed of 64 places in 0 ms
Reduce places removed 64 places and 0 transitions.
Iterating global reduction 3 with 128 rules applied. Total rules applied 717 place count 209 transition count 226
Drop transitions (Empty/Sink Transition effects.) removed 7 transitions
Reduce isomorphic transitions removed 7 transitions.
Iterating post reduction 3 with 7 rules applied. Total rules applied 724 place count 209 transition count 219
Performed 1 Post agglomeration using F-continuation condition.Transition count delta: 0
Deduced a syphon composed of 1 places in 0 ms
Reduce places removed 1 places and 0 transitions.
Iterating global reduction 4 with 2 rules applied. Total rules applied 726 place count 208 transition count 219
Free-agglomeration rule applied 8 times.
Iterating global reduction 4 with 8 rules applied. Total rules applied 734 place count 208 transition count 211
Reduce places removed 8 places and 0 transitions.
Iterating post reduction 4 with 8 rules applied. Total rules applied 742 place count 200 transition count 211
Partial Free-agglomeration rule applied 8 times.
Drop transitions (Partial Free agglomeration) removed 8 transitions
Iterating global reduction 5 with 8 rules applied. Total rules applied 750 place count 200 transition count 211
Drop transitions (Empty/Sink Transition effects.) removed 3 transitions
Reduce isomorphic transitions removed 3 transitions.
Iterating post reduction 5 with 3 rules applied. Total rules applied 753 place count 200 transition count 208
Partial Post-agglomeration rule applied 5 times.
Drop transitions (Partial Post agglomeration) removed 5 transitions
Iterating global reduction 6 with 5 rules applied. Total rules applied 758 place count 200 transition count 208
Reduce places removed 1 places and 1 transitions.
Iterating global reduction 6 with 1 rules applied. Total rules applied 759 place count 199 transition count 207
Applied a total of 759 rules in 171 ms. Remains 199 /562 variables (removed 363) and now considering 207/590 (removed 383) transitions.
Finished structural reductions in REACHABILITY mode , in 1 iterations and 180 ms. Remains : 199/562 places, 207/590 transitions.
RANDOM walk for 6491 steps (21 resets) in 121 ms. (53 steps per ms) remains 0/134 properties
ITS runner timed out or was interrupted.
ITS tools runner thread asked to quit. Dying gracefully.
Able to resolve query StableMarking after proving 301 properties.
FORMULA StableMarking FALSE TECHNIQUES RANDOM_WALK MARKED_SUFFIX_TEST TRIVIAL_UNMARKED_SCC_TEST TOPOLOGICAL
Total runtime 11626 ms.
BK_STOP 1779701030962
--------------------
content from stderr:
+ export BINDIR=/home/mcc/BenchKit/bin//../itstools/bin//../
+ BINDIR=/home/mcc/BenchKit/bin//../itstools/bin//../
++ pwd
+ export MODEL=/home/mcc/execution
+ MODEL=/home/mcc/execution
+ [[ StableMarking = StateSpace ]]
+ /home/mcc/BenchKit/bin//../itstools/bin//..//runeclipse.sh /home/mcc/execution StableMarking -its -ltsmin -greatspnpath /home/mcc/BenchKit/bin//../itstools/bin//..//greatspn/ -order META -manyOrder -smt -timeout 1800
+ ulimit -s 65536
+ [[ -z '' ]]
+ export LTSMIN_MEM_SIZE=8589934592
+ LTSMIN_MEM_SIZE=8589934592
++ sed s/.jar//
++ ls /home/mcc/BenchKit/bin//../itstools/bin//..//itstools/plugins/fr.lip6.move.gal.application.pnmcc_1.0.0.202604301425.jar
++ perl -pe 's/.*\.//g'
+ VERSION=202604301425
+ echo 'Running Version 202604301425'
+ /home/mcc/BenchKit/bin//../itstools/bin//..//itstools/its-tools -pnfolder /home/mcc/execution -examination StableMarking -its -ltsmin -greatspnpath /home/mcc/BenchKit/bin//../itstools/bin//..//greatspn/ -order META -manyOrder -smt -timeout 1800
Sequence of Actions to be Executed by the VM
This is useful if one wants to reexecute the tool in the VM from the submitted image disk.
set -x
# this is for BenchKit: configuration of major elements for the test
export BK_INPUT="GPUForwardProgress-PT-28b"
export BK_EXAMINATION="StableMarking"
export BK_TOOL="itstools"
export BK_RESULT_DIR="/tmp/BK_RESULTS/OUTPUTS"
export BK_TIME_CONFINEMENT="1800"
export BK_MEMORY_CONFINEMENT="16384"
export BK_BIN_PATH="/home/mcc/BenchKit/bin/"
# this is specific to your benchmark or test
export BIN_DIR="$HOME/BenchKit/bin"
# remove the execution directoty if it exists (to avoid increse of .vmdk images)
if [ -d execution ] ; then
rm -rf execution
fi
# this is for BenchKit: explicit launching of the test
echo "====================================================================="
echo " Generated by BenchKit 2-5973"
echo " Executing tool itstools"
echo " Input is GPUForwardProgress-PT-28b, examination is StableMarking"
echo " Time confinement is $BK_TIME_CONFINEMENT seconds"
echo " Memory confinement is 16384 MBytes"
echo " Number of cores is 4"
echo " Run identifier is r152-tall-177961077500303"
echo "====================================================================="
echo
echo "--------------------"
echo "preparation of the directory to be used:"
tar xzf /home/mcc/BenchKit/INPUTS/GPUForwardProgress-PT-28b.tgz
mv GPUForwardProgress-PT-28b execution
cd execution
if [ "StableMarking" = "ReachabilityDeadlock" ] || [ "StableMarking" = "UpperBounds" ] || [ "StableMarking" = "QuasiLiveness" ] || [ "StableMarking" = "StableMarking" ] || [ "StableMarking" = "Liveness" ] || [ "StableMarking" = "OneSafe" ] || [ "StableMarking" = "StateSpace" ]; then
rm -f GenericPropertiesVerdict.xml
fi
pwd
ls -lh
echo
echo "--------------------"
echo "content from stdout:"
echo
echo "=== Data for post analysis generated by BenchKit (invocation template)"
echo
if [ "StableMarking" = "UpperBounds" ] ; then
echo "The expected result is a vector of positive values"
echo NUM_VECTOR
elif [ "StableMarking" != "StateSpace" ] ; then
echo "The expected result is a vector of booleans"
echo BOOL_VECTOR
else
echo "no data necessary for post analysis"
fi
echo
if [ -f "StableMarking.xml" ] ; then # for cunf (txt files deleted;-)
echo echo "here is the order used to build the result vector(from xml file)"
for x in $(grep '
echo "FORMULA_NAME $x"
done
elif [ "StableMarking" = "ReachabilityDeadlock" ] || [ "StableMarking" = "QuasiLiveness" ] || [ "StableMarking" = "StableMarking" ] || [ "StableMarking" = "Liveness" ] || [ "StableMarking" = "OneSafe" ] ; then
echo "FORMULA_NAME StableMarking"
fi
echo
echo "=== Now, execution of the tool begins"
echo
echo -n "BK_START "
date -u +%s%3N
echo
timeout -s 9 $BK_TIME_CONFINEMENT bash -c "/home/mcc/BenchKit/BenchKit_head.sh 2> STDERR ; echo ; echo -n \"BK_STOP \" ; date -u +%s%3N"
if [ $? -eq 137 ] ; then
echo
echo "BK_TIME_CONFINEMENT_REACHED"
fi
echo
echo "--------------------"
echo "content from stderr:"
echo
cat STDERR ;