

About the Execution of 2025-gold for CloudDeployment-PT-3a
| Execution Summary | |||||
| Max Memory Used (MB) |
Time wait (ms) | CPU Usage (ms) | I/O Wait (ms) | Computed Result | Execution Status |
| 346.020 | 65476.00 | 86540.00 | 408.70 | T | normal |
Execution Chart
We display below the execution chart for this examination (boot time has been removed).
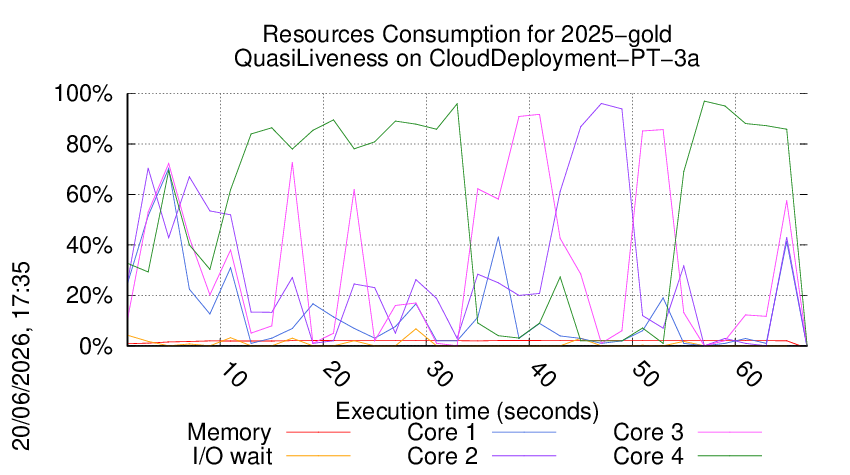
Trace from the execution
Formatting '/data/fkordon/mcc2026-input.r064-smll-177946904400282.qcow2', fmt=qcow2 size=4294967296 backing_file=/data/fkordon/mcc2026-input.qcow2 backing_fmt=qcow2 cluster_size=65536 lazy_refcounts=off refcount_bits=16
Waiting for the VM to be ready (probing ssh)
......................................................................................................................................................................................................................................................................................................................................................................
=====================================================================
Generated by BenchKit 2-5973
Executing tool gold2025
Input is CloudDeployment-PT-3a, examination is QuasiLiveness
Time confinement is 1800 seconds
Memory confinement is 16384 MBytes
Number of cores is 4
Run identifier is r064-smll-177946904400282
=====================================================================
--------------------
preparation of the directory to be used:
/home/mcc/execution
total 516K
-rw-r--r-- 1 mcc users 5.1K Mar 6 10:59 CTLCardinality.txt
-rw-r--r-- 1 mcc users 50K Mar 6 10:59 CTLCardinality.xml
-rw-r--r-- 1 mcc users 5.9K Mar 6 10:58 CTLFireability.txt
-rw-r--r-- 1 mcc users 57K Mar 6 10:58 CTLFireability.xml
-rw-r--r-- 1 mcc users 4.2K Mar 3 18:30 GenericPropertiesDefinition.xml
-rw-r--r-- 1 mcc users 3.7K Mar 15 08:14 LTLCardinality.txt
-rw-r--r-- 1 mcc users 26K Mar 15 08:14 LTLCardinality.xml
-rw-r--r-- 1 mcc users 2.3K Mar 15 08:14 LTLFireability.txt
-rw-r--r-- 1 mcc users 19K Mar 15 08:14 LTLFireability.xml
-rw-r--r-- 1 mcc users 11K Mar 6 11:00 ReachabilityCardinality.txt
-rw-r--r-- 1 mcc users 110K Mar 6 11:00 ReachabilityCardinality.xml
-rw-r--r-- 1 mcc users 8.1K Mar 6 11:00 ReachabilityFireability.txt
-rw-r--r-- 1 mcc users 68K Mar 6 11:00 ReachabilityFireability.xml
-rw-r--r-- 1 mcc users 1.7K Mar 15 08:14 UpperBounds.txt
-rw-r--r-- 1 mcc users 3.7K Mar 15 08:14 UpperBounds.xml
-rw-r--r-- 1 mcc users 6 Mar 3 18:30 equiv_col
-rw-r--r-- 1 mcc users 3 Mar 3 18:30 instance
-rw-r--r-- 1 mcc users 6 Mar 3 18:30 iscolored
-rw-r--r-- 1 mcc users 97K Mar 3 18:30 model.pnml
--------------------
content from stdout:
=== Data for post analysis generated by BenchKit (invocation template)
The expected result is a vector of booleans
BOOL_VECTOR
FORMULA_NAME QuasiLiveness
=== Now, execution of the tool begins
BK_START 1779484984111
Invoking MCC driver with
GOLD_TOOL=
BK_EXAMINATION=QuasiLiveness
BK_BIN_PATH=/home/mcc/BenchKit/bin/
BK_TIME_CONFINEMENT=1800
BK_INPUT=CloudDeployment-PT-3a
BK_MEMORY_CONFINEMENT=16384
Not applying reductions.
Model is PT
QuasiLiveness PT
Running Version 202505121319
[2026-05-22 21:23:06] [INFO ] Running its-tools with arguments : [-pnfolder, /home/mcc/execution, -examination, QuasiLiveness, -its, -ltsmin, -greatspnpath, /home/mcc/BenchKit/bin//../itstools/bin//..//greatspn/, -order, META, -manyOrder, -smt, -timeout, 1800]
[2026-05-22 21:23:06] [INFO ] Parsing pnml file : /home/mcc/execution/model.pnml
[2026-05-22 21:23:06] [INFO ] Load time of PNML (sax parser for PT used): 168 ms
[2026-05-22 21:23:06] [INFO ] Transformed 104 places.
[2026-05-22 21:23:06] [INFO ] Transformed 308 transitions.
[2026-05-22 21:23:06] [INFO ] Found NUPN structural information;
[2026-05-22 21:23:06] [INFO ] Parsed PT model containing 104 places and 308 transitions and 1611 arcs in 392 ms.
Starting structural reductions in LIVENESS mode, iteration 0 : 104/104 places, 308/308 transitions.
Graph (trivial) has 133 edges and 104 vertex of which 30 / 104 are part of one of the 9 SCC in 6 ms
Free SCC test removed 21 places
Ensure Unique test removed 81 transitions
Reduce isomorphic transitions removed 81 transitions.
Ensure Unique test removed 6 places
Iterating post reduction 0 with 6 rules applied. Total rules applied 7 place count 77 transition count 227
Performed 9 Post agglomeration using F-continuation condition.Transition count delta: -15
Deduced a syphon composed of 9 places in 3 ms
Reduce places removed 9 places and 0 transitions.
Iterating global reduction 1 with 18 rules applied. Total rules applied 25 place count 68 transition count 242
Applied a total of 25 rules in 98 ms. Remains 68 /104 variables (removed 36) and now considering 242/308 (removed 66) transitions.
[2026-05-22 21:23:07] [INFO ] Flow matrix only has 120 transitions (discarded 122 similar events)
// Phase 1: matrix 120 rows 68 cols
[2026-05-22 21:23:07] [INFO ] Computed 12 invariants in 14 ms
Starting Z3 with timeout 160.0 s and query timeout 16000.0 ms
[2026-05-22 21:23:07] [INFO ] Implicit Places using invariants in 500 ms returned []
[2026-05-22 21:23:07] [INFO ] Flow matrix only has 120 transitions (discarded 122 similar events)
[2026-05-22 21:23:07] [INFO ] Invariant cache hit.
Starting Z3 with timeout 160.0 s and query timeout 16000.0 ms
[2026-05-22 21:23:07] [INFO ] State equation strengthened by 62 read => feed constraints.
[2026-05-22 21:23:08] [INFO ] Implicit Places using invariants and state equation in 414 ms returned []
Implicit Place search using SMT with State Equation took 999 ms to find 0 implicit places.
Running 241 sub problems to find dead transitions.
[2026-05-22 21:23:08] [INFO ] Flow matrix only has 120 transitions (discarded 122 similar events)
[2026-05-22 21:23:08] [INFO ] Invariant cache hit.
[2026-05-22 21:23:08] [INFO ] State equation strengthened by 62 read => feed constraints.
Starting Z3 with timeout 30.0 s and query timeout 3000.0 ms
At refinement iteration 0 (INCLUDED_ONLY) 0/67 variables, 67/67 constraints. Problems are: Problem set: 0 solved, 241 unsolved
At refinement iteration 1 (INCLUDED_ONLY) 0/67 variables, 12/79 constraints. Problems are: Problem set: 0 solved, 241 unsolved
At refinement iteration 2 (INCLUDED_ONLY) 0/67 variables, 0/79 constraints. Problems are: Problem set: 0 solved, 241 unsolved
At refinement iteration 3 (OVERLAPS) 119/186 variables, 67/146 constraints. Problems are: Problem set: 0 solved, 241 unsolved
At refinement iteration 4 (INCLUDED_ONLY) 0/186 variables, 61/207 constraints. Problems are: Problem set: 0 solved, 241 unsolved
At refinement iteration 5 (INCLUDED_ONLY) 0/186 variables, 0/207 constraints. Problems are: Problem set: 0 solved, 241 unsolved
At refinement iteration 6 (OVERLAPS) 1/187 variables, 1/208 constraints. Problems are: Problem set: 0 solved, 241 unsolved
At refinement iteration 7 (INCLUDED_ONLY) 0/187 variables, 1/209 constraints. Problems are: Problem set: 0 solved, 241 unsolved
At refinement iteration 8 (INCLUDED_ONLY) 0/187 variables, 0/209 constraints. Problems are: Problem set: 0 solved, 241 unsolved
At refinement iteration 9 (OVERLAPS) 1/188 variables, 1/210 constraints. Problems are: Problem set: 0 solved, 241 unsolved
At refinement iteration 10 (INCLUDED_ONLY) 0/188 variables, 0/210 constraints. Problems are: Problem set: 0 solved, 241 unsolved
At refinement iteration 11 (OVERLAPS) 0/188 variables, 0/210 constraints. Problems are: Problem set: 0 solved, 241 unsolved
No progress, stopping.
After SMT solving in domain Real declared 188/188 variables, and 210 constraints, problems are : Problem set: 0 solved, 241 unsolved in 29667 ms.
Refiners :[Domain max(s): 68/68 constraints, Generalized P Invariants (flows): 12/12 constraints, State Equation: 68/68 constraints, ReadFeed: 62/62 constraints, PredecessorRefiner: 241/241 constraints, Known Traps: 0/0 constraints, Known Traps Along Path: 0/0 constraints]
Escalating to Integer solving :Problem set: 0 solved, 241 unsolved
Starting Z3 with timeout 30.0 s and query timeout 3000.0 ms
At refinement iteration 0 (INCLUDED_ONLY) 0/67 variables, 67/67 constraints. Problems are: Problem set: 0 solved, 241 unsolved
At refinement iteration 1 (INCLUDED_ONLY) 0/67 variables, 12/79 constraints. Problems are: Problem set: 0 solved, 241 unsolved
At refinement iteration 2 (INCLUDED_ONLY) 0/67 variables, 0/79 constraints. Problems are: Problem set: 0 solved, 241 unsolved
At refinement iteration 3 (OVERLAPS) 119/186 variables, 67/146 constraints. Problems are: Problem set: 0 solved, 241 unsolved
At refinement iteration 4 (INCLUDED_ONLY) 0/186 variables, 61/207 constraints. Problems are: Problem set: 0 solved, 241 unsolved
At refinement iteration 5 (INCLUDED_ONLY) 0/186 variables, 241/448 constraints. Problems are: Problem set: 0 solved, 241 unsolved
At refinement iteration 6 (INCLUDED_ONLY) 0/186 variables, 0/448 constraints. Problems are: Problem set: 0 solved, 241 unsolved
At refinement iteration 7 (OVERLAPS) 1/187 variables, 1/449 constraints. Problems are: Problem set: 0 solved, 241 unsolved
At refinement iteration 8 (INCLUDED_ONLY) 0/187 variables, 1/450 constraints. Problems are: Problem set: 0 solved, 241 unsolved
At refinement iteration 9 (INCLUDED_ONLY) 0/187 variables, 0/450 constraints. Problems are: Problem set: 0 solved, 241 unsolved
At refinement iteration 10 (OVERLAPS) 1/188 variables, 1/451 constraints. Problems are: Problem set: 0 solved, 241 unsolved
Solver is answering 'unknown', stopping.
After SMT solving in domain Int declared 188/188 variables, and 451 constraints, problems are : Problem set: 0 solved, 241 unsolved in 30042 ms.
Refiners :[Domain max(s): 68/68 constraints, Generalized P Invariants (flows): 12/12 constraints, State Equation: 68/68 constraints, ReadFeed: 62/62 constraints, PredecessorRefiner: 241/241 constraints, Known Traps: 0/0 constraints, Known Traps Along Path: 0/0 constraints]
After SMT, in 60095ms problems are : Problem set: 0 solved, 241 unsolved
Search for dead transitions found 0 dead transitions in 60127ms
Starting structural reductions in LIVENESS mode, iteration 1 : 68/104 places, 242/308 transitions.
Finished structural reductions in LIVENESS mode , in 1 iterations and 61285 ms. Remains : 68/104 places, 242/308 transitions.
Discarding 178 transitions out of 242. Remains 64
Initial state reduction rules removed 1 formulas.
[2026-05-22 21:24:09] [INFO ] Flatten gal took : 134 ms
[2026-05-22 21:24:09] [INFO ] Flatten gal took : 54 ms
[2026-05-22 21:24:09] [INFO ] Time to serialize gal into /tmp/ReachabilityCardinality498330533554868077.gal : 42 ms
[2026-05-22 21:24:09] [INFO ] Time to serialize properties into /tmp/ReachabilityCardinality17741602103344169562.prop : 5 ms
Invoking ITS tools like this :cd /home/mcc/execution;'/home/mcc/BenchKit/itstools/itstools/plugins/fr.lip6.move.gal.itstools.binaries_1.0.0.202505121319/bin/its-reach-linux64' '--gc-threshold' '2000000' '--quiet' '-i' '/tmp/ReachabilityCardinality498330533554868077.gal' '-t' 'CGAL' '-reachable-file' '/tmp/ReachabilityCardinality17741602103344169562.prop' '--nowitness' '--gen-order' 'FOLLOW'
its-reach command run as :
/home/mcc/BenchKit/itstools/itstools/plugins/fr.lip6.move.gal.itstools.binaries_1.0.0.202505121319/bin/its-reach-linux64 --gc-threshold 2000000 --quiet ...328
RANDOM walk for 40000 steps (1504 resets) in 2805 ms. (14 steps per ms) remains 3/63 properties
Loading property file /tmp/ReachabilityCardinality17741602103344169562.prop.
Reachability property qltransition_240 is true.
Reachability property qltransition_238 is true.
Reachability property qltransition_236 is true.
Reachability property qltransition_220 is true.
Reachability property qltransition_218 is true.
Reachability property qltransition_216 is true.
Reachability property qltransition_200 is true.
Reachability property qltransition_198 is true.
Reachability property qltransition_196 is true.
SDD proceeding with computation,54 properties remain. new max is 2
SDD size :1 after 9
SDD proceeding with computation,54 properties remain. new max is 4
SDD size :9 after 10
SDD proceeding with computation,54 properties remain. new max is 8
SDD size :10 after 12
Reachability property qltransition_148 is true.
Reachability property qltransition_147 is true.
SDD proceeding with computation,52 properties remain. new max is 8
SDD size :12 after 16
SDD proceeding with computation,52 properties remain. new max is 16
SDD size :16 after 32
SDD proceeding with computation,52 properties remain. new max is 32
SDD size :32 after 44
Reachability property qltransition_0 is true.
SDD proceeding with computation,51 properties remain. new max is 32
SDD size :44 after 513
SDD proceeding with computation,51 properties remain. new max is 64
SDD size :513 after 631
BEST_FIRST walk for 17213 steps (89 resets) in 236 ms. (72 steps per ms) remains 0/3 properties
ITS runner timed out or was interrupted.
Reachability property qltransition_232 is true.
Reachability property qltransition_230 is true.
Reachability property qltransition_212 is true.
Reachability property qltransition_210 is true.
Reachability property qltransition_192 is true.
Reachability property qltransition_190 is true.
Reachability property qltransition_133 is true.
Reachability property qltransition_132 is true.
ITS tools runner thread asked to quit. Dying gracefully.
java.io.IOException: Stream closed
at java.base/java.io.BufferedInputStream.ensureOpen(BufferedInputStream.java:206)
at java.base/java.io.BufferedInputStream.implRead(BufferedInputStream.java:411)
at java.base/java.io.BufferedInputStream.read(BufferedInputStream.java:405)
at java.base/sun.nio.cs.StreamDecoder.readBytes(StreamDecoder.java:350)
at java.base/sun.nio.cs.StreamDecoder.implRead(StreamDecoder.java:393)
at java.base/sun.nio.cs.StreamDecoder.lockedRead(StreamDecoder.java:217)
at java.base/sun.nio.cs.StreamDecoder.read(StreamDecoder.java:171)
at java.base/java.io.InputStreamReader.read(InputStreamReader.java:188)
at java.base/java.io.BufferedReader.fill(BufferedReader.java:160)
at java.base/java.io.BufferedReader.implReadLine(BufferedReader.java:370)
at java.base/java.io.BufferedReader.readLine(BufferedReader.java:347)
at java.base/java.io.BufferedReader.readLine(BufferedReader.java:436)
at fr.lip6.move.gal.application.runner.its.ITSRunner$ITSInterpreter.run(ITSRunner.java:211)
at java.base/java.lang.Thread.run(Thread.java:1583)
Able to resolve query QuasiLiveness after proving 64 properties.
FORMULA QuasiLiveness TRUE TECHNIQUES RANDOM_WALK BESTFIRST_WALK TOPOLOGICAL INITIAL_STATE
Total runtime 63041 ms.
BK_STOP 1779485049587
--------------------
content from stderr:
+ export BINDIR=/home/mcc/BenchKit/bin//../itstools/bin//../
+ BINDIR=/home/mcc/BenchKit/bin//../itstools/bin//../
++ pwd
+ export MODEL=/home/mcc/execution
+ MODEL=/home/mcc/execution
+ [[ QuasiLiveness = StateSpace ]]
+ /home/mcc/BenchKit/bin//../itstools/bin//..//runeclipse.sh /home/mcc/execution QuasiLiveness -its -ltsmin -greatspnpath /home/mcc/BenchKit/bin//../itstools/bin//..//greatspn/ -order META -manyOrder -smt -timeout 1800
+ ulimit -s 65536
+ [[ -z '' ]]
+ export LTSMIN_MEM_SIZE=8589934592
+ LTSMIN_MEM_SIZE=8589934592
++ sed s/.jar//
++ perl -pe 's/.*\.//g'
++ ls /home/mcc/BenchKit/bin//../itstools/bin//..//itstools/plugins/fr.lip6.move.gal.application.pnmcc_1.0.0.202505121319.jar
+ VERSION=202505121319
+ echo 'Running Version 202505121319'
+ /home/mcc/BenchKit/bin//../itstools/bin//..//itstools/its-tools -pnfolder /home/mcc/execution -examination QuasiLiveness -its -ltsmin -greatspnpath /home/mcc/BenchKit/bin//../itstools/bin//..//greatspn/ -order META -manyOrder -smt -timeout 1800
Sequence of Actions to be Executed by the VM
This is useful if one wants to reexecute the tool in the VM from the submitted image disk.
set -x
# this is for BenchKit: configuration of major elements for the test
export BK_INPUT="CloudDeployment-PT-3a"
export BK_EXAMINATION="QuasiLiveness"
export BK_TOOL="gold2025"
export BK_RESULT_DIR="/tmp/BK_RESULTS/OUTPUTS"
export BK_TIME_CONFINEMENT="1800"
export BK_MEMORY_CONFINEMENT="16384"
export BK_BIN_PATH="/home/mcc/BenchKit/bin/"
# this is specific to your benchmark or test
export BIN_DIR="$HOME/BenchKit/bin"
# remove the execution directoty if it exists (to avoid increse of .vmdk images)
if [ -d execution ] ; then
rm -rf execution
fi
# this is for BenchKit: explicit launching of the test
echo "====================================================================="
echo " Generated by BenchKit 2-5973"
echo " Executing tool gold2025"
echo " Input is CloudDeployment-PT-3a, examination is QuasiLiveness"
echo " Time confinement is $BK_TIME_CONFINEMENT seconds"
echo " Memory confinement is 16384 MBytes"
echo " Number of cores is 4"
echo " Run identifier is r064-smll-177946904400282"
echo "====================================================================="
echo
echo "--------------------"
echo "preparation of the directory to be used:"
tar xzf /home/mcc/BenchKit/INPUTS/CloudDeployment-PT-3a.tgz
mv CloudDeployment-PT-3a execution
cd execution
if [ "QuasiLiveness" = "ReachabilityDeadlock" ] || [ "QuasiLiveness" = "UpperBounds" ] || [ "QuasiLiveness" = "QuasiLiveness" ] || [ "QuasiLiveness" = "StableMarking" ] || [ "QuasiLiveness" = "Liveness" ] || [ "QuasiLiveness" = "OneSafe" ] || [ "QuasiLiveness" = "StateSpace" ]; then
rm -f GenericPropertiesVerdict.xml
fi
pwd
ls -lh
echo
echo "--------------------"
echo "content from stdout:"
echo
echo "=== Data for post analysis generated by BenchKit (invocation template)"
echo
if [ "QuasiLiveness" = "UpperBounds" ] ; then
echo "The expected result is a vector of positive values"
echo NUM_VECTOR
elif [ "QuasiLiveness" != "StateSpace" ] ; then
echo "The expected result is a vector of booleans"
echo BOOL_VECTOR
else
echo "no data necessary for post analysis"
fi
echo
if [ -f "QuasiLiveness.xml" ] ; then # for cunf (txt files deleted;-)
echo echo "here is the order used to build the result vector(from xml file)"
for x in $(grep '
echo "FORMULA_NAME $x"
done
elif [ "QuasiLiveness" = "ReachabilityDeadlock" ] || [ "QuasiLiveness" = "QuasiLiveness" ] || [ "QuasiLiveness" = "StableMarking" ] || [ "QuasiLiveness" = "Liveness" ] || [ "QuasiLiveness" = "OneSafe" ] ; then
echo "FORMULA_NAME QuasiLiveness"
fi
echo
echo "=== Now, execution of the tool begins"
echo
echo -n "BK_START "
date -u +%s%3N
echo
timeout -s 9 $BK_TIME_CONFINEMENT bash -c "/home/mcc/BenchKit/BenchKit_head.sh 2> STDERR ; echo ; echo -n \"BK_STOP \" ; date -u +%s%3N"
if [ $? -eq 137 ] ; then
echo
echo "BK_TIME_CONFINEMENT_REACHED"
fi
echo
echo "--------------------"
echo "content from stderr:"
echo
cat STDERR ;