

Introduction
This page presents how TY do cope efficiently with the ReachabilityCardinality examination face to the other participating tools. In this page, we consider «All» models.
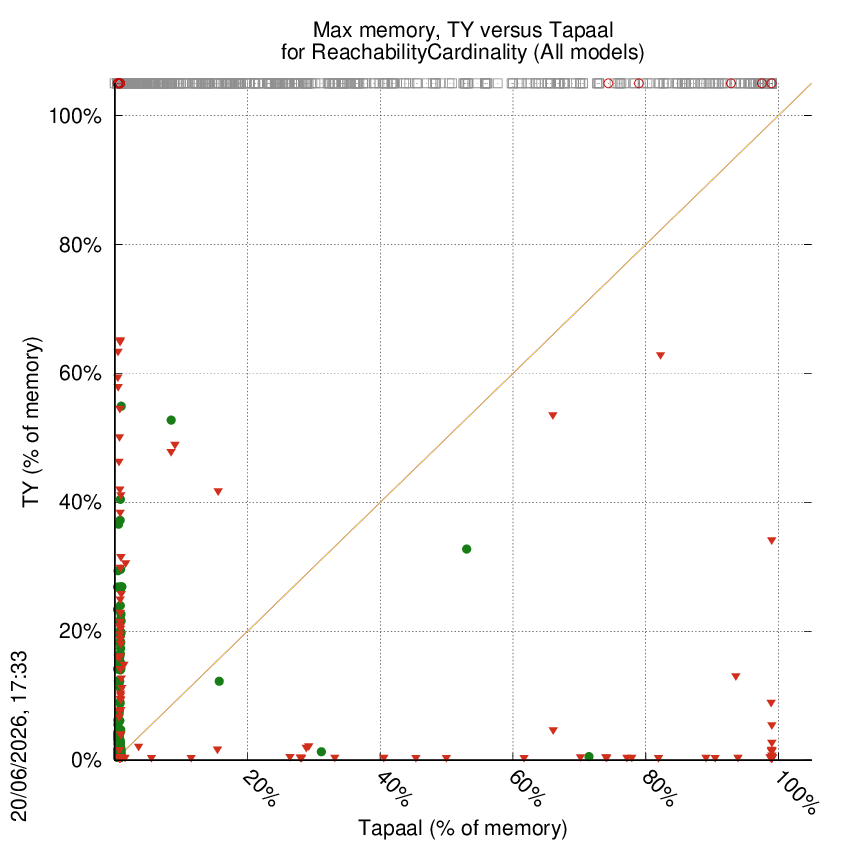
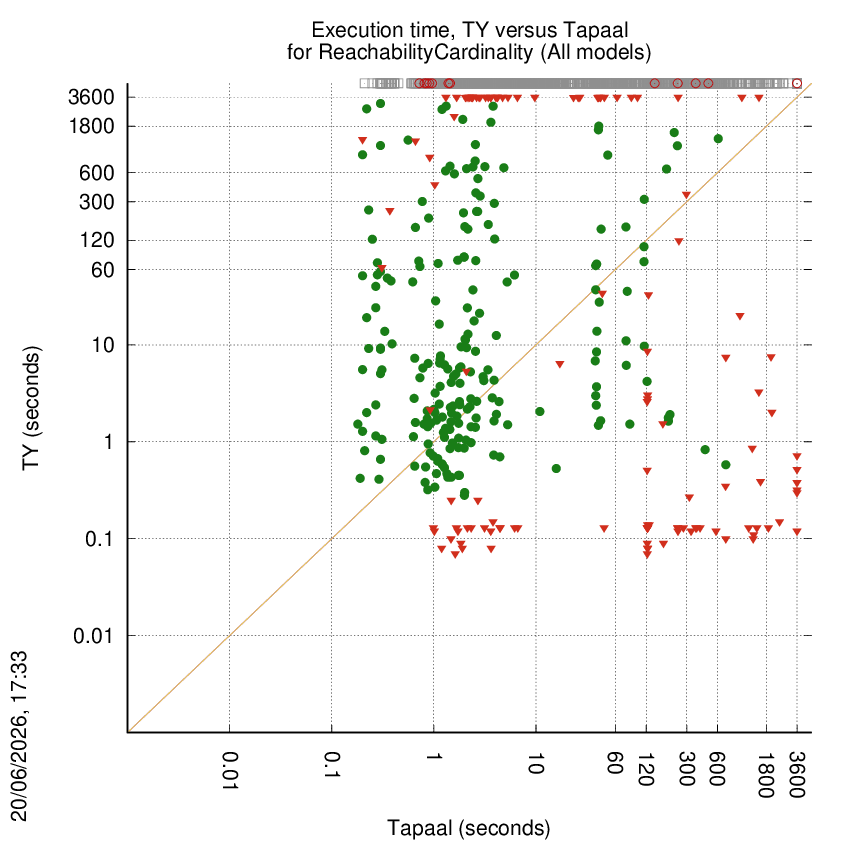
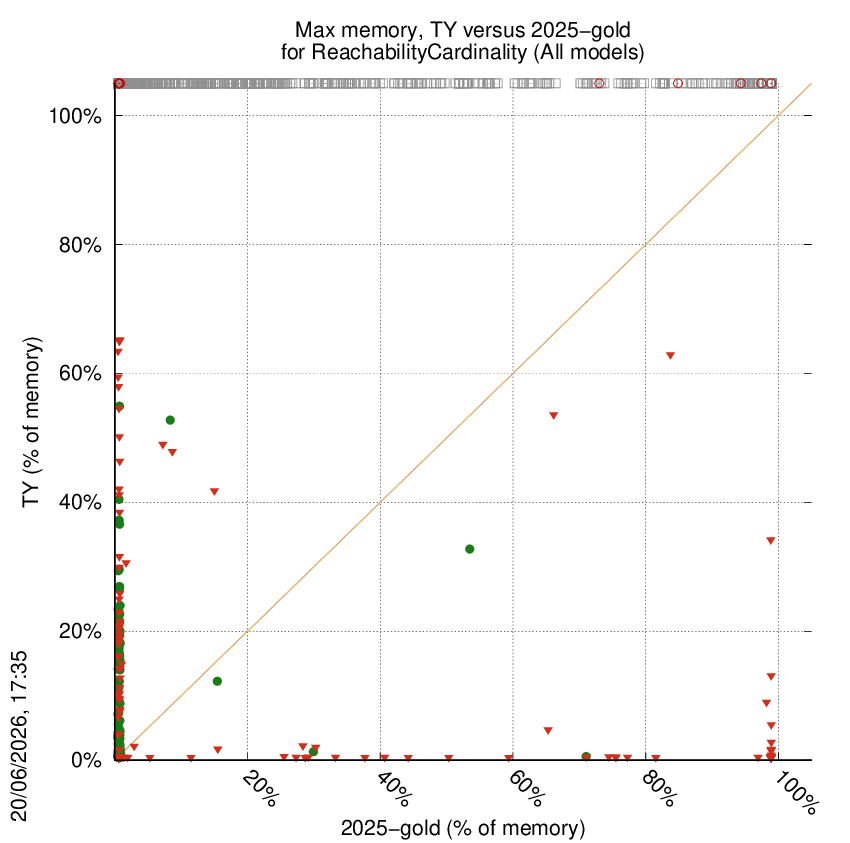
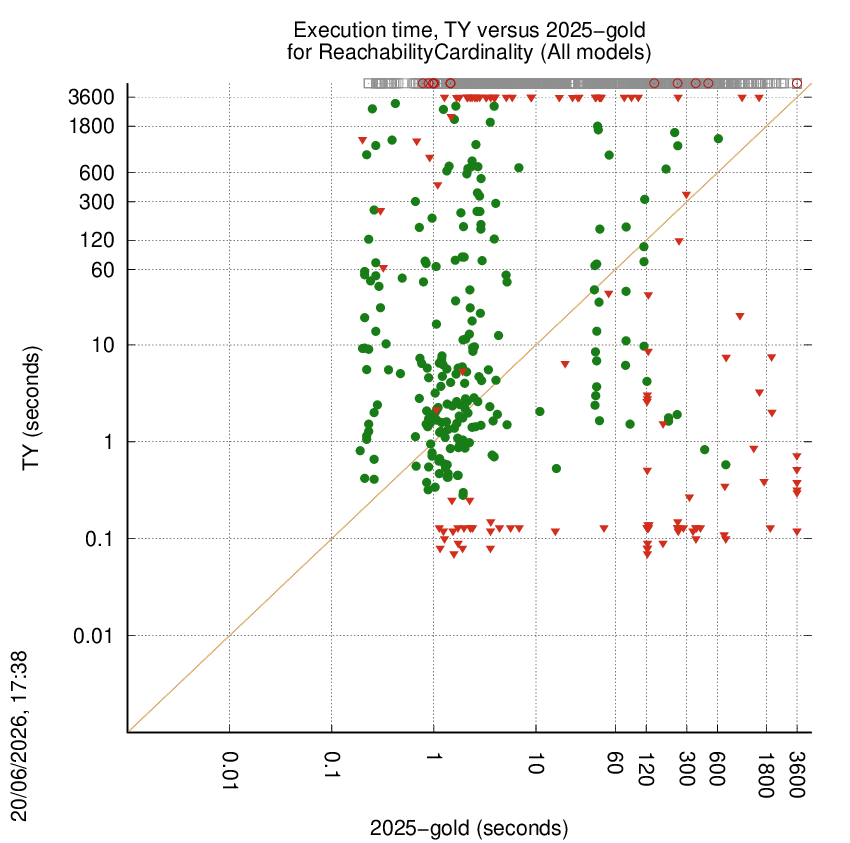
The next sections will show chart comparing performances in terms of both memory and execution time.The x-axis corresponds to the challenging tool where the y-axes represents TY' performances. Thus, points below the diagonal of a chart denote comparisons favorables to the tool while others corresponds to situations where the challenging tool performs better.
You might also find plots out of the range that denote the case were at least one tool could not answer appropriately (error, time-out, could not compute or did not competed).
TY versus ITS-Tools
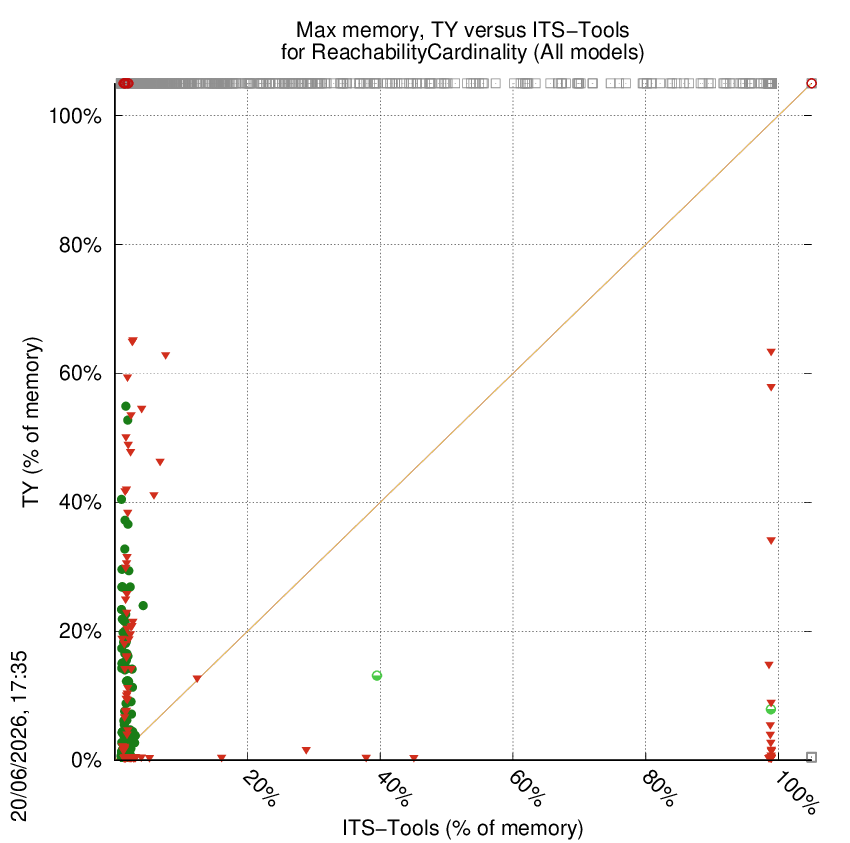
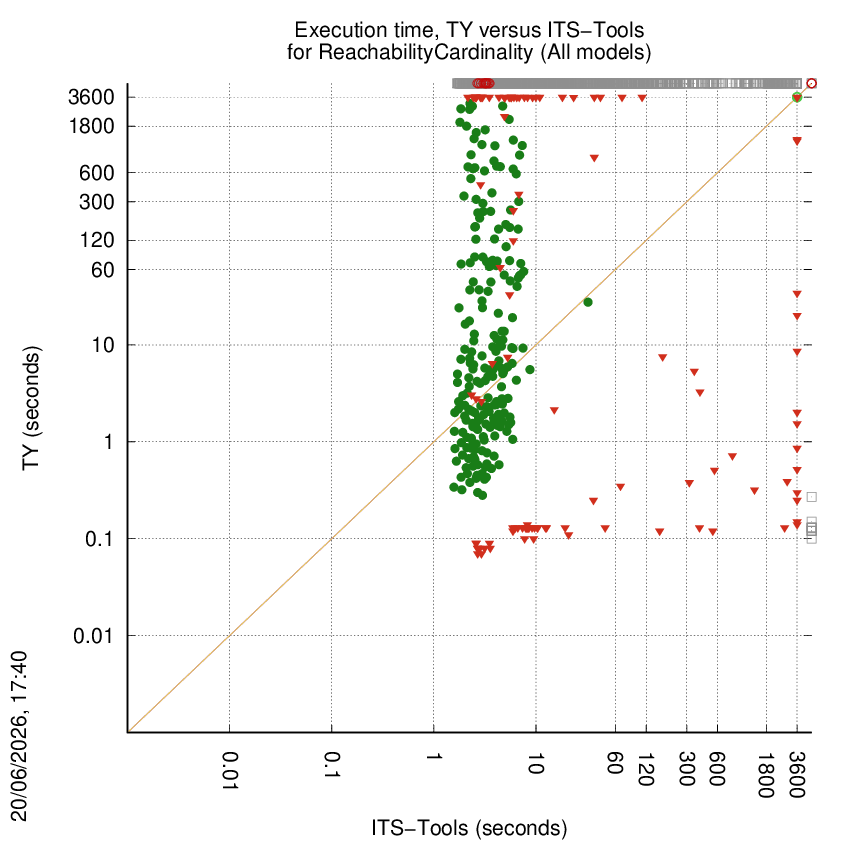
Some statistics are displayed below, based on 3906 runs (1953 for TY and 1953 for ITS-Tools, so there are 1953 plots on each of the two charts). Each execution was allowed 1 hour and 16 GByte of memory. Then performance charts comparing TY to ITS-Tools are shown (you may click on one graph to enlarge it).
| Statistics on the executions | ||||||
| TY | ITS-Tools | Both tools | TY | ITS-Tools | ||
| All computed OK | 11 | 1613 | 212 | Smallest Memory Footprint | ||
| TY = ITS-Tools | — | — | 2 | Times tool wins | 201 | 1747 |
| TY > ITS-Tools | — | — | 0 | Shortest Execution Time | ||
| TY < ITS-Tools | — | — | 110 | Times tool wins | 166 | 1782 |
| Do not compete | 0 | 0 | 0 | |||
| Error detected | 12 | 2 | 0 | |||
| Cannot Compute + Time-out | 1604 | 12 | 2 | |||
On the chart below,  denote cases where
the two tools did computed all results without error,
denote cases where
the two tools did computed all results without error,
 denote cases where the two tool did computed the
same number of values (but not al values in the examination),
denote cases where the two tool did computed the
same number of values (but not al values in the examination),
 denote cases where TY
computed more values than ITS-Tools,
denote cases where TY
computed more values than ITS-Tools,
 denote cases where TY
computed less values than ITS-Tools,
denote cases where TY
computed less values than ITS-Tools,
 denote the cases where at least one tool did not competed,
 denote the cases where at least one
tool computed a bad value and
denote the cases where at least one
tool computed a bad value and  denote the cases where at least one tool stated it could not compute a result or timed-out.
TY wins when points are below the diagonal, ITS-Tools wins when points are above the diagonal.
TY versus smpt
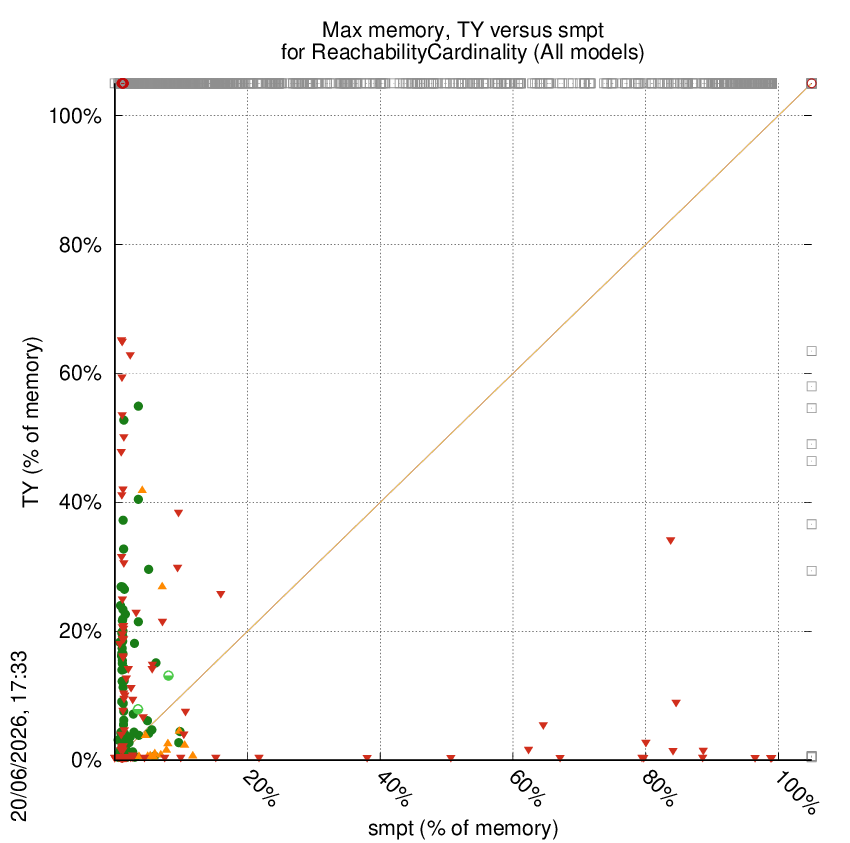
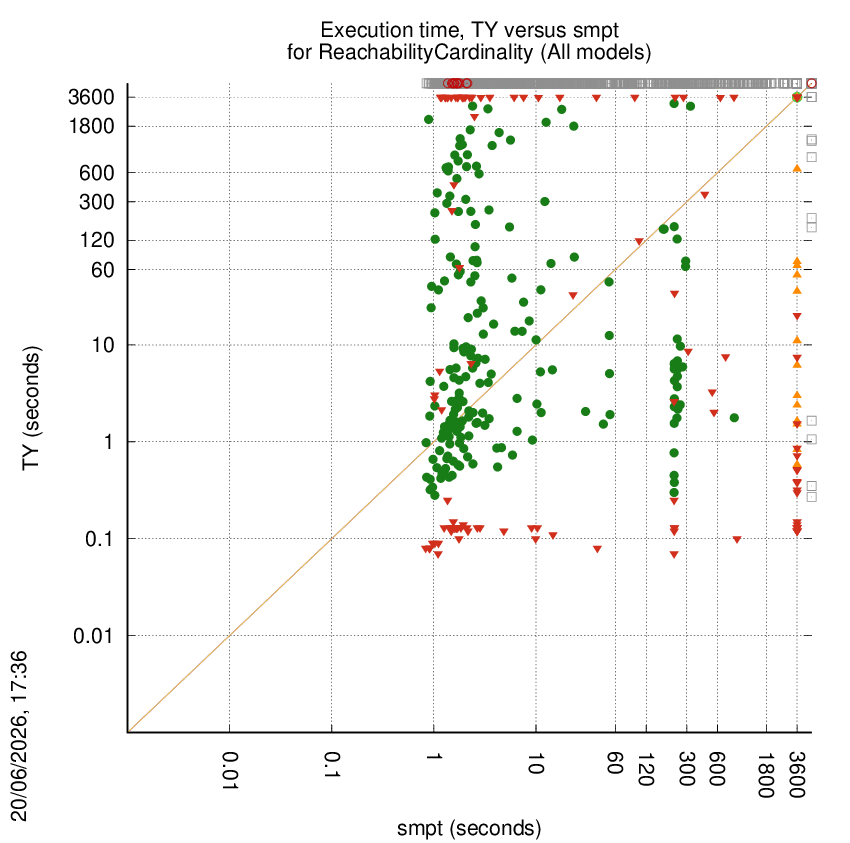
Some statistics are displayed below, based on 3906 runs (1953 for TY and 1953 for smpt, so there are 1953 plots on each of the two charts). Each execution was allowed 1 hour and 16 GByte of memory. Then performance charts comparing TY to smpt are shown (you may click on one graph to enlarge it).
| Statistics on the executions | ||||||
| TY | smpt | Both tools | TY | smpt | ||
| All computed OK | 11 | 1604 | 195 | Smallest Memory Footprint | ||
| TY = smpt | — | — | 2 | Times tool wins | 196 | 1743 |
| TY > smpt | — | — | 14 | Shortest Execution Time | ||
| TY < smpt | — | — | 113 | Times tool wins | 191 | 1748 |
| Do not compete | 0 | 0 | 0 | |||
| Error detected | 12 | 0 | 0 | |||
| Cannot Compute + Time-out | 1593 | 12 | 13 | |||
On the chart below, denote cases where
the two tools did computed all results without error,
denote cases where the two tool did computed the
same number of values (but not al values in the examination),
denote cases where TY
computed more values than smpt,
denote cases where TY
computed less values than smpt,
denote the cases where at least one tool did not competed,
denote the cases where at least one
tool computed a bad value and
denote the cases where at least one tool stated it could not compute a result or timed-out.
TY wins when points are below the diagonal, smpt wins when points are above the diagonal.
TY versus Tapaal
Some statistics are displayed below, based on 3906 runs (1953 for TY and 1953 for Tapaal, so there are 1953 plots on each of the two charts). Each execution was allowed 1 hour and 16 GByte of memory. Then performance charts comparing TY to Tapaal are shown (you may click on one graph to enlarge it).
| Statistics on the executions | ||||||
| TY | Tapaal | Both tools | TY | Tapaal | ||
| All computed OK | 0 | 1618 | 212 | Smallest Memory Footprint | ||
| TY = Tapaal | — | — | 0 | Times tool wins | 149 | 1804 |
| TY > Tapaal | — | — | 0 | Shortest Execution Time | ||
| TY < Tapaal | — | — | 123 | Times tool wins | 141 | 1812 |
| Do not compete | 0 | 0 | 0 | |||
| Error detected | 12 | 0 | 0 | |||
| Cannot Compute + Time-out | 1606 | 0 | 0 | |||
On the chart below, denote cases where
the two tools did computed all results without error,
denote cases where the two tool did computed the
same number of values (but not al values in the examination),
denote cases where TY
computed more values than Tapaal,
denote cases where TY
computed less values than Tapaal,
denote the cases where at least one tool did not competed,
denote the cases where at least one
tool computed a bad value and
denote the cases where at least one tool stated it could not compute a result or timed-out.
TY wins when points are below the diagonal, Tapaal wins when points are above the diagonal.
TY versus 2025-gold
Some statistics are displayed below, based on 3906 runs (1953 for TY and 1953 for 2025-gold, so there are 1953 plots on each of the two charts). Each execution was allowed 1 hour and 16 GByte of memory. Then performance charts comparing TY to 2025-gold are shown (you may click on one graph to enlarge it).
| Statistics on the executions | ||||||
| TY | 2025-gold | Both tools | TY | 2025-gold | ||
| All computed OK | 0 | 1618 | 212 | Smallest Memory Footprint | ||
| TY = 2025-gold | — | — | 0 | Times tool wins | 145 | 1808 |
| TY > 2025-gold | — | — | 0 | Shortest Execution Time | ||
| TY < 2025-gold | — | — | 123 | Times tool wins | 142 | 1811 |
| Do not compete | 0 | 0 | 0 | |||
| Error detected | 12 | 0 | 0 | |||
| Cannot Compute + Time-out | 1606 | 0 | 0 | |||
On the chart below, denote cases where
the two tools did computed all results without error,
denote cases where the two tool did computed the
same number of values (but not al values in the examination),
denote cases where TY
computed more values than 2025-gold,
denote cases where TY
computed less values than 2025-gold,
denote the cases where at least one tool did not competed,
denote the cases where at least one
tool computed a bad value and
denote the cases where at least one tool stated it could not compute a result or timed-out.
TY wins when points are below the diagonal, 2025-gold wins when points are above the diagonal.
TY versus BVT-2026
Some statistics are displayed below, based on 3906 runs (1953 for TY and 1953 for BVT-2026, so there are 1953 plots on each of the two charts). Each execution was allowed 1 hour and 16 GByte of memory. Then performance charts comparing TY to BVT-2026 are shown (you may click on one graph to enlarge it).
Important: here, TY is compared to BVT-2026. It is a good way to check how TY compete in terms of resource consomption with the best tools (even virtual). When TY is best, the corresponding plots are on the diagonal of the scatter plots chart.
| Statistics on the executions | ||||||
| TY | BVT-2026 | Both tools | TY | BVT-2026 | ||
| All computed OK | 0 | 1618 | 212 | Smallest Memory Footprint | ||
| TY = BVT-2026 | — | — | 0 | Times tool wins | 0 | 1953 |
| TY > BVT-2026 | — | — | 0 | Shortest Execution Time | ||
| TY < BVT-2026 | — | — | 123 | Times tool wins | 0 | 1953 |
| Do not compete | 0 | 0 | 0 | |||
| Error detected | 12 | 0 | 0 | |||
| Cannot Compute + Time-out | 1606 | 0 | 0 | |||
For this tool, there are no real execution so comparisons are useless.