

About the Execution of Tapaal for SharedMemory-COL-050000
| Execution Summary | |||||
| Max Memory Used (MB) |
Time wait (ms) | CPU Usage (ms) | I/O Wait (ms) | Computed Result | Execution Status |
| 15695.210 | 1021979.00 | 1448851.00 | 4127.90 | TT?FFFFTFFFTFFFF | normal |
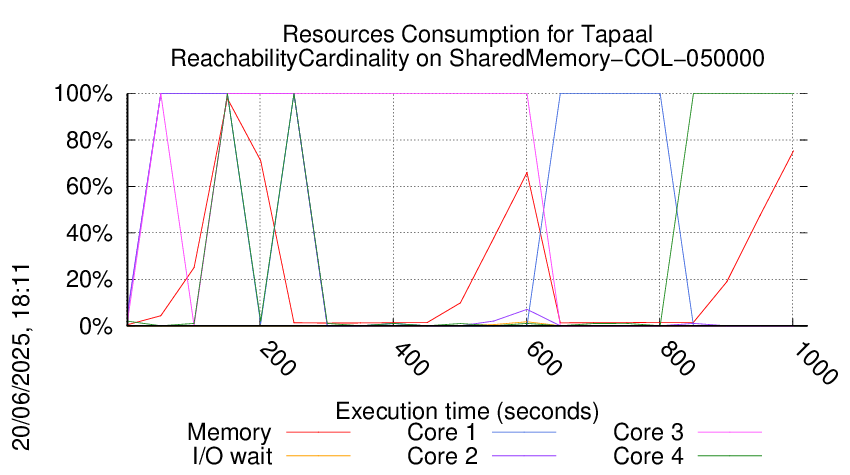
Execution Chart
We display below the execution chart for this examination (boot time has been removed).
Trace from the execution
Formatting '/data/fkordon/mcc2025-input.r200-tall-174894535900190.qcow2', fmt=qcow2 size=4294967296 backing_file=/data/fkordon/mcc2025-input.qcow2 backing_fmt=qcow2 cluster_size=65536 lazy_refcounts=off refcount_bits=16
Waiting for the VM to be ready (probing ssh)
...................................................................................................................................................................................................................................................................................................................................................................................................................................................................................................................................................................................
=====================================================================
Generated by BenchKit 2-5832
Executing tool tapaal
Input is SharedMemory-COL-050000, examination is ReachabilityCardinality
Time confinement is 3600 seconds
Memory confinement is 16384 MBytes
Number of cores is 4
Run identifier is r200-tall-174894535900190
=====================================================================
--------------------
preparation of the directory to be used:
/home/mcc/execution
total 2.8M
-rw-r--r-- 1 mcc users 6.1K May 29 14:47 CTLCardinality.txt
-rw-r--r-- 1 mcc users 54K May 29 14:47 CTLCardinality.xml
-rw-r--r-- 1 mcc users 6.6K May 29 14:47 CTLFireability.txt
-rw-r--r-- 1 mcc users 51K May 29 14:47 CTLFireability.xml
-rw-r--r-- 1 mcc users 4.2K May 29 14:32 GenericPropertiesDefinition.xml
-rw-r--r-- 1 mcc users 6.5K May 29 14:32 GenericPropertiesVerdict.xml
-rw-r--r-- 1 mcc users 4.1K May 29 14:47 LTLCardinality.txt
-rw-r--r-- 1 mcc users 27K May 29 14:47 LTLCardinality.xml
-rw-r--r-- 1 mcc users 2.7K May 29 14:47 LTLFireability.txt
-rw-r--r-- 1 mcc users 18K May 29 14:47 LTLFireability.xml
-rw-r--r-- 1 mcc users 14K May 29 14:47 ReachabilityCardinality.txt
-rw-r--r-- 1 mcc users 135K May 29 14:47 ReachabilityCardinality.xml
-rw-r--r-- 1 mcc users 12K May 29 14:47 ReachabilityFireability.txt
-rw-r--r-- 1 mcc users 82K May 29 14:47 ReachabilityFireability.xml
-rw-r--r-- 1 mcc users 1.8K May 29 14:47 UpperBounds.txt
-rw-r--r-- 1 mcc users 3.8K May 29 14:47 UpperBounds.xml
-rw-r--r-- 1 mcc users 5 May 29 14:32 equiv_pt
-rw-r--r-- 1 mcc users 7 May 29 14:32 instance
-rw-r--r-- 1 mcc users 5 May 29 14:32 iscolored
-rw-r--r-- 1 mcc users 2.3M May 29 14:32 model.pnml
--------------------
content from stdout:
=== Data for post analysis generated by BenchKit (invocation template)
The expected result is a vector of booleans
BOOL_VECTOR
echo here is the order used to build the result vector(from xml file)
FORMULA_NAME SharedMemory-COL-050000-ReachabilityCardinality-2025-00
FORMULA_NAME SharedMemory-COL-050000-ReachabilityCardinality-2025-01
FORMULA_NAME SharedMemory-COL-050000-ReachabilityCardinality-2025-02
FORMULA_NAME SharedMemory-COL-050000-ReachabilityCardinality-2025-03
FORMULA_NAME SharedMemory-COL-050000-ReachabilityCardinality-2025-04
FORMULA_NAME SharedMemory-COL-050000-ReachabilityCardinality-2025-05
FORMULA_NAME SharedMemory-COL-050000-ReachabilityCardinality-2025-06
FORMULA_NAME SharedMemory-COL-050000-ReachabilityCardinality-2025-07
FORMULA_NAME SharedMemory-COL-050000-ReachabilityCardinality-2025-08
FORMULA_NAME SharedMemory-COL-050000-ReachabilityCardinality-2025-09
FORMULA_NAME SharedMemory-COL-050000-ReachabilityCardinality-2025-10
FORMULA_NAME SharedMemory-COL-050000-ReachabilityCardinality-2025-11
FORMULA_NAME SharedMemory-COL-050000-ReachabilityCardinality-2025-12
FORMULA_NAME SharedMemory-COL-050000-ReachabilityCardinality-2025-13
FORMULA_NAME SharedMemory-COL-050000-ReachabilityCardinality-2025-14
FORMULA_NAME SharedMemory-COL-050000-ReachabilityCardinality-2025-15
=== Now, execution of the tool begins
BK_START 1748988222212
tapaal
Got BK_BIN_PATH=/home/mcc/BenchKit/bin/
---> tapaal --- TAPAAL 2025-v2
Setting MODEL_PATH=.
Setting VERIFYPN=/home/mcc/BenchKit/bin/verifypn
Got BK_TIME_CONFINEMENT=3600
Setting TEMPDIR=/home/mcc/BenchKit/bin/tmp
Got BK_MEMORY_CONFINEMENT=16384
Limiting to 16265216 kB
Total timeout: 3590
Time left: 3590
**********************************************
* TAPAAL verifying ReachabilityCardinality *
**********************************************
TEMPDIR=/home/mcc/BenchKit/bin/tmp
QF=/home/mcc/BenchKit/bin/tmp/tmp.arhdwAqsvf
MF=/home/mcc/BenchKit/bin/tmp/tmp.urVDZaJuHv
Time left: 3590
---------------------------------------------------
Step -1: Stripping Colors
---------------------------------------------------
Verifying stripped models (16 in total)
Solution found by stripping colors (step -1) for query index 3
Solution found by stripping colors (step -1) for query index 4
Solution found by stripping colors (step -1) for query index 6
Solution found by stripping colors (step -1) for query index 8
Solution found by stripping colors (step -1) for query index 9
Solution found by stripping colors (step -1) for query index 10
Solution found by stripping colors (step -1) for query index 12
Solution found by stripping colors (step -1) for query index 14
Solution found by stripping colors (step -1) for query index 15
Unable to decide if SharedMemory-COL-050000-ReachabilityCardinality-2025-00 is satisfied.
Query is MAYBE satisfied.
Unable to decide if SharedMemory-COL-050000-ReachabilityCardinality-2025-01 is satisfied.
Query is MAYBE satisfied.
FORMULA SharedMemory-COL-050000-ReachabilityCardinality-2025-03 FALSE TECHNIQUES COLLATERAL_PROCESSING STRUCTURAL_REDUCTION QUERY_REDUCTION SAT_SMT LP_APPROX CPN_APPROX
Query index 3 was solved
Query is NOT satisfied.
Solved using CPN Approximation
FORMULA SharedMemory-COL-050000-ReachabilityCardinality-2025-04 FALSE TECHNIQUES COLLATERAL_PROCESSING STRUCTURAL_REDUCTION QUERY_REDUCTION SAT_SMT LP_APPROX CPN_APPROX
Query index 4 was solved
Query is NOT satisfied.
Solved using CPN Approximation
FORMULA SharedMemory-COL-050000-ReachabilityCardinality-2025-06 FALSE TECHNIQUES COLLATERAL_PROCESSING STRUCTURAL_REDUCTION QUERY_REDUCTION SAT_SMT LP_APPROX CPN_APPROX
Query index 6 was solved
Query is NOT satisfied.
Solved using CPN Approximation
Unable to decide if SharedMemory-COL-050000-ReachabilityCardinality-2025-07 is satisfied.
Query is MAYBE satisfied.
FORMULA SharedMemory-COL-050000-ReachabilityCardinality-2025-08 FALSE TECHNIQUES COLLATERAL_PROCESSING STRUCTURAL_REDUCTION QUERY_REDUCTION SAT_SMT LP_APPROX CPN_APPROX
Query index 8 was solved
Query is NOT satisfied.
Solved using CPN Approximation
FORMULA SharedMemory-COL-050000-ReachabilityCardinality-2025-09 FALSE TECHNIQUES COLLATERAL_PROCESSING STRUCTURAL_REDUCTION QUERY_REDUCTION SAT_SMT LP_APPROX CPN_APPROX
Query index 9 was solved
Query is NOT satisfied.
Solved using CPN Approximation
FORMULA SharedMemory-COL-050000-ReachabilityCardinality-2025-10 FALSE TECHNIQUES COLLATERAL_PROCESSING STRUCTURAL_REDUCTION QUERY_REDUCTION SAT_SMT LP_APPROX CPN_APPROX
Query index 10 was solved
Query is NOT satisfied.
Solved using CPN Approximation
Unable to decide if SharedMemory-COL-050000-ReachabilityCardinality-2025-11 is satisfied.
Query is MAYBE satisfied.
FORMULA SharedMemory-COL-050000-ReachabilityCardinality-2025-12 FALSE TECHNIQUES COLLATERAL_PROCESSING STRUCTURAL_REDUCTION QUERY_REDUCTION SAT_SMT LP_APPROX CPN_APPROX
Query index 12 was solved
Query is NOT satisfied.
Solved using CPN Approximation
FORMULA SharedMemory-COL-050000-ReachabilityCardinality-2025-14 FALSE TECHNIQUES COLLATERAL_PROCESSING STRUCTURAL_REDUCTION QUERY_REDUCTION SAT_SMT LP_APPROX CPN_APPROX
Query index 14 was solved
Query is NOT satisfied.
Solved using CPN Approximation
FORMULA SharedMemory-COL-050000-ReachabilityCardinality-2025-15 FALSE TECHNIQUES COLLATERAL_PROCESSING STRUCTURAL_REDUCTION QUERY_REDUCTION SAT_SMT LP_APPROX CPN_APPROX
Query index 15 was solved
Query is NOT satisfied.
Solved using CPN Approximation
Unable to decide if SharedMemory-COL-050000-ReachabilityCardinality-2025-13 is satisfied.
Query is MAYBE satisfied.
Unable to decide if SharedMemory-COL-050000-ReachabilityCardinality-2025-02 is satisfied.
Query is MAYBE satisfied.
Unable to decide if SharedMemory-COL-050000-ReachabilityCardinality-2025-05 is satisfied.
Query is MAYBE satisfied.
Spent 0.167628 on verification
Time left: 3589
---------------------------------------------------
Step -0.5: Explicit parallel processing
---------------------------------------------------
Doing explicit parallel verification of individual queries (7 in total)
Each query is verified by 4 parallel strategies for 119 seconds
------------------- QUERY 1 ----------------------
Parameters: -C -s DFS --colored-successor-generator even -q 0 ./model.pnml ./ReachabilityCardinality.xml -x 1
Parameters: -C -s BFS --colored-successor-generator even -R 0 -q 0 ./model.pnml ./ReachabilityCardinality.xml -x 1
Parameters: -C -s RDFS --colored-successor-generator even ./model.pnml ./ReachabilityCardinality.xml -x 1
Parameters: -C -s BestFS --colored-successor-generator fixed -q 0 ./model.pnml ./ReachabilityCardinality.xml -x 1
Search=BFS,Trace=DISABLED,PrintBindings=DISABLED,State_Space_Exploration=DISABLED,Colored_Structural_Reduction=DISABLED,Colored_Struct_Red_Timout=30,Structural_Reduction=AGGRESSIVE,Struct_Red_Timout=60,Stubborn_Reduction=ENABLED,Query_Simplication=DISABLED,Init_Potency=ENABLED,InitPotencyTimeout=10,Siphon_Trap=DISABLED,LPSolve_Timeout=10,ExplicitColored=ENABLED,ColoredSuccessorGenerator=EVEN
State with size: 100010 cannot be represented correctly, so full statespace is not explored
Query index 0 was solved
Query is satisfied
STATS:
discovered states: 1
explored states: 1
peak waiting states: 0
end waiting states: 0
biggest encoded state: 0 bytes
@@@1.99,47656@@@
parallel: This job succeeded:
eval /usr/bin/time -f "@@@%e,%M@@@" /home/mcc/BenchKit/bin/verifypn '-C -s BFS --colored-successor-generator even -R 0 -q 0' ./model.pnml ./ReachabilityCardinality.xml -x 1
Solution found by explicit exploration (step -0.5)
FORMULA SharedMemory-COL-050000-ReachabilityCardinality-2025-00 TRUE TECHNIQUES STRUCTURAL_REDUCTION CPN_EXPLICIT
Time left: 3586
------------------- QUERY 2 ----------------------
Parameters: -C -s RDFS --colored-successor-generator even ./model.pnml ./ReachabilityCardinality.xml -x 2
Parameters: -C -s BFS --colored-successor-generator even -R 0 -q 0 ./model.pnml ./ReachabilityCardinality.xml -x 2
Parameters: -C -s DFS --colored-successor-generator even -q 0 ./model.pnml ./ReachabilityCardinality.xml -x 2
Parameters: -C -s BestFS --colored-successor-generator fixed -q 0 ./model.pnml ./ReachabilityCardinality.xml -x 2
Search=BFS,Trace=DISABLED,PrintBindings=DISABLED,State_Space_Exploration=DISABLED,Colored_Structural_Reduction=DISABLED,Colored_Struct_Red_Timout=30,Structural_Reduction=AGGRESSIVE,Struct_Red_Timout=60,Stubborn_Reduction=ENABLED,Query_Simplication=DISABLED,Init_Potency=ENABLED,InitPotencyTimeout=10,Siphon_Trap=DISABLED,LPSolve_Timeout=10,ExplicitColored=ENABLED,ColoredSuccessorGenerator=EVEN
State with size: 100010 cannot be represented correctly, so full statespace is not explored
Query index 0 was solved
Query is satisfied
STATS:
discovered states: 1
explored states: 1
peak waiting states: 0
end waiting states: 0
biggest encoded state: 0 bytes
@@@1.96,47940@@@
parallel: This job succeeded:
eval /usr/bin/time -f "@@@%e,%M@@@" /home/mcc/BenchKit/bin/verifypn '-C -s BFS --colored-successor-generator even -R 0 -q 0' ./model.pnml ./ReachabilityCardinality.xml -x 2
Solution found by explicit exploration (step -0.5)
FORMULA SharedMemory-COL-050000-ReachabilityCardinality-2025-01 TRUE TECHNIQUES STRUCTURAL_REDUCTION CPN_EXPLICIT
Time left: 3584
------------------- QUERY 3 ----------------------
Parameters: -C -s RDFS --colored-successor-generator even ./model.pnml ./ReachabilityCardinality.xml -x 3
Parameters: -C -s BFS --colored-successor-generator even -R 0 -q 0 ./model.pnml ./ReachabilityCardinality.xml -x 3
Parameters: -C -s BestFS --colored-successor-generator fixed -q 0 ./model.pnml ./ReachabilityCardinality.xml -x 3
Parameters: -C -s DFS --colored-successor-generator even -q 0 ./model.pnml ./ReachabilityCardinality.xml -x 3
Search=BFS,Trace=DISABLED,PrintBindings=DISABLED,State_Space_Exploration=DISABLED,Colored_Structural_Reduction=DISABLED,Colored_Struct_Red_Timout=30,Structural_Reduction=AGGRESSIVE,Struct_Red_Timout=60,Stubborn_Reduction=ENABLED,Query_Simplication=DISABLED,Init_Potency=ENABLED,InitPotencyTimeout=10,Siphon_Trap=DISABLED,LPSolve_Timeout=10,ExplicitColored=ENABLED,ColoredSuccessorGenerator=EVEN
State with size: 100010 cannot be represented correctly, so full statespace is not explored
Search=HEUR,Trace=DISABLED,PrintBindings=DISABLED,State_Space_Exploration=DISABLED,Colored_Structural_Reduction=ALL,Colored_Struct_Red_Timout=30,Structural_Reduction=AGGRESSIVE,Struct_Red_Timout=60,Stubborn_Reduction=ENABLED,Query_Simplication=DISABLED,Init_Potency=ENABLED,InitPotencyTimeout=10,Siphon_Trap=DISABLED,LPSolve_Timeout=10,ExplicitColored=ENABLED,ColoredSuccessorGenerator=FIXED
Colored structural reductions computed in 0.903281 seconds
Reduced from 6 to 5 places (1, 16.6667%)
Reduced from 5 to 4 transitions (1, 20%)
Applications of rule AtomicPreAgglomeration: 1
Applications of rule DeadTransitions: 0
Applications of rule ParallelPlaces: 0
Applications of rule ParallelTransitions: 0
Applications of rule PreemptiveFiring: 0
Applications of rule RedundantPlaces: 0
Applications of rule Relevance: 0
Search=RDFS,Trace=DISABLED,PrintBindings=DISABLED,State_Space_Exploration=DISABLED,Colored_Structural_Reduction=ALL,Colored_Struct_Red_Timout=30,Structural_Reduction=AGGRESSIVE,Struct_Red_Timout=60,Stubborn_Reduction=ENABLED,Query_Simplication=ENABLED,QSTimeout=30,Init_Potency=ENABLED,InitPotencyTimeout=10,Siphon_Trap=DISABLED,LPSolve_Timeout=10,ExplicitColored=ENABLED,ColoredSuccessorGenerator=EVEN
Colored structural reductions computed in 0.911277 seconds
Reduced from 6 to 5 places (1, 16.6667%)
Reduced from 5 to 4 transitions (1, 20%)
Applications of rule AtomicPreAgglomeration: 1
Applications of rule DeadTransitions: 0
Applications of rule ParallelPlaces: 0
Applications of rule ParallelTransitions: 0
Applications of rule PreemptiveFiring: 0
Applications of rule RedundantPlaces: 0
Applications of rule Relevance: 0
Search=DFS,Trace=DISABLED,PrintBindings=DISABLED,State_Space_Exploration=DISABLED,Colored_Structural_Reduction=ALL,Colored_Struct_Red_Timout=30,Structural_Reduction=AGGRESSIVE,Struct_Red_Timout=60,Stubborn_Reduction=ENABLED,Query_Simplication=DISABLED,Init_Potency=ENABLED,InitPotencyTimeout=10,Siphon_Trap=DISABLED,LPSolve_Timeout=10,ExplicitColored=ENABLED,ColoredSuccessorGenerator=EVEN
Colored structural reductions computed in 0.907589 seconds
Reduced from 6 to 5 places (1, 16.6667%)
Reduced from 5 to 4 transitions (1, 20%)
Applications of rule AtomicPreAgglomeration: 1
Applications of rule DeadTransitions: 0
Applications of rule ParallelPlaces: 0
Applications of rule ParallelTransitions: 0
Applications of rule PreemptiveFiring: 0
Applications of rule RedundantPlaces: 0
Applications of rule Relevance: 0
Command terminated by signal 9
@@@28.38,15489256@@@
State with size: 100009 cannot be represented correctly, so full statespace is not explored
State with size: 100009 cannot be represented correctly, so full statespace is not explored
Command terminated by signal 9
@@@79.49,13854320@@@
Query before reduction: AG (OwnMemAcc <= Active)
RWSTATS PRE:0,1,0,0,0,0,0,0,0,0,0,0,0,0,0,0,0,0,0,0,0,0,0,0,0,0,0,0,0,0,0,0,0,0,0,
RWSTATS POST:0,1,0,0,0,0,0,0,0,0,0,0,0,0,0,0,0,0,0,0,0,0,0,0,0,0,0,0,0,0,0,0,0,0,0,
Query after reduction: (not EF (Active < OwnMemAcc))
Query reduction finished after 0.001318 seconds.
Query size reduced from 4 to 5 nodes ( -25 percent reduction).
State with size: 100009 cannot be represented correctly, so full statespace is not explored
parallel: Warning: This job was killed because it timed out:
parallel: Warning: eval /usr/bin/time -f "@@@%e,%M@@@" /home/mcc/BenchKit/bin/verifypn '-C -s RDFS --colored-successor-generator even' ./model.pnml ./ReachabilityCardinality.xml -x 3
parallel: Warning: This job was killed because it timed out:
parallel: Warning: eval /usr/bin/time -f "@@@%e,%M@@@" /home/mcc/BenchKit/bin/verifypn '-C -s DFS --colored-successor-generator even -q 0' ./model.pnml ./ReachabilityCardinality.xml -x 3
No solution found (step -0.5)
Time left: 3463
------------------- QUERY 6 ----------------------
Parameters: -C -s BFS --colored-successor-generator even -R 0 -q 0 ./model.pnml ./ReachabilityCardinality.xml -x 6
Parameters: -C -s RDFS --colored-successor-generator even ./model.pnml ./ReachabilityCardinality.xml -x 6
Parameters: -C -s BestFS --colored-successor-generator fixed -q 0 ./model.pnml ./ReachabilityCardinality.xml -x 6
Parameters: -C -s DFS --colored-successor-generator even -q 0 ./model.pnml ./ReachabilityCardinality.xml -x 6
Search=BFS,Trace=DISABLED,PrintBindings=DISABLED,State_Space_Exploration=DISABLED,Colored_Structural_Reduction=DISABLED,Colored_Struct_Red_Timout=30,Structural_Reduction=AGGRESSIVE,Struct_Red_Timout=60,Stubborn_Reduction=ENABLED,Query_Simplication=DISABLED,Init_Potency=ENABLED,InitPotencyTimeout=10,Siphon_Trap=DISABLED,LPSolve_Timeout=10,ExplicitColored=ENABLED,ColoredSuccessorGenerator=EVEN
State with size: 100010 cannot be represented correctly, so full statespace is not explored
Search=RDFS,Trace=DISABLED,PrintBindings=DISABLED,State_Space_Exploration=DISABLED,Colored_Structural_Reduction=ALL,Colored_Struct_Red_Timout=30,Structural_Reduction=AGGRESSIVE,Struct_Red_Timout=60,Stubborn_Reduction=ENABLED,Query_Simplication=ENABLED,QSTimeout=30,Init_Potency=ENABLED,InitPotencyTimeout=10,Siphon_Trap=DISABLED,LPSolve_Timeout=10,ExplicitColored=ENABLED,ColoredSuccessorGenerator=EVEN
Colored structural reductions computed in 2.71639 seconds
Reduced from 6 to 3 places (3, 50%)
Reduced from 5 to 2 transitions (3, 60%)
Applications of rule AtomicPreAgglomeration: 2
Applications of rule DeadTransitions: 0
Applications of rule ParallelPlaces: 0
Applications of rule ParallelTransitions: 0
Applications of rule PreemptiveFiring: 0
Applications of rule RedundantPlaces: 0
Applications of rule Relevance: 1
Search=HEUR,Trace=DISABLED,PrintBindings=DISABLED,State_Space_Exploration=DISABLED,Colored_Structural_Reduction=ALL,Colored_Struct_Red_Timout=30,Structural_Reduction=AGGRESSIVE,Struct_Red_Timout=60,Stubborn_Reduction=ENABLED,Query_Simplication=DISABLED,Init_Potency=ENABLED,InitPotencyTimeout=10,Siphon_Trap=DISABLED,LPSolve_Timeout=10,ExplicitColored=ENABLED,ColoredSuccessorGenerator=FIXED
Colored structural reductions computed in 2.72426 seconds
Reduced from 6 to 3 places (3, 50%)
Reduced from 5 to 2 transitions (3, 60%)
Applications of rule AtomicPreAgglomeration: 2
Applications of rule DeadTransitions: 0
Applications of rule ParallelPlaces: 0
Applications of rule ParallelTransitions: 0
Applications of rule PreemptiveFiring: 0
Applications of rule RedundantPlaces: 0
Applications of rule Relevance: 1
Search=DFS,Trace=DISABLED,PrintBindings=DISABLED,State_Space_Exploration=DISABLED,Colored_Structural_Reduction=ALL,Colored_Struct_Red_Timout=30,Structural_Reduction=AGGRESSIVE,Struct_Red_Timout=60,Stubborn_Reduction=ENABLED,Query_Simplication=DISABLED,Init_Potency=ENABLED,InitPotencyTimeout=10,Siphon_Trap=DISABLED,LPSolve_Timeout=10,ExplicitColored=ENABLED,ColoredSuccessorGenerator=EVEN
Colored structural reductions computed in 2.72728 seconds
Reduced from 6 to 3 places (3, 50%)
Reduced from 5 to 2 transitions (3, 60%)
Applications of rule AtomicPreAgglomeration: 2
Applications of rule DeadTransitions: 0
Applications of rule ParallelPlaces: 0
Applications of rule ParallelTransitions: 0
Applications of rule PreemptiveFiring: 0
Applications of rule RedundantPlaces: 0
Applications of rule Relevance: 1
Command terminated by signal 9
@@@27.84,15489116@@@
State with size: 100005 cannot be represented correctly, so full statespace is not explored
State with size: 100005 cannot be represented correctly, so full statespace is not explored
Query index 0 was solved
Query is NOT satisfied
STATS:
discovered states: 98
explored states: 98
peak waiting states: 97
end waiting states: 97
biggest encoded state: 65535 bytes
Command exited with non-zero status 1
@@@59.78,211772@@@
Command terminated by signal 9
@@@81.28,15896720@@@
Query before reduction: AG (OwnMemAcc <= 96)
RWSTATS PRE:0,1,0,0,0,0,0,0,0,0,0,0,0,0,0,0,0,0,0,0,0,0,0,0,0,0,0,0,0,0,0,0,0,0,0,
RWSTATS POST:0,1,0,0,0,0,0,0,0,0,0,0,0,0,0,0,0,0,0,0,0,0,0,0,0,0,0,0,0,0,0,0,0,0,0,
Query after reduction: (not EF (96 < OwnMemAcc))
Query reduction finished after 0.001627 seconds.
Query size reduced from 4 to 5 nodes ( -25 percent reduction).
State with size: 100005 cannot be represented correctly, so full statespace is not explored
parallel: Warning: This job was killed because it timed out:
parallel: Warning: eval /usr/bin/time -f "@@@%e,%M@@@" /home/mcc/BenchKit/bin/verifypn '-C -s RDFS --colored-successor-generator even' ./model.pnml ./ReachabilityCardinality.xml -x 6
Solution found by explicit exploration (step -0.5)
FORMULA SharedMemory-COL-050000-ReachabilityCardinality-2025-05 FALSE TECHNIQUES STRUCTURAL_REDUCTION CPN_EXPLICIT
Time left: 3342
------------------- QUERY 8 ----------------------
Parameters: -C -s RDFS --colored-successor-generator even ./model.pnml ./ReachabilityCardinality.xml -x 8
Parameters: -C -s BFS --colored-successor-generator even -R 0 -q 0 ./model.pnml ./ReachabilityCardinality.xml -x 8
Parameters: -C -s BestFS --colored-successor-generator fixed -q 0 ./model.pnml ./ReachabilityCardinality.xml -x 8
Parameters: -C -s DFS --colored-successor-generator even -q 0 ./model.pnml ./ReachabilityCardinality.xml -x 8
Search=BFS,Trace=DISABLED,PrintBindings=DISABLED,State_Space_Exploration=DISABLED,Colored_Structural_Reduction=DISABLED,Colored_Struct_Red_Timout=30,Structural_Reduction=AGGRESSIVE,Struct_Red_Timout=60,Stubborn_Reduction=ENABLED,Query_Simplication=DISABLED,Init_Potency=ENABLED,InitPotencyTimeout=10,Siphon_Trap=DISABLED,LPSolve_Timeout=10,ExplicitColored=ENABLED,ColoredSuccessorGenerator=EVEN
State with size: 100010 cannot be represented correctly, so full statespace is not explored
Query index 0 was solved
Query is satisfied
STATS:
discovered states: 1
explored states: 1
peak waiting states: 0
end waiting states: 0
biggest encoded state: 0 bytes
@@@2.02,47100@@@
parallel: This job succeeded:
eval /usr/bin/time -f "@@@%e,%M@@@" /home/mcc/BenchKit/bin/verifypn '-C -s BFS --colored-successor-generator even -R 0 -q 0' ./model.pnml ./ReachabilityCardinality.xml -x 8
Solution found by explicit exploration (step -0.5)
FORMULA SharedMemory-COL-050000-ReachabilityCardinality-2025-07 TRUE TECHNIQUES STRUCTURAL_REDUCTION CPN_EXPLICIT
Time left: 3340
------------------- QUERY 12 ----------------------
Parameters: -C -s RDFS --colored-successor-generator even ./model.pnml ./ReachabilityCardinality.xml -x 12
Parameters: -C -s DFS --colored-successor-generator even -q 0 ./model.pnml ./ReachabilityCardinality.xml -x 12
Parameters: -C -s BestFS --colored-successor-generator fixed -q 0 ./model.pnml ./ReachabilityCardinality.xml -x 12
Parameters: -C -s BFS --colored-successor-generator even -R 0 -q 0 ./model.pnml ./ReachabilityCardinality.xml -x 12
Search=RDFS,Trace=DISABLED,PrintBindings=DISABLED,State_Space_Exploration=DISABLED,Colored_Structural_Reduction=ALL,Colored_Struct_Red_Timout=30,Structural_Reduction=AGGRESSIVE,Struct_Red_Timout=60,Stubborn_Reduction=ENABLED,Query_Simplication=ENABLED,QSTimeout=30,Init_Potency=ENABLED,InitPotencyTimeout=10,Siphon_Trap=DISABLED,LPSolve_Timeout=10,ExplicitColored=ENABLED,ColoredSuccessorGenerator=EVEN
Colored structural reductions computed in 0.000193 seconds
Reduced from 6 to 6 places (0, 0%)
Reduced from 5 to 5 transitions (0, 0%)
Applications of rule AtomicPreAgglomeration: 0
Applications of rule DeadTransitions: 0
Applications of rule ParallelPlaces: 0
Applications of rule ParallelTransitions: 0
Applications of rule PreemptiveFiring: 0
Applications of rule RedundantPlaces: 0
Applications of rule Relevance: 0
Could not do colored reductions
Search=DFS,Trace=DISABLED,PrintBindings=DISABLED,State_Space_Exploration=DISABLED,Colored_Structural_Reduction=ALL,Colored_Struct_Red_Timout=30,Structural_Reduction=AGGRESSIVE,Struct_Red_Timout=60,Stubborn_Reduction=ENABLED,Query_Simplication=DISABLED,Init_Potency=ENABLED,InitPotencyTimeout=10,Siphon_Trap=DISABLED,LPSolve_Timeout=10,ExplicitColored=ENABLED,ColoredSuccessorGenerator=EVEN
Colored structural reductions computed in 0.000208 seconds
Reduced from 6 to 6 places (0, 0%)
Reduced from 5 to 5 transitions (0, 0%)
Applications of rule AtomicPreAgglomeration: 0
Applications of rule DeadTransitions: 0
Applications of rule ParallelPlaces: 0
Applications of rule ParallelTransitions: 0
Applications of rule PreemptiveFiring: 0
Applications of rule RedundantPlaces: 0
Applications of rule Relevance: 0
Could not do colored reductions
State with size: 100010 cannot be represented correctly, so full statespace is not explored
Query index 0 was solved
Query is satisfied
STATS:
discovered states: 1
explored states: 1
peak waiting states: 0
end waiting states: 0
biggest encoded state: 0 bytes
@@@2.91,47816@@@
parallel: This job succeeded:
eval /usr/bin/time -f "@@@%e,%M@@@" /home/mcc/BenchKit/bin/verifypn '-C -s DFS --colored-successor-generator even -q 0' ./model.pnml ./ReachabilityCardinality.xml -x 12
Solution found by explicit exploration (step -0.5)
FORMULA SharedMemory-COL-050000-ReachabilityCardinality-2025-11 TRUE TECHNIQUES STRUCTURAL_REDUCTION CPN_EXPLICIT
Time left: 3337
------------------- QUERY 14 ----------------------
Parameters: -C -s BFS --colored-successor-generator even -R 0 -q 0 ./model.pnml ./ReachabilityCardinality.xml -x 14
Parameters: -C -s RDFS --colored-successor-generator even ./model.pnml ./ReachabilityCardinality.xml -x 14
Parameters: -C -s BestFS --colored-successor-generator fixed -q 0 ./model.pnml ./ReachabilityCardinality.xml -x 14
Parameters: -C -s DFS --colored-successor-generator even -q 0 ./model.pnml ./ReachabilityCardinality.xml -x 14
Search=BFS,Trace=DISABLED,PrintBindings=DISABLED,State_Space_Exploration=DISABLED,Colored_Structural_Reduction=DISABLED,Colored_Struct_Red_Timout=30,Structural_Reduction=AGGRESSIVE,Struct_Red_Timout=60,Stubborn_Reduction=ENABLED,Query_Simplication=DISABLED,Init_Potency=ENABLED,InitPotencyTimeout=10,Siphon_Trap=DISABLED,LPSolve_Timeout=10,ExplicitColored=ENABLED,ColoredSuccessorGenerator=EVEN
State with size: 100010 cannot be represented correctly, so full statespace is not explored
Query index 0 was solved
Query is NOT satisfied
STATS:
discovered states: 2
explored states: 2
peak waiting states: 0
end waiting states: 1
biggest encoded state: 65535 bytes
Command exited with non-zero status 1
@@@1.95,48344@@@
Search=RDFS,Trace=DISABLED,PrintBindings=DISABLED,State_Space_Exploration=DISABLED,Colored_Structural_Reduction=ALL,Colored_Struct_Red_Timout=30,Structural_Reduction=AGGRESSIVE,Struct_Red_Timout=60,Stubborn_Reduction=ENABLED,Query_Simplication=ENABLED,QSTimeout=30,Init_Potency=ENABLED,InitPotencyTimeout=10,Siphon_Trap=DISABLED,LPSolve_Timeout=10,ExplicitColored=ENABLED,ColoredSuccessorGenerator=EVEN
Colored structural reductions computed in 0.000202 seconds
Reduced from 6 to 6 places (0, 0%)
Reduced from 5 to 5 transitions (0, 0%)
Applications of rule AtomicPreAgglomeration: 0
Applications of rule DeadTransitions: 0
Applications of rule ParallelPlaces: 0
Applications of rule ParallelTransitions: 0
Applications of rule PreemptiveFiring: 0
Applications of rule RedundantPlaces: 0
Applications of rule Relevance: 0
Could not do colored reductions
Search=HEUR,Trace=DISABLED,PrintBindings=DISABLED,State_Space_Exploration=DISABLED,Colored_Structural_Reduction=ALL,Colored_Struct_Red_Timout=30,Structural_Reduction=AGGRESSIVE,Struct_Red_Timout=60,Stubborn_Reduction=ENABLED,Query_Simplication=DISABLED,Init_Potency=ENABLED,InitPotencyTimeout=10,Siphon_Trap=DISABLED,LPSolve_Timeout=10,ExplicitColored=ENABLED,ColoredSuccessorGenerator=FIXED
Colored structural reductions computed in 0.000206 seconds
Reduced from 6 to 6 places (0, 0%)
Reduced from 5 to 5 transitions (0, 0%)
Applications of rule AtomicPreAgglomeration: 0
Applications of rule DeadTransitions: 0
Applications of rule ParallelPlaces: 0
Applications of rule ParallelTransitions: 0
Applications of rule PreemptiveFiring: 0
Applications of rule RedundantPlaces: 0
Applications of rule Relevance: 0
Could not do colored reductions
Search=DFS,Trace=DISABLED,PrintBindings=DISABLED,State_Space_Exploration=DISABLED,Colored_Structural_Reduction=ALL,Colored_Struct_Red_Timout=30,Structural_Reduction=AGGRESSIVE,Struct_Red_Timout=60,Stubborn_Reduction=ENABLED,Query_Simplication=DISABLED,Init_Potency=ENABLED,InitPotencyTimeout=10,Siphon_Trap=DISABLED,LPSolve_Timeout=10,ExplicitColored=ENABLED,ColoredSuccessorGenerator=EVEN
Colored structural reductions computed in 0.000195 seconds
Reduced from 6 to 6 places (0, 0%)
Reduced from 5 to 5 transitions (0, 0%)
Applications of rule AtomicPreAgglomeration: 0
Applications of rule DeadTransitions: 0
Applications of rule ParallelPlaces: 0
Applications of rule ParallelTransitions: 0
Applications of rule PreemptiveFiring: 0
Applications of rule RedundantPlaces: 0
Applications of rule Relevance: 0
Could not do colored reductions
Query before reduction: AG ((Queue <= 44) and ((not ((OwnMemAcc <= 71) and (Queue <= Memory))) or (not ((34 <= Ext_Bus) and (not ((Ext_Mem_Acc <= Memory) or (Ext_Bus <= Ext_Bus))) and (not (((Ext_Mem_Acc <= 28) or (87 <= Ext_Mem_Acc)) and ((Memory <= 50) or (Ext_Mem_Acc <= Ext_Mem_Acc))))))) and (Ext_Mem_Acc <= OwnMemAcc) and ((not ((not (82 <= Ext_Bus)) or (not (Ext_Bus <= 26)))) or ((not (Ext_Bus <= 16)) and ((83 <= Ext_Mem_Acc) or (22 <= Active))) or (not (21 <= Active)) or (not (((Active <= Ext_Mem_Acc) or (Queue <= Queue)) and (9 <= OwnMemAcc) and (Ext_Mem_Acc <= Active)))) and ((not (((Active <= OwnMemAcc) or (67 <= Ext_Bus)) and (58 <= Memory) and (12 <= Ext_Bus) and ((47 <= Active) or (72 <= Active)) and ((46 <= OwnMemAcc) or (26 <= Queue)))) or (not ((not (Active <= 63)) and (not ((Ext_Mem_Acc <= OwnMemAcc) and (Ext_Mem_Acc <= OwnMemAcc)))))) and (((OwnMemAcc <= 93) and (Memory <= Active) and (Ext_Bus <= 4) and ((Active <= Queue) or ((Ext_Mem_Acc <= Active) and (Ext_Bus <= 92)))) or ((not ((not (((Active <= Ext_Mem_Acc) or (OwnMemAcc <= OwnMemAcc)) and ((Active <= OwnMemAcc) or (Ext_Bus <= Memory)))) or (not ((Ext_Mem_Acc <= 14) and (6 <= Ext_Bus))))) and (Ext_Bus <= Memory))))
RWSTATS PRE:0,1,0,0,0,0,0,0,0,0,0,0,0,0,0,0,0,0,0,0,0,0,0,0,0,0,0,0,0,0,9,0,0,0,0,
RWSTATS POST:0,1,0,0,0,0,0,0,0,0,0,0,0,0,0,0,0,0,0,0,0,0,0,0,0,0,0,0,0,0,0,0,0,0,0,
Query after reduction: (not EF ((44 < Queue) or (OwnMemAcc < Ext_Mem_Acc) or ((21 <= Active) and (9 <= OwnMemAcc) and (Ext_Mem_Acc <= Active)) or (93 < OwnMemAcc) or (Active < Memory)))
Query reduction finished after 0.00386 seconds.
Query size reduced from 184 to 25 nodes ( 86.413 percent reduction).
State with size: 100010 cannot be represented correctly, so full statespace is not explored
Query index 0 was solved
Query is NOT satisfied
STATS:
discovered states: 2
explored states: 2
peak waiting states: 0
end waiting states: 1
biggest encoded state: 65535 bytes
Command exited with non-zero status 1
@@@3.90,55488@@@
State with size: 100010 cannot be represented correctly, so full statespace is not explored
Query index 0 was solved
Query is NOT satisfied
STATS:
discovered states: 2
explored states: 2
peak waiting states: 0
end waiting states: 1
biggest encoded state: 65535 bytes
Command exited with non-zero status 1
@@@3.90,48232@@@
State with size: 100010 cannot be represented correctly, so full statespace is not explored
Query index 0 was solved
Query is NOT satisfied
STATS:
discovered states: 2
explored states: 2
peak waiting states: 0
end waiting states: 1
biggest encoded state: 65535 bytes
Command exited with non-zero status 1
@@@3.95,48488@@@
Solution found by explicit exploration (step -0.5)
FORMULA SharedMemory-COL-050000-ReachabilityCardinality-2025-13 FALSE TECHNIQUES STRUCTURAL_REDUCTION CPN_EXPLICIT
Time left: 3333
Time left: 3333
---------------------------------------------------
Step 0: Parallel Simplification
---------------------------------------------------
Doing parallel simplification (1 in total)
Total simplification timout is 718 -- reduction timeout is 299
timeout 3333 /home/mcc/BenchKit/bin/verifypn -n -q 718 -l 29 -d 299 -z 4 -s OverApprox --binary-query-io 2 --write-simplified /home/mcc/BenchKit/bin/tmp/tmp.arhdwAqsvf --write-reduced /home/mcc/BenchKit/bin/tmp/tmp.urVDZaJuHv -x 3 ./model.pnml ./ReachabilityCardinality.xml
terminate called after throwing an instance of 'std::bad_alloc'
what(): std::bad_alloc
No simplified files created. Constructing non simplified files.
Time left: 2951
/home/mcc/BenchKit/bin/verifypn -n -q 0 -d 0 -z 4 --binary-query-io 2 --write-simplified /home/mcc/BenchKit/bin/tmp/tmp.arhdwAqsvf --write-reduced /home/mcc/BenchKit/bin/tmp/tmp.urVDZaJuHv -x 3 ./model.pnml ./ReachabilityCardinality.xml
terminate called after throwing an instance of 'std::bad_alloc'
what(): std::bad_alloc
Time left: 2568
Model file after phase 0 is empty (CPN unfolding failed), exiting ...
terminated-with-cleanup
BK_STOP 1748989244191
--------------------
content from stderr:
Sequence of Actions to be Executed by the VM
This is useful if one wants to reexecute the tool in the VM from the submitted image disk.
set -x
# this is for BenchKit: configuration of major elements for the test
export BK_INPUT="SharedMemory-COL-050000"
export BK_EXAMINATION="ReachabilityCardinality"
export BK_TOOL="tapaal"
export BK_RESULT_DIR="/tmp/BK_RESULTS/OUTPUTS"
export BK_TIME_CONFINEMENT="3600"
export BK_MEMORY_CONFINEMENT="16384"
export BK_BIN_PATH="/home/mcc/BenchKit/bin/"
# this is specific to your benchmark or test
export BIN_DIR="$HOME/BenchKit/bin"
# remove the execution directoty if it exists (to avoid increse of .vmdk images)
if [ -d execution ] ; then
rm -rf execution
fi
# this is for BenchKit: explicit launching of the test
echo "====================================================================="
echo " Generated by BenchKit 2-5832"
echo " Executing tool tapaal"
echo " Input is SharedMemory-COL-050000, examination is ReachabilityCardinality"
echo " Time confinement is $BK_TIME_CONFINEMENT seconds"
echo " Memory confinement is 16384 MBytes"
echo " Number of cores is 4"
echo " Run identifier is r200-tall-174894535900190"
echo "====================================================================="
echo
echo "--------------------"
echo "preparation of the directory to be used:"
tar xzf /home/mcc/BenchKit/INPUTS/SharedMemory-COL-050000.tgz
mv SharedMemory-COL-050000 execution
cd execution
if [ "ReachabilityCardinality" = "ReachabilityDeadlock" ] || [ "ReachabilityCardinality" = "UpperBounds" ] || [ "ReachabilityCardinality" = "QuasiLiveness" ] || [ "ReachabilityCardinality" = "StableMarking" ] || [ "ReachabilityCardinality" = "Liveness" ] || [ "ReachabilityCardinality" = "OneSafe" ] || [ "ReachabilityCardinality" = "StateSpace" ]; then
rm -f GenericPropertiesVerdict.xml
fi
pwd
ls -lh
echo
echo "--------------------"
echo "content from stdout:"
echo
echo "=== Data for post analysis generated by BenchKit (invocation template)"
echo
if [ "ReachabilityCardinality" = "UpperBounds" ] ; then
echo "The expected result is a vector of positive values"
echo NUM_VECTOR
elif [ "ReachabilityCardinality" != "StateSpace" ] ; then
echo "The expected result is a vector of booleans"
echo BOOL_VECTOR
else
echo "no data necessary for post analysis"
fi
echo
if [ -f "ReachabilityCardinality.xml" ] ; then # for cunf (txt files deleted;-)
echo echo "here is the order used to build the result vector(from xml file)"
for x in $(grep '
echo "FORMULA_NAME $x"
done
elif [ "ReachabilityCardinality" = "ReachabilityDeadlock" ] || [ "ReachabilityCardinality" = "QuasiLiveness" ] || [ "ReachabilityCardinality" = "StableMarking" ] || [ "ReachabilityCardinality" = "Liveness" ] || [ "ReachabilityCardinality" = "OneSafe" ] ; then
echo "FORMULA_NAME ReachabilityCardinality"
fi
echo
echo "=== Now, execution of the tool begins"
echo
echo -n "BK_START "
date -u +%s%3N
echo
timeout -s 9 $BK_TIME_CONFINEMENT bash -c "/home/mcc/BenchKit/BenchKit_head.sh 2> STDERR ; echo ; echo -n \"BK_STOP \" ; date -u +%s%3N"
if [ $? -eq 137 ] ; then
echo
echo "BK_TIME_CONFINEMENT_REACHED"
fi
echo
echo "--------------------"
echo "content from stderr:"
echo
cat STDERR ;