

About the Execution of Tapaal for PolyORBLF-COL-S02J04T10
| Execution Summary | |||||
| Max Memory Used (MB) |
Time wait (ms) | CPU Usage (ms) | I/O Wait (ms) | Computed Result | Execution Status |
| 15692.200 | 43050.00 | 46138.00 | 192.90 | TTFTTTFFFFTTFFFT | normal |
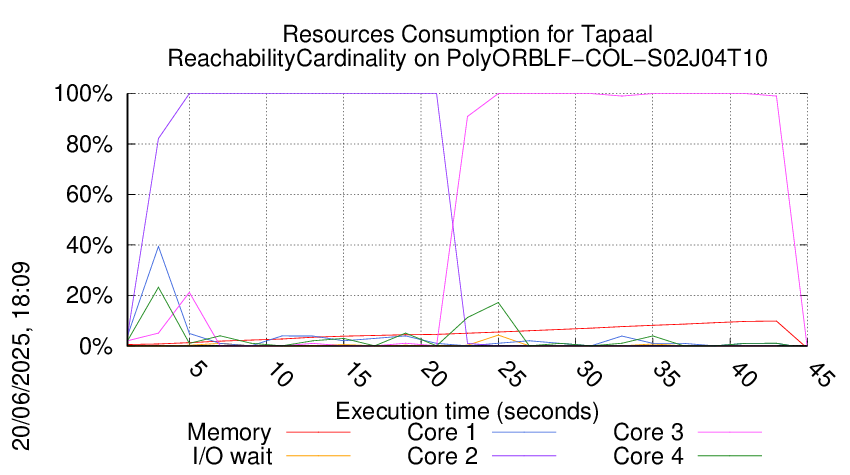
Execution Chart
We display below the execution chart for this examination (boot time has been removed).
Trace from the execution
Formatting '/data/fkordon/mcc2025-input.r158-tall-174881256900286.qcow2', fmt=qcow2 size=4294967296 backing_file=/data/fkordon/mcc2025-input.qcow2 backing_fmt=qcow2 cluster_size=65536 lazy_refcounts=off refcount_bits=16
Waiting for the VM to be ready (probing ssh)
.................
=====================================================================
Generated by BenchKit 2-5832
Executing tool tapaal
Input is PolyORBLF-COL-S02J04T10, examination is ReachabilityCardinality
Time confinement is 3600 seconds
Memory confinement is 16384 MBytes
Number of cores is 4
Run identifier is r158-tall-174881256900286
=====================================================================
--------------------
preparation of the directory to be used:
/home/mcc/execution
total 672K
-rw-r--r-- 1 mcc users 6.4K May 29 14:47 CTLCardinality.txt
-rw-r--r-- 1 mcc users 54K May 29 14:47 CTLCardinality.xml
-rw-r--r-- 1 mcc users 7.2K May 29 14:47 CTLFireability.txt
-rw-r--r-- 1 mcc users 65K May 29 14:47 CTLFireability.xml
-rw-r--r-- 1 mcc users 4.2K May 29 14:32 GenericPropertiesDefinition.xml
-rw-r--r-- 1 mcc users 6.3K May 29 14:32 GenericPropertiesVerdict.xml
-rw-r--r-- 1 mcc users 4.6K May 29 14:47 LTLCardinality.txt
-rw-r--r-- 1 mcc users 30K May 29 14:47 LTLCardinality.xml
-rw-r--r-- 1 mcc users 2.5K May 29 14:47 LTLFireability.txt
-rw-r--r-- 1 mcc users 17K May 29 14:47 LTLFireability.xml
-rw-r--r-- 1 mcc users 20K May 29 14:47 ReachabilityCardinality.txt
-rw-r--r-- 1 mcc users 187K May 29 14:47 ReachabilityCardinality.xml
-rw-r--r-- 1 mcc users 7.8K May 29 14:47 ReachabilityFireability.txt
-rw-r--r-- 1 mcc users 58K May 29 14:47 ReachabilityFireability.xml
-rw-r--r-- 1 mcc users 1.8K May 29 14:47 UpperBounds.txt
-rw-r--r-- 1 mcc users 3.9K May 29 14:47 UpperBounds.xml
-rw-r--r-- 1 mcc users 5 May 29 14:32 equiv_pt
-rw-r--r-- 1 mcc users 10 May 29 14:32 instance
-rw-r--r-- 1 mcc users 5 May 29 14:32 iscolored
-rw-r--r-- 1 mcc users 154K May 29 14:32 model.pnml
--------------------
content from stdout:
=== Data for post analysis generated by BenchKit (invocation template)
The expected result is a vector of booleans
BOOL_VECTOR
echo here is the order used to build the result vector(from xml file)
FORMULA_NAME PolyORBLF-COL-S02J04T10-ReachabilityCardinality-2025-00
FORMULA_NAME PolyORBLF-COL-S02J04T10-ReachabilityCardinality-2025-01
FORMULA_NAME PolyORBLF-COL-S02J04T10-ReachabilityCardinality-2025-02
FORMULA_NAME PolyORBLF-COL-S02J04T10-ReachabilityCardinality-2025-03
FORMULA_NAME PolyORBLF-COL-S02J04T10-ReachabilityCardinality-2025-04
FORMULA_NAME PolyORBLF-COL-S02J04T10-ReachabilityCardinality-2025-05
FORMULA_NAME PolyORBLF-COL-S02J04T10-ReachabilityCardinality-2025-06
FORMULA_NAME PolyORBLF-COL-S02J04T10-ReachabilityCardinality-2025-07
FORMULA_NAME PolyORBLF-COL-S02J04T10-ReachabilityCardinality-2025-08
FORMULA_NAME PolyORBLF-COL-S02J04T10-ReachabilityCardinality-2025-09
FORMULA_NAME PolyORBLF-COL-S02J04T10-ReachabilityCardinality-2025-10
FORMULA_NAME PolyORBLF-COL-S02J04T10-ReachabilityCardinality-2025-11
FORMULA_NAME PolyORBLF-COL-S02J04T10-ReachabilityCardinality-2025-12
FORMULA_NAME PolyORBLF-COL-S02J04T10-ReachabilityCardinality-2025-13
FORMULA_NAME PolyORBLF-COL-S02J04T10-ReachabilityCardinality-2025-14
FORMULA_NAME PolyORBLF-COL-S02J04T10-ReachabilityCardinality-2025-15
=== Now, execution of the tool begins
BK_START 1748901652186
tapaal
Got BK_BIN_PATH=/home/mcc/BenchKit/bin/
---> tapaal --- TAPAAL 2025-v2
Setting MODEL_PATH=.
Setting VERIFYPN=/home/mcc/BenchKit/bin/verifypn
Got BK_TIME_CONFINEMENT=3600
Setting TEMPDIR=/home/mcc/BenchKit/bin/tmp
Got BK_MEMORY_CONFINEMENT=16384
Limiting to 16265216 kB
Total timeout: 3590
Time left: 3590
**********************************************
* TAPAAL verifying ReachabilityCardinality *
**********************************************
TEMPDIR=/home/mcc/BenchKit/bin/tmp
QF=/home/mcc/BenchKit/bin/tmp/tmp.XaNCXKvvqe
MF=/home/mcc/BenchKit/bin/tmp/tmp.QubjGkE3yY
Time left: 3590
---------------------------------------------------
Step -1: Stripping Colors
---------------------------------------------------
Verifying stripped models (16 in total)
Solution found by stripping colors (step -1) for query index 0
Solution found by stripping colors (step -1) for query index 1
Solution found by stripping colors (step -1) for query index 2
Solution found by stripping colors (step -1) for query index 3
Solution found by stripping colors (step -1) for query index 4
Solution found by stripping colors (step -1) for query index 5
Solution found by stripping colors (step -1) for query index 6
Solution found by stripping colors (step -1) for query index 7
Solution found by stripping colors (step -1) for query index 8
Solution found by stripping colors (step -1) for query index 9
Solution found by stripping colors (step -1) for query index 10
Solution found by stripping colors (step -1) for query index 11
Solution found by stripping colors (step -1) for query index 14
Solution found by stripping colors (step -1) for query index 15
FORMULA PolyORBLF-COL-S02J04T10-ReachabilityCardinality-2025-00 TRUE TECHNIQUES COLLATERAL_PROCESSING STRUCTURAL_REDUCTION QUERY_REDUCTION SAT_SMT LP_APPROX CPN_APPROX
Query index 0 was solved
Query is satisfied.
Solved using CPN Approximation
FORMULA PolyORBLF-COL-S02J04T10-ReachabilityCardinality-2025-01 TRUE TECHNIQUES COLLATERAL_PROCESSING STRUCTURAL_REDUCTION QUERY_REDUCTION SAT_SMT LP_APPROX CPN_APPROX
Query index 1 was solved
Query is satisfied.
Solved using CPN Approximation
FORMULA PolyORBLF-COL-S02J04T10-ReachabilityCardinality-2025-02 FALSE TECHNIQUES COLLATERAL_PROCESSING STRUCTURAL_REDUCTION QUERY_REDUCTION SAT_SMT LP_APPROX CPN_APPROX
Query index 2 was solved
Query is NOT satisfied.
Solved using CPN Approximation
FORMULA PolyORBLF-COL-S02J04T10-ReachabilityCardinality-2025-03 TRUE TECHNIQUES COLLATERAL_PROCESSING STRUCTURAL_REDUCTION QUERY_REDUCTION SAT_SMT LP_APPROX CPN_APPROX
Query index 3 was solved
Query is satisfied.
Solved using CPN Approximation
FORMULA PolyORBLF-COL-S02J04T10-ReachabilityCardinality-2025-04 TRUE TECHNIQUES COLLATERAL_PROCESSING STRUCTURAL_REDUCTION QUERY_REDUCTION SAT_SMT LP_APPROX CPN_APPROX
Query index 4 was solved
Query is satisfied.
Solved using CPN Approximation
FORMULA PolyORBLF-COL-S02J04T10-ReachabilityCardinality-2025-05 TRUE TECHNIQUES COLLATERAL_PROCESSING STRUCTURAL_REDUCTION QUERY_REDUCTION SAT_SMT LP_APPROX CPN_APPROX
Query index 5 was solved
Query is satisfied.
Solved using CPN Approximation
FORMULA PolyORBLF-COL-S02J04T10-ReachabilityCardinality-2025-06 FALSE TECHNIQUES COLLATERAL_PROCESSING STRUCTURAL_REDUCTION QUERY_REDUCTION SAT_SMT LP_APPROX CPN_APPROX
Query index 6 was solved
Query is NOT satisfied.
Solved using CPN Approximation
FORMULA PolyORBLF-COL-S02J04T10-ReachabilityCardinality-2025-07 FALSE TECHNIQUES COLLATERAL_PROCESSING STRUCTURAL_REDUCTION QUERY_REDUCTION SAT_SMT LP_APPROX CPN_APPROX
Query index 7 was solved
Query is NOT satisfied.
Solved using CPN Approximation
FORMULA PolyORBLF-COL-S02J04T10-ReachabilityCardinality-2025-08 FALSE TECHNIQUES COLLATERAL_PROCESSING STRUCTURAL_REDUCTION QUERY_REDUCTION SAT_SMT LP_APPROX CPN_APPROX
Query index 8 was solved
Query is NOT satisfied.
Solved using CPN Approximation
FORMULA PolyORBLF-COL-S02J04T10-ReachabilityCardinality-2025-09 FALSE TECHNIQUES COLLATERAL_PROCESSING STRUCTURAL_REDUCTION QUERY_REDUCTION SAT_SMT LP_APPROX CPN_APPROX
Query index 9 was solved
Query is NOT satisfied.
Solved using CPN Approximation
FORMULA PolyORBLF-COL-S02J04T10-ReachabilityCardinality-2025-10 TRUE TECHNIQUES COLLATERAL_PROCESSING STRUCTURAL_REDUCTION QUERY_REDUCTION SAT_SMT LP_APPROX CPN_APPROX
Query index 10 was solved
Query is satisfied.
Solved using CPN Approximation
FORMULA PolyORBLF-COL-S02J04T10-ReachabilityCardinality-2025-11 TRUE TECHNIQUES COLLATERAL_PROCESSING STRUCTURAL_REDUCTION QUERY_REDUCTION SAT_SMT LP_APPROX CPN_APPROX
Query index 11 was solved
Query is satisfied.
Solved using CPN Approximation
FORMULA PolyORBLF-COL-S02J04T10-ReachabilityCardinality-2025-14 FALSE TECHNIQUES COLLATERAL_PROCESSING STRUCTURAL_REDUCTION QUERY_REDUCTION SAT_SMT LP_APPROX CPN_APPROX
Query index 14 was solved
Query is NOT satisfied.
Solved using CPN Approximation
FORMULA PolyORBLF-COL-S02J04T10-ReachabilityCardinality-2025-15 TRUE TECHNIQUES COLLATERAL_PROCESSING STRUCTURAL_REDUCTION QUERY_REDUCTION SAT_SMT LP_APPROX CPN_APPROX
Query index 15 was solved
Query is satisfied.
Solved using CPN Approximation
Unable to decide if PolyORBLF-COL-S02J04T10-ReachabilityCardinality-2025-12 is satisfied.
Query is MAYBE satisfied.
Unable to decide if PolyORBLF-COL-S02J04T10-ReachabilityCardinality-2025-13 is satisfied.
Query is MAYBE satisfied.
Spent 0.002873 on verification
Time left: 3590
---------------------------------------------------
Step -0.5: Explicit parallel processing
---------------------------------------------------
Doing explicit parallel verification of individual queries (2 in total)
Each query is verified by 4 parallel strategies for 119 seconds
------------------- QUERY 13 ----------------------
Parameters: -C -s RDFS --colored-successor-generator even ./model.pnml ./ReachabilityCardinality.xml -x 13
Search=RDFS,Trace=DISABLED,PrintBindings=DISABLED,State_Space_Exploration=DISABLED,Colored_Structural_Reduction=ALL,Colored_Struct_Red_Timout=30,Structural_Reduction=AGGRESSIVE,Struct_Red_Timout=60,Stubborn_Reduction=ENABLED,Query_Simplication=ENABLED,QSTimeout=30,Init_Potency=ENABLED,InitPotencyTimeout=10,Siphon_Trap=DISABLED,LPSolve_Timeout=10,ExplicitColored=ENABLED,ColoredSuccessorGenerator=EVEN
Colored structural reductions computed in 0.000414 seconds
Reduced from 81 to 80 places (1, 1.23457%)
Reduced from 65 to 64 transitions (1, 1.53846%)
Applications of rule AtomicPreAgglomeration: 1
Applications of rule DeadTransitions: 0
Applications of rule ParallelPlaces: 0
Applications of rule ParallelTransitions: 0
Applications of rule PreemptiveFiring: 0
Applications of rule RedundantPlaces: 0
Applications of rule Relevance: 0
Parameters: -C -s BFS --colored-successor-generator even -R 0 -q 0 ./model.pnml ./ReachabilityCardinality.xml -x 13
Parameters: -C -s DFS --colored-successor-generator even -q 0 ./model.pnml ./ReachabilityCardinality.xml -x 13
Search=DFS,Trace=DISABLED,PrintBindings=DISABLED,State_Space_Exploration=DISABLED,Colored_Structural_Reduction=ALL,Colored_Struct_Red_Timout=30,Structural_Reduction=AGGRESSIVE,Struct_Red_Timout=60,Stubborn_Reduction=ENABLED,Query_Simplication=DISABLED,Init_Potency=ENABLED,InitPotencyTimeout=10,Siphon_Trap=DISABLED,LPSolve_Timeout=10,ExplicitColored=ENABLED,ColoredSuccessorGenerator=EVEN
Colored structural reductions computed in 0.000474 seconds
Reduced from 81 to 80 places (1, 1.23457%)
Reduced from 65 to 64 transitions (1, 1.53846%)
Applications of rule AtomicPreAgglomeration: 1
Applications of rule DeadTransitions: 0
Applications of rule ParallelPlaces: 0
Applications of rule ParallelTransitions: 0
Applications of rule PreemptiveFiring: 0
Applications of rule RedundantPlaces: 0
Applications of rule Relevance: 0
Parameters: -C -s BestFS --colored-successor-generator fixed -q 0 ./model.pnml ./ReachabilityCardinality.xml -x 13
Query index 0 was solved
Query is NOT satisfied
STATS:
discovered states: 37
explored states: 37
peak waiting states: 36
end waiting states: 36
biggest encoded state: 162 bytes
Command exited with non-zero status 1
@@@0.01,6604@@@
Query before reduction: AG (((not (((P_2318 <= IdleTasks) or (not (ScheduleTaskE_Idle <= 41))) and (not ((SigAbort <= NotifyEventSourceAddedB) and (NotifyEventJobQueuedE <= cPollingAbort))))) and (not (((not (P_1158 <= 52)) and (not (56 <= P_1725))) or ((cJobCnt <= P_1617) and (12 <= P_1726) and (not (P_1712 <= 26))) or (PlaceSources <= 58))) and (NotifyEventJobCompletedE <= RunB)) or ((not ((not ((not (29 <= FetchJobE)) and (41 <= Try_Check_Sources_B) and (SigAbort <= Try_Check_Sources_B))) and (((P_2321 <= Insert_Source_B) and (24 <= P_1097) and (BlockedTasks <= P_1095)) or (((P_1159 <= 26) or (DisablePollingB <= Try_Check_Sources_B)) and (Try_Check_Sources_B <= P_1726))) and (36 <= ProcessingEvt) and (cBlockedTasks <= RunB))) and (Abort_Check_Sources_B <= SigAbort)) or ((not (cPollingAbort <= MarkerRead)) and (not ((not (Abort_Check_Sources_E <= 49)) and (not ((52 <= DataOnSrc) and (ORB_Lock <= AvailableJobId))) and (not ((57 <= NotifyEventEndOfCheckSourcesB) or (Check_Sources_E <= 22))))) and ((not ((MarkerRead <= 22) and (81 <= AwakeTasks))) or (Try_Check_Sources_B <= 6) or (not ((not (NotifyEventSourceAddedE <= 25)) or ((NotifyEventSourceAddedB <= 45) and (EnablePollingE <= 82))))) and (Perform_Work_E <= 0) and ((Insert_Source_E <= 43) or (Check_Sources_B <= 0) or (P_1617 <= 11) or (P_1159 <= NoSigAbort)) and (not (44 <= Check_Sources_E)) and (63 <= TryAllocateOneTaskE) and (not ((not ((not (P_1113 <= NotifyEventJobCompletedB)) or (49 <= RunE) or (P_1119 <= P_1113) or (not (35 <= P_1717)))) or (NotifyEventSourceAddedB <= Insert_Source_B)))))
RWSTATS PRE:0,1,0,0,0,0,0,0,0,0,0,0,0,0,0,0,0,0,0,0,0,0,0,0,0,0,0,0,0,0,12,0,0,0,0,
RWSTATS POST:0,1,0,0,0,0,0,0,0,0,0,0,0,0,0,0,0,0,0,0,0,0,0,0,0,0,0,0,0,0,0,0,0,0,0,
Query after reduction: (not EF (SigAbort < Abort_Check_Sources_B))
Query reduction finished after 0.015377 seconds.
Query size reduced from 191 to 5 nodes ( 97.3822 percent reduction).
Query index 0 was solved
Query is NOT satisfied
STATS:
discovered states: 36
explored states: 36
peak waiting states: 35
end waiting states: 35
biggest encoded state: 158 bytes
Command exited with non-zero status 1
@@@0.03,7736@@@
Search=HEUR,Trace=DISABLED,PrintBindings=DISABLED,State_Space_Exploration=DISABLED,Colored_Structural_Reduction=ALL,Colored_Struct_Red_Timout=30,Structural_Reduction=AGGRESSIVE,Struct_Red_Timout=60,Stubborn_Reduction=ENABLED,Query_Simplication=DISABLED,Init_Potency=ENABLED,InitPotencyTimeout=10,Siphon_Trap=DISABLED,LPSolve_Timeout=10,ExplicitColored=ENABLED,ColoredSuccessorGenerator=FIXED
Colored structural reductions computed in 0.000861 seconds
Reduced from 81 to 80 places (1, 1.23457%)
Reduced from 65 to 64 transitions (1, 1.53846%)
Applications of rule AtomicPreAgglomeration: 1
Applications of rule DeadTransitions: 0
Applications of rule ParallelPlaces: 0
Applications of rule ParallelTransitions: 0
Applications of rule PreemptiveFiring: 0
Applications of rule RedundantPlaces: 0
Applications of rule Relevance: 0
Query index 0 was solved
Query is NOT satisfied
STATS:
discovered states: 257
explored states: 252
peak waiting states: 117
end waiting states: 115
biggest encoded state: 160 bytes
Command exited with non-zero status 1
@@@0.02,6668@@@
Search=BFS,Trace=DISABLED,PrintBindings=DISABLED,State_Space_Exploration=DISABLED,Colored_Structural_Reduction=DISABLED,Colored_Struct_Red_Timout=30,Structural_Reduction=AGGRESSIVE,Struct_Red_Timout=60,Stubborn_Reduction=ENABLED,Query_Simplication=DISABLED,Init_Potency=ENABLED,InitPotencyTimeout=10,Siphon_Trap=DISABLED,LPSolve_Timeout=10,ExplicitColored=ENABLED,ColoredSuccessorGenerator=EVEN
Query index 0 was solved
Query is NOT satisfied
STATS:
discovered states: 65850
explored states: 41644
peak waiting states: 4173
end waiting states: 2286
biggest encoded state: 163 bytes
Command exited with non-zero status 1
@@@0.68,27880@@@
Solution found by explicit exploration (step -0.5)
FORMULA PolyORBLF-COL-S02J04T10-ReachabilityCardinality-2025-12 FALSE TECHNIQUES STRUCTURAL_REDUCTION CPN_EXPLICIT
Time left: 3589
------------------- QUERY 14 ----------------------
Parameters: -C -s BFS --colored-successor-generator even -R 0 -q 0 ./model.pnml ./ReachabilityCardinality.xml -x 14
Parameters: -C -s RDFS --colored-successor-generator even ./model.pnml ./ReachabilityCardinality.xml -x 14
Search=RDFS,Trace=DISABLED,PrintBindings=DISABLED,State_Space_Exploration=DISABLED,Colored_Structural_Reduction=ALL,Colored_Struct_Red_Timout=30,Structural_Reduction=AGGRESSIVE,Struct_Red_Timout=60,Stubborn_Reduction=ENABLED,Query_Simplication=ENABLED,QSTimeout=30,Init_Potency=ENABLED,InitPotencyTimeout=10,Siphon_Trap=DISABLED,LPSolve_Timeout=10,ExplicitColored=ENABLED,ColoredSuccessorGenerator=EVEN
Colored structural reductions computed in 0.000681 seconds
Reduced from 81 to 73 places (8, 9.87654%)
Reduced from 65 to 57 transitions (8, 12.3077%)
Applications of rule AtomicPreAgglomeration: 13
Applications of rule DeadTransitions: 0
Applications of rule ParallelPlaces: 0
Applications of rule ParallelTransitions: 0
Applications of rule PreemptiveFiring: 0
Applications of rule RedundantPlaces: 0
Applications of rule Relevance: 0
Parameters: -C -s DFS --colored-successor-generator even -q 0 ./model.pnml ./ReachabilityCardinality.xml -x 14
Parameters: -C -s BestFS --colored-successor-generator fixed -q 0 ./model.pnml ./ReachabilityCardinality.xml -x 14
Search=DFS,Trace=DISABLED,PrintBindings=DISABLED,State_Space_Exploration=DISABLED,Colored_Structural_Reduction=ALL,Colored_Struct_Red_Timout=30,Structural_Reduction=AGGRESSIVE,Struct_Red_Timout=60,Stubborn_Reduction=ENABLED,Query_Simplication=DISABLED,Init_Potency=ENABLED,InitPotencyTimeout=10,Siphon_Trap=DISABLED,LPSolve_Timeout=10,ExplicitColored=ENABLED,ColoredSuccessorGenerator=EVEN
Colored structural reductions computed in 0.000725 seconds
Reduced from 81 to 73 places (8, 9.87654%)
Reduced from 65 to 57 transitions (8, 12.3077%)
Applications of rule AtomicPreAgglomeration: 13
Applications of rule DeadTransitions: 0
Applications of rule ParallelPlaces: 0
Applications of rule ParallelTransitions: 0
Applications of rule PreemptiveFiring: 0
Applications of rule RedundantPlaces: 0
Applications of rule Relevance: 0
Query index 0 was solved
Query is NOT satisfied
STATS:
discovered states: 45
explored states: 45
peak waiting states: 44
end waiting states: 44
biggest encoded state: 155 bytes
Command exited with non-zero status 1
@@@0.01,6580@@@
Search=HEUR,Trace=DISABLED,PrintBindings=DISABLED,State_Space_Exploration=DISABLED,Colored_Structural_Reduction=ALL,Colored_Struct_Red_Timout=30,Structural_Reduction=AGGRESSIVE,Struct_Red_Timout=60,Stubborn_Reduction=ENABLED,Query_Simplication=DISABLED,Init_Potency=ENABLED,InitPotencyTimeout=10,Siphon_Trap=DISABLED,LPSolve_Timeout=10,ExplicitColored=ENABLED,ColoredSuccessorGenerator=FIXED
Colored structural reductions computed in 0.001394 seconds
Reduced from 81 to 73 places (8, 9.87654%)
Reduced from 65 to 57 transitions (8, 12.3077%)
Applications of rule AtomicPreAgglomeration: 13
Applications of rule DeadTransitions: 0
Applications of rule ParallelPlaces: 0
Applications of rule ParallelTransitions: 0
Applications of rule PreemptiveFiring: 0
Applications of rule RedundantPlaces: 0
Applications of rule Relevance: 0
Query before reduction: AG (((not ((not ((not (ScheduleTaskE_Check <= 2)) and (96 <= ProcessingEvt) and (Try_Check_Sources_B <= ScheduleTaskB) and (P_1119 <= 94))) and (92 <= EnablePollingE) and (ScheduleTaskB <= 98))) and (AbourtToModifySrc <= QueueJobB)) or ((NotifyEventSourceAddedE <= P_1712) and ((10 <= P_1712) or (cIsMonitoring <= 26) or (not ((not ((not (CreatedJobs <= NotifyEventSourceAddedB)) or (NotifyEventJobCompletedB <= P_1099))) and (not ((61 <= NotifyEventJobCompletedB) and (NotifyEventSourceAddedE <= JobCnt))))))))
RWSTATS PRE:0,1,0,0,0,0,0,0,0,0,0,0,0,0,0,0,0,0,0,0,0,0,0,0,0,0,0,0,0,0,4,0,0,0,0,
RWSTATS POST:0,1,0,0,0,0,0,0,0,0,0,0,0,0,0,0,0,0,0,0,0,0,0,0,0,0,0,0,0,0,0,0,0,0,0,
Query after reduction: (not EF ((QueueJobB < AbourtToModifySrc) and (P_1712 < NotifyEventSourceAddedE)))
Query reduction finished after 0.01485 seconds.
Query size reduced from 59 to 9 nodes ( 84.7458 percent reduction).
Query index 0 was solved
Query is NOT satisfied
STATS:
discovered states: 62
explored states: 62
peak waiting states: 61
end waiting states: 61
biggest encoded state: 151 bytes
Command exited with non-zero status 1
@@@0.03,7700@@@
Search=BFS,Trace=DISABLED,PrintBindings=DISABLED,State_Space_Exploration=DISABLED,Colored_Structural_Reduction=DISABLED,Colored_Struct_Red_Timout=30,Structural_Reduction=AGGRESSIVE,Struct_Red_Timout=60,Stubborn_Reduction=ENABLED,Query_Simplication=DISABLED,Init_Potency=ENABLED,InitPotencyTimeout=10,Siphon_Trap=DISABLED,LPSolve_Timeout=10,ExplicitColored=ENABLED,ColoredSuccessorGenerator=EVEN
Query index 0 was solved
Query is NOT satisfied
STATS:
discovered states: 143317
explored states: 102254
peak waiting states: 5095
end waiting states: 1683
biggest encoded state: 163 bytes
Command exited with non-zero status 1
@@@1.55,42936@@@
Query index 0 was solved
Query is NOT satisfied
STATS:
discovered states: 3577798
explored states: 2688865
peak waiting states: 115379
end waiting states: 115339
biggest encoded state: 162 bytes
Command exited with non-zero status 1
@@@41.38,1513140@@@
Solution found by explicit exploration (step -0.5)
FORMULA PolyORBLF-COL-S02J04T10-ReachabilityCardinality-2025-13 FALSE TECHNIQUES STRUCTURAL_REDUCTION CPN_EXPLICIT
Time left: 3547
All queries are solved in step -0.5
Time left: 3547
terminated-with-cleanup
BK_STOP 1748901695236
--------------------
content from stderr:
Sequence of Actions to be Executed by the VM
This is useful if one wants to reexecute the tool in the VM from the submitted image disk.
set -x
# this is for BenchKit: configuration of major elements for the test
export BK_INPUT="PolyORBLF-COL-S02J04T10"
export BK_EXAMINATION="ReachabilityCardinality"
export BK_TOOL="tapaal"
export BK_RESULT_DIR="/tmp/BK_RESULTS/OUTPUTS"
export BK_TIME_CONFINEMENT="3600"
export BK_MEMORY_CONFINEMENT="16384"
export BK_BIN_PATH="/home/mcc/BenchKit/bin/"
# this is specific to your benchmark or test
export BIN_DIR="$HOME/BenchKit/bin"
# remove the execution directoty if it exists (to avoid increse of .vmdk images)
if [ -d execution ] ; then
rm -rf execution
fi
# this is for BenchKit: explicit launching of the test
echo "====================================================================="
echo " Generated by BenchKit 2-5832"
echo " Executing tool tapaal"
echo " Input is PolyORBLF-COL-S02J04T10, examination is ReachabilityCardinality"
echo " Time confinement is $BK_TIME_CONFINEMENT seconds"
echo " Memory confinement is 16384 MBytes"
echo " Number of cores is 4"
echo " Run identifier is r158-tall-174881256900286"
echo "====================================================================="
echo
echo "--------------------"
echo "preparation of the directory to be used:"
tar xzf /home/mcc/BenchKit/INPUTS/PolyORBLF-COL-S02J04T10.tgz
mv PolyORBLF-COL-S02J04T10 execution
cd execution
if [ "ReachabilityCardinality" = "ReachabilityDeadlock" ] || [ "ReachabilityCardinality" = "UpperBounds" ] || [ "ReachabilityCardinality" = "QuasiLiveness" ] || [ "ReachabilityCardinality" = "StableMarking" ] || [ "ReachabilityCardinality" = "Liveness" ] || [ "ReachabilityCardinality" = "OneSafe" ] || [ "ReachabilityCardinality" = "StateSpace" ]; then
rm -f GenericPropertiesVerdict.xml
fi
pwd
ls -lh
echo
echo "--------------------"
echo "content from stdout:"
echo
echo "=== Data for post analysis generated by BenchKit (invocation template)"
echo
if [ "ReachabilityCardinality" = "UpperBounds" ] ; then
echo "The expected result is a vector of positive values"
echo NUM_VECTOR
elif [ "ReachabilityCardinality" != "StateSpace" ] ; then
echo "The expected result is a vector of booleans"
echo BOOL_VECTOR
else
echo "no data necessary for post analysis"
fi
echo
if [ -f "ReachabilityCardinality.xml" ] ; then # for cunf (txt files deleted;-)
echo echo "here is the order used to build the result vector(from xml file)"
for x in $(grep '
echo "FORMULA_NAME $x"
done
elif [ "ReachabilityCardinality" = "ReachabilityDeadlock" ] || [ "ReachabilityCardinality" = "QuasiLiveness" ] || [ "ReachabilityCardinality" = "StableMarking" ] || [ "ReachabilityCardinality" = "Liveness" ] || [ "ReachabilityCardinality" = "OneSafe" ] ; then
echo "FORMULA_NAME ReachabilityCardinality"
fi
echo
echo "=== Now, execution of the tool begins"
echo
echo -n "BK_START "
date -u +%s%3N
echo
timeout -s 9 $BK_TIME_CONFINEMENT bash -c "/home/mcc/BenchKit/BenchKit_head.sh 2> STDERR ; echo ; echo -n \"BK_STOP \" ; date -u +%s%3N"
if [ $? -eq 137 ] ; then
echo
echo "BK_TIME_CONFINEMENT_REACHED"
fi
echo
echo "--------------------"
echo "content from stderr:"
echo
cat STDERR ;