

About the Execution of Tapaal for PGCD-COL-D02N100
| Execution Summary | |||||
| Max Memory Used (MB) |
Time wait (ms) | CPU Usage (ms) | I/O Wait (ms) | Computed Result | Execution Status |
| 15712.240 | 3592516.00 | 6753351.00 | 16734.50 | FTFFFFFTFFTTFTT? | normal |
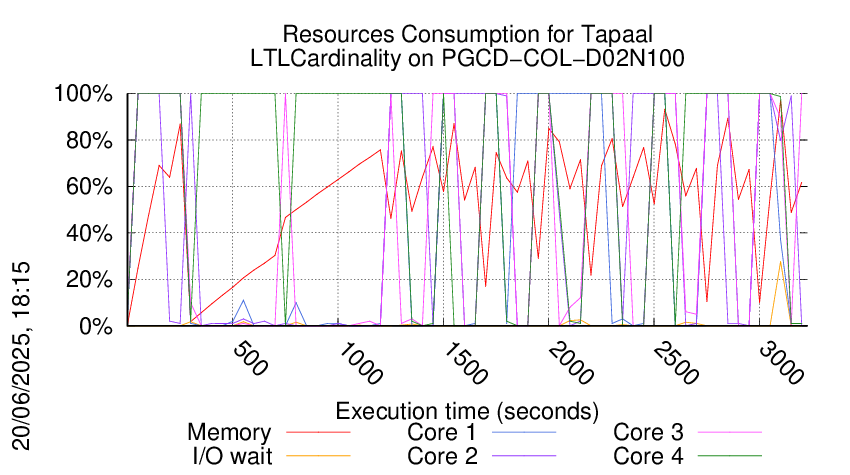
Execution Chart
We display below the execution chart for this examination (boot time has been removed).
Trace from the execution
Formatting '/data/fkordon/mcc2025-input.r144-tall-174876816200659.qcow2', fmt=qcow2 size=4294967296 backing_file=/data/fkordon/mcc2025-input.qcow2 backing_fmt=qcow2 cluster_size=65536 lazy_refcounts=off refcount_bits=16
Waiting for the VM to be ready (probing ssh)
..........................................................................................................................................................................................................................................................................................................................................................................................................................................................................................................................................................................................................................................................................................................................................................................................................................................................................................................................................................................................................................................................................................................................................................................................................................................................................................................................................................................................................................................................................................................................................................................................................................................................................
=====================================================================
Generated by BenchKit 2-5832
Executing tool tapaal
Input is PGCD-COL-D02N100, examination is LTLCardinality
Time confinement is 3600 seconds
Memory confinement is 16384 MBytes
Number of cores is 4
Run identifier is r144-tall-174876816200659
=====================================================================
--------------------
preparation of the directory to be used:
/home/mcc/execution
total 424K
-rw-r--r-- 1 mcc users 6.7K May 29 14:47 CTLCardinality.txt
-rw-r--r-- 1 mcc users 74K May 29 14:47 CTLCardinality.xml
-rw-r--r-- 1 mcc users 5.8K May 29 14:47 CTLFireability.txt
-rw-r--r-- 1 mcc users 59K May 29 14:47 CTLFireability.xml
-rw-r--r-- 1 mcc users 3.4K May 29 14:47 LTLCardinality.txt
-rw-r--r-- 1 mcc users 25K May 29 14:47 LTLCardinality.xml
-rw-r--r-- 1 mcc users 2.1K May 29 14:47 LTLFireability.txt
-rw-r--r-- 1 mcc users 19K May 29 14:47 LTLFireability.xml
-rw-r--r-- 1 mcc users 7.3K May 29 14:47 ReachabilityCardinality.txt
-rw-r--r-- 1 mcc users 73K May 29 14:47 ReachabilityCardinality.xml
-rw-r--r-- 1 mcc users 8.7K May 29 14:47 ReachabilityFireability.txt
-rw-r--r-- 1 mcc users 85K May 29 14:47 ReachabilityFireability.xml
-rw-r--r-- 1 mcc users 1.6K May 29 14:47 UpperBounds.txt
-rw-r--r-- 1 mcc users 3.6K May 29 14:47 UpperBounds.xml
-rw-r--r-- 1 mcc users 5 May 29 14:32 equiv_pt
-rw-r--r-- 1 mcc users 8 May 29 14:32 instance
-rw-r--r-- 1 mcc users 5 May 29 14:32 iscolored
-rw-r--r-- 1 mcc users 11K May 29 14:32 model.pnml
--------------------
content from stdout:
=== Data for post analysis generated by BenchKit (invocation template)
The expected result is a vector of booleans
BOOL_VECTOR
echo here is the order used to build the result vector(from xml file)
FORMULA_NAME PGCD-COL-D02N100-LTLCardinality-00
FORMULA_NAME PGCD-COL-D02N100-LTLCardinality-01
FORMULA_NAME PGCD-COL-D02N100-LTLCardinality-02
FORMULA_NAME PGCD-COL-D02N100-LTLCardinality-03
FORMULA_NAME PGCD-COL-D02N100-LTLCardinality-04
FORMULA_NAME PGCD-COL-D02N100-LTLCardinality-05
FORMULA_NAME PGCD-COL-D02N100-LTLCardinality-06
FORMULA_NAME PGCD-COL-D02N100-LTLCardinality-07
FORMULA_NAME PGCD-COL-D02N100-LTLCardinality-08
FORMULA_NAME PGCD-COL-D02N100-LTLCardinality-09
FORMULA_NAME PGCD-COL-D02N100-LTLCardinality-10
FORMULA_NAME PGCD-COL-D02N100-LTLCardinality-11
FORMULA_NAME PGCD-COL-D02N100-LTLCardinality-12
FORMULA_NAME PGCD-COL-D02N100-LTLCardinality-13
FORMULA_NAME PGCD-COL-D02N100-LTLCardinality-14
FORMULA_NAME PGCD-COL-D02N100-LTLCardinality-15
=== Now, execution of the tool begins
BK_START 1748917185921
tapaal
Got BK_BIN_PATH=/home/mcc/BenchKit/bin/
---> tapaal --- TAPAAL 2025-v2
Setting MODEL_PATH=.
Setting VERIFYPN=/home/mcc/BenchKit/bin/verifypn
Got BK_TIME_CONFINEMENT=3600
Setting TEMPDIR=/home/mcc/BenchKit/bin/tmp
Got BK_MEMORY_CONFINEMENT=16384
Limiting to 16265216 kB
Total timeout: 3590
Time left: 3590
*************************************
* TAPAAL verifying LTLCardinality *
*************************************
TEMPDIR=/home/mcc/BenchKit/bin/tmp
QF=/home/mcc/BenchKit/bin/tmp/tmp.IFQSTbvu9R
MF=/home/mcc/BenchKit/bin/tmp/tmp.vqugPfOuBP
Time left: 3589
---------------------------------------------------
Step -1: Stripping Colors
---------------------------------------------------
Verifying stripped models (16 in total)
Time left: 3589
---------------------------------------------------
Step 0: Parallel Simplification
---------------------------------------------------
Doing parallel simplification (16 in total)
Total simplification timout is 718 -- reduction timeout is 299
timeout 1017 /home/mcc/BenchKit/bin/verifypn -n -ltl -q 718 -l 29 -d 299 -z 4 -s OverApprox --binary-query-io 2 --write-simplified /home/mcc/BenchKit/bin/tmp/tmp.IFQSTbvu9R --write-reduced /home/mcc/BenchKit/bin/tmp/tmp.vqugPfOuBP -x 1,2,3,4,5,6,7,8,9,10,11,12,13,14,15,16 ./model.pnml ./LTLCardinality.xml
FORMULA PGCD-COL-D02N100-LTLCardinality-01 TRUE TECHNIQUES COLLATERAL_PROCESSING STRUCTURAL_REDUCTION QUERY_REDUCTION SAT_SMT LP_APPROX UNFOLDING_TO_PT
Query index 1 was solved
Query is satisfied.
FORMULA PGCD-COL-D02N100-LTLCardinality-03 FALSE TECHNIQUES COLLATERAL_PROCESSING STRUCTURAL_REDUCTION QUERY_REDUCTION SAT_SMT LP_APPROX UNFOLDING_TO_PT
Query index 3 was solved
Query is NOT satisfied.
FORMULA PGCD-COL-D02N100-LTLCardinality-07 TRUE TECHNIQUES COLLATERAL_PROCESSING STRUCTURAL_REDUCTION QUERY_REDUCTION SAT_SMT LP_APPROX UNFOLDING_TO_PT
Query index 7 was solved
Query is satisfied.
FORMULA PGCD-COL-D02N100-LTLCardinality-08 FALSE TECHNIQUES COLLATERAL_PROCESSING STRUCTURAL_REDUCTION QUERY_REDUCTION SAT_SMT LP_APPROX UNFOLDING_TO_PT
Query index 8 was solved
Query is NOT satisfied.
FORMULA PGCD-COL-D02N100-LTLCardinality-10 TRUE TECHNIQUES COLLATERAL_PROCESSING STRUCTURAL_REDUCTION QUERY_REDUCTION SAT_SMT LP_APPROX UNFOLDING_TO_PT
Query index 10 was solved
Query is satisfied.
FORMULA PGCD-COL-D02N100-LTLCardinality-11 TRUE TECHNIQUES COLLATERAL_PROCESSING STRUCTURAL_REDUCTION QUERY_REDUCTION SAT_SMT LP_APPROX UNFOLDING_TO_PT
Query index 11 was solved
Query is satisfied.
Solution found by parallel simplification (step 0)
Solution found by parallel simplification (step 0)
Solution found by parallel simplification (step 0)
Solution found by parallel simplification (step 0)
Solution found by parallel simplification (step 0)
Solution found by parallel simplification (step 0)
Time left: 3584
---------------------------------------------------
Step 1: Parallel processing
---------------------------------------------------
Doing parallel verification of individual queries (10 in total)
Each query is verified by 4 parallel strategies for 299 seconds
------------------- QUERY 1 ----------------------
Solution found by parallel processing (step 1)
Query index 0 was solved
Query is NOT satisfied.
Spent 0.084332 on verification
@@@0.08,147156@@@
FORMULA PGCD-COL-D02N100-LTLCardinality-00 FALSE TECHNIQUES EXPLICIT TARJAN WEAK_SKIP OPTIM-1
Query index 0 was solved
Query is NOT satisfied.
Spent 0.079687 on verification
parallel: This job succeeded:
eval /usr/bin/time -f "@@@%e,%M@@@" /home/mcc/BenchKit/bin/verifypn -n '-ltl tarjan --ltl-heur dist -q 0 -l 0 -d 119' /home/mcc/BenchKit/bin/tmp/tmp.vqugPfOuBP /home/mcc/BenchKit/bin/tmp/tmp.IFQSTbvu9R --binary-query-io 1 -x 1 -n
FORMULA PGCD-COL-D02N100-LTLCardinality-00 FALSE TECHNIQUES EXPLICIT TARJAN WEAK_SKIP STUBBORN AUT_STUB HEURISTIC DIST_HEUR OPTIM-1
Time left: 3584
------------------- QUERY 2 ----------------------
Solution found by parallel processing (step 1)
Query index 0 was solved
Query is NOT satisfied.
Spent 0.052371 on verification
@@@0.05,147316@@@
parallel: This job succeeded:
eval /usr/bin/time -f "@@@%e,%M@@@" /home/mcc/BenchKit/bin/verifypn -n '-ltl tarjan --ltl-heur fire-count -q 0 -l 0 -d 119' /home/mcc/BenchKit/bin/tmp/tmp.vqugPfOuBP /home/mcc/BenchKit/bin/tmp/tmp.IFQSTbvu9R --binary-query-io 1 -x 2 -n
FORMULA PGCD-COL-D02N100-LTLCardinality-09 FALSE TECHNIQUES EXPLICIT TARJAN WEAK_SKIP STUBBORN AUT_STUB HEURISTIC LOGFIRECOUNT_HEUR(5000) OPTIM-1
Time left: 3584
------------------- QUERY 3 ----------------------
Solution found by parallel processing (step 1)
Query index 0 was solved
Query is NOT satisfied.
Spent 0.093093 on verification
@@@0.11,149740@@@
parallel: This job succeeded:
eval /usr/bin/time -f "@@@%e,%M@@@" /home/mcc/BenchKit/bin/verifypn -n '-ltl tarjan --ltl-heur aut -s DFS -p -q 0 -l 0 -d 119' /home/mcc/BenchKit/bin/tmp/tmp.vqugPfOuBP /home/mcc/BenchKit/bin/tmp/tmp.IFQSTbvu9R --binary-query-io 1 -x 3 -n
FORMULA PGCD-COL-D02N100-LTLCardinality-04 FALSE TECHNIQUES EXPLICIT TARJAN WEAK_SKIP OPTIM-1
Time left: 3583
------------------- QUERY 4 ----------------------
No solution found
Command terminated by signal 9
@@@189.92,6466364@@@
Command terminated by signal 9
@@@302.99,9024660@@@
parallel: Warning: This job was killed because it timed out:
parallel: Warning: eval /usr/bin/time -f "@@@%e,%M@@@" /home/mcc/BenchKit/bin/verifypn -n '-ltl tarjan --ltl-heur dist -q 0 -l 0 -d 119' /home/mcc/BenchKit/bin/tmp/tmp.vqugPfOuBP /home/mcc/BenchKit/bin/tmp/tmp.IFQSTbvu9R --binary-query-io 1 -x 4 -n
parallel: Warning: This job was killed because it timed out:
parallel: Warning: eval /usr/bin/time -f "@@@%e,%M@@@" /home/mcc/BenchKit/bin/verifypn -n '-ltl ndfs -q 0 -l 0 -d 119' /home/mcc/BenchKit/bin/tmp/tmp.vqugPfOuBP /home/mcc/BenchKit/bin/tmp/tmp.IFQSTbvu9R --binary-query-io 1 -x 4 -n
Time left: 3279
------------------- QUERY 5 ----------------------
Solution found by parallel processing (step 1)
Query index 0 was solved
Query is satisfied.
Spent 0.010734 on verification
@@@0.02,19024@@@
parallel: This job succeeded:
eval /usr/bin/time -f "@@@%e,%M@@@" /home/mcc/BenchKit/bin/verifypn -n '-ltl ndfs -q 0 -l 0 -d 119' /home/mcc/BenchKit/bin/tmp/tmp.vqugPfOuBP /home/mcc/BenchKit/bin/tmp/tmp.IFQSTbvu9R --binary-query-io 1 -x 5 -n
FORMULA PGCD-COL-D02N100-LTLCardinality-14 TRUE TECHNIQUES EXPLICIT NDFS WEAK_SKIP HEURISTIC AUTOMATON_HEUR OPTIM-1
Time left: 3279
------------------- QUERY 6 ----------------------
Solution found by parallel processing (step 1)
Query index 0 was solved
Query is satisfied.
Spent 0.012035 on verification
@@@0.02,19276@@@
parallel: This job succeeded:
eval /usr/bin/time -f "@@@%e,%M@@@" /home/mcc/BenchKit/bin/verifypn -n '-ltl ndfs -q 0 -l 0 -d 119' /home/mcc/BenchKit/bin/tmp/tmp.vqugPfOuBP /home/mcc/BenchKit/bin/tmp/tmp.IFQSTbvu9R --binary-query-io 1 -x 6 -n
FORMULA PGCD-COL-D02N100-LTLCardinality-13 TRUE TECHNIQUES EXPLICIT NDFS WEAK_SKIP HEURISTIC AUTOMATON_HEUR OPTIM-1
Time left: 3279
------------------- QUERY 7 ----------------------
Solution found by parallel processing (step 1)
Query index 0 was solved
Query is NOT satisfied.
Spent 0.013819 on verification
@@@0.01,18940@@@
parallel: This job succeeded:
eval /usr/bin/time -f "@@@%e,%M@@@" /home/mcc/BenchKit/bin/verifypn -n '-ltl ndfs -q 0 -l 0 -d 119' /home/mcc/BenchKit/bin/tmp/tmp.vqugPfOuBP /home/mcc/BenchKit/bin/tmp/tmp.IFQSTbvu9R --binary-query-io 1 -x 7 -n
FORMULA PGCD-COL-D02N100-LTLCardinality-02 FALSE TECHNIQUES EXPLICIT NDFS WEAK_SKIP HEURISTIC AUTOMATON_HEUR OPTIM-1
Time left: 3279
------------------- QUERY 8 ----------------------
Solution found by parallel processing (step 1)
Query index 0 was solved
Query is NOT satisfied.
Spent 0.054659 on verification
@@@0.06,147384@@@
parallel: This job succeeded:
eval /usr/bin/time -f "@@@%e,%M@@@" /home/mcc/BenchKit/bin/verifypn -n '-ltl tarjan --ltl-heur dist -q 0 -l 0 -d 119' /home/mcc/BenchKit/bin/tmp/tmp.vqugPfOuBP /home/mcc/BenchKit/bin/tmp/tmp.IFQSTbvu9R --binary-query-io 1 -x 8 -n
FORMULA PGCD-COL-D02N100-LTLCardinality-06 FALSE TECHNIQUES EXPLICIT TARJAN WEAK_SKIP STUBBORN AUT_STUB HEURISTIC DIST_HEUR OPTIM-1
Time left: 3278
------------------- QUERY 9 ----------------------
Solution found by parallel processing (step 1)
Query index 0 was solved
Query is NOT satisfied.
Spent 0.013414 on verification
@@@0.01,19032@@@
parallel: This job succeeded:
eval /usr/bin/time -f "@@@%e,%M@@@" /home/mcc/BenchKit/bin/verifypn -n '-ltl ndfs -q 0 -l 0 -d 119' /home/mcc/BenchKit/bin/tmp/tmp.vqugPfOuBP /home/mcc/BenchKit/bin/tmp/tmp.IFQSTbvu9R --binary-query-io 1 -x 9 -n
FORMULA PGCD-COL-D02N100-LTLCardinality-12 FALSE TECHNIQUES EXPLICIT NDFS WEAK_SKIP HEURISTIC AUTOMATON_HEUR OPTIM-1
Time left: 3278
------------------- QUERY 10 ----------------------
Solution found by parallel processing (step 1)
Query index 0 was solved
Query is NOT satisfied.
Spent 0.035812 on verification
@@@0.03,21796@@@
parallel: This job succeeded:
eval /usr/bin/time -f "@@@%e,%M@@@" /home/mcc/BenchKit/bin/verifypn -n '-ltl ndfs -q 0 -l 0 -d 119' /home/mcc/BenchKit/bin/tmp/tmp.vqugPfOuBP /home/mcc/BenchKit/bin/tmp/tmp.IFQSTbvu9R --binary-query-io 1 -x 10 -n
FORMULA PGCD-COL-D02N100-LTLCardinality-05 FALSE TECHNIQUES EXPLICIT NDFS WEAK_SKIP HEURISTIC AUTOMATON_HEUR OPTIM-1
Time left: 3278
---------------------------------------------------
Step 2: Sequential processing
---------------------------------------------------
Remaining 1 queries are verified sequentially.
Each query is verified for a dynamic timeout (at least 512 seconds)
Time left: 3278
------------------- QUERY 4 ----------------------
Running query 4 for 3278 seconds. Remaining: 1 queries and 3278 seconds
No solution found
terminate called after throwing an instance of 'std::bad_alloc'
what(): std::bad_alloc
Command terminated by signal 6
@@@915.52,12430948@@@
Time left: 2362
Time left: 2362
---------------------------------------------------
Step 4: Random Parallel processing
---------------------------------------------------
Doing random parallel verification of individual queries (1 in total)
Each query is verified by 4 parallel strategies for 2362 seconds
------------------- QUERY 4 ----------------------
No solution found
Command terminated by signal 9
@@@199.34,4316392@@@
Command terminated by signal 9
@@@236.19,5883176@@@
Command terminated by signal 9
@@@248.01,8608304@@@
terminate called after throwing an instance of 'std::bad_alloc'
what(): std::bad_alloc
Command terminated by signal 6
@@@365.80,12712236@@@
Time left: 1996
Time left: 1996
---------------------------------------------------
Step 4: Random Parallel processing
---------------------------------------------------
Doing random parallel verification of individual queries (1 in total)
Each query is verified by 4 parallel strategies for 1996 seconds
------------------- QUERY 4 ----------------------
No solution found
Command terminated by signal 9
@@@76.43,4156428@@@
Command terminated by signal 9
@@@108.05,5558612@@@
Command terminated by signal 9
@@@118.11,8604408@@@
terminate called after throwing an instance of 'std::bad_alloc'
what(): std::bad_alloc
Command terminated by signal 6
@@@232.30,12714364@@@
Time left: 1763
Time left: 1763
---------------------------------------------------
Step 4: Random Parallel processing
---------------------------------------------------
Doing random parallel verification of individual queries (1 in total)
Each query is verified by 4 parallel strategies for 1763 seconds
------------------- QUERY 4 ----------------------
No solution found
Command terminated by signal 9
@@@84.01,4159088@@@
Command terminated by signal 9
@@@109.91,6008716@@@
Command terminated by signal 9
@@@123.31,8674744@@@
terminate called after throwing an instance of 'std::bad_alloc'
what(): std::bad_alloc
Command terminated by signal 6
@@@242.02,12714512@@@
Time left: 1521
Time left: 1521
---------------------------------------------------
Step 4: Random Parallel processing
---------------------------------------------------
Doing random parallel verification of individual queries (1 in total)
Each query is verified by 4 parallel strategies for 1521 seconds
------------------- QUERY 4 ----------------------
No solution found
Command terminated by signal 9
@@@87.01,4120904@@@
Command terminated by signal 9
@@@147.06,5543992@@@
Command terminated by signal 9
@@@161.31,8405540@@@
terminate called after throwing an instance of 'std::bad_alloc'
what(): std::bad_alloc
Command terminated by signal 6
@@@284.10,12712192@@@
Time left: 1237
Time left: 1237
---------------------------------------------------
Step 4: Random Parallel processing
---------------------------------------------------
Doing random parallel verification of individual queries (1 in total)
Each query is verified by 4 parallel strategies for 1237 seconds
------------------- QUERY 4 ----------------------
No solution found
Command terminated by signal 9
@@@110.62,4651520@@@
Command terminated by signal 9
@@@210.81,6038532@@@
Command terminated by signal 9
@@@232.32,8180896@@@
terminate called after throwing an instance of 'std::bad_alloc'
what(): std::bad_alloc
Command terminated by signal 6
@@@350.38,12713256@@@
Time left: 886
Time left: 886
---------------------------------------------------
Step 4: Random Parallel processing
---------------------------------------------------
Doing random parallel verification of individual queries (1 in total)
Each query is verified by 4 parallel strategies for 886 seconds
------------------- QUERY 4 ----------------------
No solution found
Command terminated by signal 9
@@@100.13,4374936@@@
Command terminated by signal 9
@@@141.35,5953168@@@
Command terminated by signal 9
@@@166.30,9137056@@@
terminate called after throwing an instance of 'std::bad_alloc'
what(): std::bad_alloc
Command terminated by signal 6
@@@298.29,12713280@@@
Time left: 587
Time left: 587
---------------------------------------------------
Step 4: Random Parallel processing
---------------------------------------------------
Doing random parallel verification of individual queries (1 in total)
Each query is verified by 4 parallel strategies for 587 seconds
------------------- QUERY 4 ----------------------
No solution found
Command terminated by signal 9
@@@94.08,4080796@@@
Command terminated by signal 9
@@@123.06,5715500@@@
Command terminated by signal 9
@@@134.19,8606308@@@
terminate called after throwing an instance of 'std::bad_alloc'
what(): std::bad_alloc
Command terminated by signal 6
@@@260.15,12713980@@@
Time left: 327
Time left: 327
---------------------------------------------------
Step 4: Random Parallel processing
---------------------------------------------------
Doing random parallel verification of individual queries (1 in total)
Each query is verified by 4 parallel strategies for 327 seconds
------------------- QUERY 4 ----------------------
No solution found
Command terminated by signal 9
@@@203.47,4269796@@@
Command terminated by signal 9
@@@234.20,5605052@@@
Command terminated by signal 9
@@@243.88,8759612@@@
parallel: Warning: This job was killed because it timed out:
parallel: Warning: eval /usr/bin/time -f "@@@%e,%M@@@" /home/mcc/BenchKit/bin/verifypn -n '-ltl tarjan -s RDFS --seed-offset 9220 -p -q 0 -l 0 -d 119' /home/mcc/BenchKit/bin/tmp/tmp.vqugPfOuBP /home/mcc/BenchKit/bin/tmp/tmp.IFQSTbvu9R --binary-query-io 1 -x 4 -n
Time left: -3
Out of time, terminating!
terminated-with-cleanup
BK_STOP 1748920778437
--------------------
content from stderr:
ERROR: A query could not be translated from CTL* to CTL.
Sequence of Actions to be Executed by the VM
This is useful if one wants to reexecute the tool in the VM from the submitted image disk.
set -x
# this is for BenchKit: configuration of major elements for the test
export BK_INPUT="PGCD-COL-D02N100"
export BK_EXAMINATION="LTLCardinality"
export BK_TOOL="tapaal"
export BK_RESULT_DIR="/tmp/BK_RESULTS/OUTPUTS"
export BK_TIME_CONFINEMENT="3600"
export BK_MEMORY_CONFINEMENT="16384"
export BK_BIN_PATH="/home/mcc/BenchKit/bin/"
# this is specific to your benchmark or test
export BIN_DIR="$HOME/BenchKit/bin"
# remove the execution directoty if it exists (to avoid increse of .vmdk images)
if [ -d execution ] ; then
rm -rf execution
fi
# this is for BenchKit: explicit launching of the test
echo "====================================================================="
echo " Generated by BenchKit 2-5832"
echo " Executing tool tapaal"
echo " Input is PGCD-COL-D02N100, examination is LTLCardinality"
echo " Time confinement is $BK_TIME_CONFINEMENT seconds"
echo " Memory confinement is 16384 MBytes"
echo " Number of cores is 4"
echo " Run identifier is r144-tall-174876816200659"
echo "====================================================================="
echo
echo "--------------------"
echo "preparation of the directory to be used:"
tar xzf /home/mcc/BenchKit/INPUTS/PGCD-COL-D02N100.tgz
mv PGCD-COL-D02N100 execution
cd execution
if [ "LTLCardinality" = "ReachabilityDeadlock" ] || [ "LTLCardinality" = "UpperBounds" ] || [ "LTLCardinality" = "QuasiLiveness" ] || [ "LTLCardinality" = "StableMarking" ] || [ "LTLCardinality" = "Liveness" ] || [ "LTLCardinality" = "OneSafe" ] || [ "LTLCardinality" = "StateSpace" ]; then
rm -f GenericPropertiesVerdict.xml
fi
pwd
ls -lh
echo
echo "--------------------"
echo "content from stdout:"
echo
echo "=== Data for post analysis generated by BenchKit (invocation template)"
echo
if [ "LTLCardinality" = "UpperBounds" ] ; then
echo "The expected result is a vector of positive values"
echo NUM_VECTOR
elif [ "LTLCardinality" != "StateSpace" ] ; then
echo "The expected result is a vector of booleans"
echo BOOL_VECTOR
else
echo "no data necessary for post analysis"
fi
echo
if [ -f "LTLCardinality.xml" ] ; then # for cunf (txt files deleted;-)
echo echo "here is the order used to build the result vector(from xml file)"
for x in $(grep '
echo "FORMULA_NAME $x"
done
elif [ "LTLCardinality" = "ReachabilityDeadlock" ] || [ "LTLCardinality" = "QuasiLiveness" ] || [ "LTLCardinality" = "StableMarking" ] || [ "LTLCardinality" = "Liveness" ] || [ "LTLCardinality" = "OneSafe" ] ; then
echo "FORMULA_NAME LTLCardinality"
fi
echo
echo "=== Now, execution of the tool begins"
echo
echo -n "BK_START "
date -u +%s%3N
echo
timeout -s 9 $BK_TIME_CONFINEMENT bash -c "/home/mcc/BenchKit/BenchKit_head.sh 2> STDERR ; echo ; echo -n \"BK_STOP \" ; date -u +%s%3N"
if [ $? -eq 137 ] ; then
echo
echo "BK_TIME_CONFINEMENT_REACHED"
fi
echo
echo "--------------------"
echo "content from stderr:"
echo
cat STDERR ;