

About the Execution of 2024-gold for JoinFreeModules-PT-0100
| Execution Summary | |||||
| Max Memory Used (MB) |
Time wait (ms) | CPU Usage (ms) | I/O Wait (ms) | Computed Result | Execution Status |
| 15728.830 | 3592245.00 | 6214214.00 | 10613.30 | ?FFTFFFFFFFFFFF? | normal |
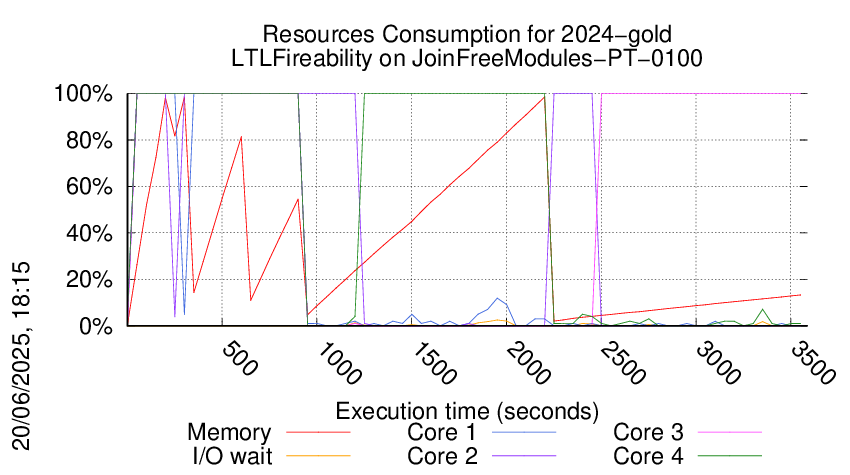
Execution Chart
We display below the execution chart for this examination (boot time has been removed).
Trace from the execution
Formatting '/data/fkordon/mcc2025-input.r124-tall-174876435000334.qcow2', fmt=qcow2 size=4294967296 backing_file=/data/fkordon/mcc2025-input.qcow2 backing_fmt=qcow2 cluster_size=65536 lazy_refcounts=off refcount_bits=16
Waiting for the VM to be ready (probing ssh)
.....................................................................................................................................................................................................................................................................................................................................................................................................................................................................................................................................................................................................................................................................................................................................................................................................................................................................................................................................................................................................................................................................................................................................................................................................................................................................................................................................................................................................................................................................................................................................................................................................................................................................................................................................................................................................................................................................................................................................................................................................................................................................................................................................................................................................................................................................................................................................................................................................................................................................................................................................................................................................................................................................................................................................................................................................................................................................................................................................................................................................................................................................................................................................................................................................................................................................................................................................................................................................................................................................................................................................................................................................................................................................................................................................................................................................................................................................................................................................................................................................................................................................................................................................................................................................................................................................................................................................................................................................................................................................................................................................................................................................................................................................................................................................................................................................................................................................................................................................................................................................................................................................................................................................................................................................................................................................................................................................................................................................................................................................................................................................................................................................................................................................................................................................................................................................................................................................................................................................................................................................................................................................................................................................................................................................................................................................................................................................................................................................................................................................................................................................................................................................................................................................................................................................................................................................................................................................................................................................................................................................................................................................................................................................................................................................................................................................................................................................................................................................................................................
=====================================================================
Generated by BenchKit 2-5832
Executing tool gold2024
Input is JoinFreeModules-PT-0100, examination is LTLFireability
Time confinement is 3600 seconds
Memory confinement is 16384 MBytes
Number of cores is 4
Run identifier is r124-tall-174876435000334
=====================================================================
--------------------
preparation of the directory to be used:
/home/mcc/execution
total 740K
-rw-r--r-- 1 mcc users 5.7K May 29 14:47 CTLCardinality.txt
-rw-r--r-- 1 mcc users 52K May 29 14:47 CTLCardinality.xml
-rw-r--r-- 1 mcc users 5.1K May 29 14:47 CTLFireability.txt
-rw-r--r-- 1 mcc users 43K May 29 14:47 CTLFireability.xml
-rw-r--r-- 1 mcc users 4.2K May 29 14:32 GenericPropertiesDefinition.xml
-rw-r--r-- 1 mcc users 6.1K May 29 14:32 GenericPropertiesVerdict.xml
-rw-r--r-- 1 mcc users 3.7K May 29 14:47 LTLCardinality.txt
-rw-r--r-- 1 mcc users 27K May 29 14:47 LTLCardinality.xml
-rw-r--r-- 1 mcc users 2.3K May 29 14:47 LTLFireability.txt
-rw-r--r-- 1 mcc users 18K May 29 14:47 LTLFireability.xml
-rw-r--r-- 1 mcc users 11K May 29 14:47 ReachabilityCardinality.txt
-rw-r--r-- 1 mcc users 105K May 29 14:47 ReachabilityCardinality.xml
-rw-r--r-- 1 mcc users 11K May 29 14:47 ReachabilityFireability.txt
-rw-r--r-- 1 mcc users 97K May 29 14:47 ReachabilityFireability.xml
-rw-r--r-- 1 mcc users 1.7K May 29 14:47 UpperBounds.txt
-rw-r--r-- 1 mcc users 3.8K May 29 14:47 UpperBounds.xml
-rw-r--r-- 1 mcc users 6 May 29 14:32 equiv_col
-rw-r--r-- 1 mcc users 5 May 29 14:32 instance
-rw-r--r-- 1 mcc users 6 May 29 14:32 iscolored
-rw-r--r-- 1 mcc users 304K May 29 14:32 model.pnml
--------------------
content from stdout:
=== Data for post analysis generated by BenchKit (invocation template)
The expected result is a vector of booleans
BOOL_VECTOR
echo here is the order used to build the result vector(from xml file)
FORMULA_NAME JoinFreeModules-PT-0100-LTLFireability-00
FORMULA_NAME JoinFreeModules-PT-0100-LTLFireability-01
FORMULA_NAME JoinFreeModules-PT-0100-LTLFireability-02
FORMULA_NAME JoinFreeModules-PT-0100-LTLFireability-03
FORMULA_NAME JoinFreeModules-PT-0100-LTLFireability-04
FORMULA_NAME JoinFreeModules-PT-0100-LTLFireability-05
FORMULA_NAME JoinFreeModules-PT-0100-LTLFireability-06
FORMULA_NAME JoinFreeModules-PT-0100-LTLFireability-07
FORMULA_NAME JoinFreeModules-PT-0100-LTLFireability-08
FORMULA_NAME JoinFreeModules-PT-0100-LTLFireability-09
FORMULA_NAME JoinFreeModules-PT-0100-LTLFireability-10
FORMULA_NAME JoinFreeModules-PT-0100-LTLFireability-11
FORMULA_NAME JoinFreeModules-PT-0100-LTLFireability-12
FORMULA_NAME JoinFreeModules-PT-0100-LTLFireability-13
FORMULA_NAME JoinFreeModules-PT-0100-LTLFireability-14
FORMULA_NAME JoinFreeModules-PT-0100-LTLFireability-15
=== Now, execution of the tool begins
BK_START 1748834761052
gold2024
Got BK_BIN_PATH=/home/mcc/BenchKit/bin/
---> gold2024 --- TAPAAL - v2.2024
Setting MODEL_PATH=.
Setting VERIFYPN=/home/mcc/BenchKit/bin/verifypn
Got BK_TIME_CONFINEMENT=3600
Setting TEMPDIR=/home/mcc/BenchKit/bin/tmp
Got BK_MEMORY_CONFINEMENT=16384
Limiting to 16265216 kB
Total timeout: 3590
Time left: 3590
*************************************
* TAPAAL verifying LTLFireability *
*************************************
TEMPDIR=/home/mcc/BenchKit/bin/tmp
QF=/home/mcc/BenchKit/bin/tmp/tmp.O37y5aqptf
MF=/home/mcc/BenchKit/bin/tmp/tmp.Ne1kFviwwn
Time left: 3590
---------------------------------------------------
Step -1: Stripping Colors
---------------------------------------------------
Verifying stripped models (16 in total)
Time left: 3590
---------------------------------------------------
Step 0: Parallel Simplification
---------------------------------------------------
Doing parallel simplification (16 in total)
Total simplification timout is 718 -- reduction timeout is 299
timeout 1017 /home/mcc/BenchKit/bin/verifypn -n -ltl -q 718 -l 29 -d 299 -z 4 -s OverApprox --binary-query-io 2 --write-simplified /home/mcc/BenchKit/bin/tmp/tmp.O37y5aqptf --write-reduced /home/mcc/BenchKit/bin/tmp/tmp.Ne1kFviwwn -x 1,2,3,4,5,6,7,8,9,10,11,12,13,14,15,16 ./model.pnml ./LTLFireability.xml
Time left: 3590
---------------------------------------------------
Step 1: Parallel processing
---------------------------------------------------
Doing parallel verification of individual queries (16 in total)
Each query is verified by 4 parallel strategies for 299 seconds
------------------- QUERY 1 ----------------------
Solution found by parallel processing (step 1)
Query index 0 was solved
Query is NOT satisfied.
Spent 0.003717 on verification
@@@0.02,8180@@@
parallel: This job succeeded:
eval /usr/bin/time -f "@@@%e,%M@@@" /home/mcc/BenchKit/bin/verifypn -n '-ltl tarjan --ltl-heur dist -q 0 -l 0 -d 119' /home/mcc/BenchKit/bin/tmp/tmp.Ne1kFviwwn /home/mcc/BenchKit/bin/tmp/tmp.O37y5aqptf --binary-query-io 1 -x 1 -n
FORMULA JoinFreeModules-PT-0100-LTLFireability-08 FALSE TECHNIQUES COLLATERAL_PROCESSING STRUCTURAL_REDUCTION QUERY_REDUCTION SAT_SMT EXPLICIT STATE_COMPRESSION STUBBORN_SETS
Time left: 3590
------------------- QUERY 2 ----------------------
Solution found by parallel processing (step 1)
Query index 0 was solved
Query is NOT satisfied.
Spent 0.051795 on verification
@@@0.07,149088@@@
parallel: This job succeeded:
eval /usr/bin/time -f "@@@%e,%M@@@" /home/mcc/BenchKit/bin/verifypn -n '-ltl tarjan --ltl-heur dist -q 0 -l 0 -d 119' /home/mcc/BenchKit/bin/tmp/tmp.Ne1kFviwwn /home/mcc/BenchKit/bin/tmp/tmp.O37y5aqptf --binary-query-io 1 -x 2 -n
FORMULA JoinFreeModules-PT-0100-LTLFireability-01 FALSE TECHNIQUES EXPLICIT TARJAN WEAK_SKIP STUBBORN AUT_STUB HEURISTIC DIST_HEUR OPTIM-1
Time left: 3590
------------------- QUERY 3 ----------------------
Solution found by parallel processing (step 1)
Query index 0 was solved
Query is NOT satisfied.
Spent 0.053629 on verification
@@@0.06,149228@@@
parallel: This job succeeded:
eval /usr/bin/time -f "@@@%e,%M@@@" /home/mcc/BenchKit/bin/verifypn -n '-ltl tarjan --ltl-heur dist -q 0 -l 0 -d 119' /home/mcc/BenchKit/bin/tmp/tmp.Ne1kFviwwn /home/mcc/BenchKit/bin/tmp/tmp.O37y5aqptf --binary-query-io 1 -x 3 -n
FORMULA JoinFreeModules-PT-0100-LTLFireability-02 FALSE TECHNIQUES EXPLICIT TARJAN WEAK_SKIP STUBBORN AUT_STUB HEURISTIC DIST_HEUR OPTIM-1
Time left: 3589
------------------- QUERY 4 ----------------------
Solution found by parallel processing (step 1)
Query index 0 was solved
Query is NOT satisfied.
Spent 0.065031 on verification
@@@0.08,149444@@@
parallel: This job succeeded:
eval /usr/bin/time -f "@@@%e,%M@@@" /home/mcc/BenchKit/bin/verifypn -n '-ltl tarjan --ltl-heur fire-count -q 0 -l 0 -d 119' /home/mcc/BenchKit/bin/tmp/tmp.Ne1kFviwwn /home/mcc/BenchKit/bin/tmp/tmp.O37y5aqptf --binary-query-io 1 -x 4 -n
FORMULA JoinFreeModules-PT-0100-LTLFireability-10 FALSE TECHNIQUES EXPLICIT TARJAN WEAK_SKIP STUBBORN AUT_STUB HEURISTIC LOGFIRECOUNT_HEUR(5000) OPTIM-1
Time left: 3589
------------------- QUERY 5 ----------------------
Solution found by parallel processing (step 1)
Query index 0 was solved
Query is NOT satisfied.
Spent 0.079602 on verification
@@@0.09,149152@@@
parallel: This job succeeded:
eval /usr/bin/time -f "@@@%e,%M@@@" /home/mcc/BenchKit/bin/verifypn -n '-ltl tarjan --ltl-heur dist -q 0 -l 0 -d 119' /home/mcc/BenchKit/bin/tmp/tmp.Ne1kFviwwn /home/mcc/BenchKit/bin/tmp/tmp.O37y5aqptf --binary-query-io 1 -x 5 -n
FORMULA JoinFreeModules-PT-0100-LTLFireability-05 FALSE TECHNIQUES EXPLICIT TARJAN WEAK_SKIP STUBBORN AUT_STUB HEURISTIC DIST_HEUR OPTIM-1
Time left: 3589
------------------- QUERY 6 ----------------------
Solution found by parallel processing (step 1)
Query index 0 was solved
Query is NOT satisfied.
Spent 0.051563 on verification
@@@0.07,149012@@@
parallel: This job succeeded:
eval /usr/bin/time -f "@@@%e,%M@@@" /home/mcc/BenchKit/bin/verifypn -n '-ltl tarjan --ltl-heur dist -q 0 -l 0 -d 119' /home/mcc/BenchKit/bin/tmp/tmp.Ne1kFviwwn /home/mcc/BenchKit/bin/tmp/tmp.O37y5aqptf --binary-query-io 1 -x 6 -n
FORMULA JoinFreeModules-PT-0100-LTLFireability-12 FALSE TECHNIQUES EXPLICIT TARJAN WEAK_SKIP STUBBORN AUT_STUB HEURISTIC DIST_HEUR OPTIM-1
Time left: 3588
------------------- QUERY 7 ----------------------
Solution found by parallel processing (step 1)
Query index 0 was solved
Query is satisfied.
Spent 3.92305 on verification
@@@3.95,156652@@@
parallel: This job succeeded:
eval /usr/bin/time -f "@@@%e,%M@@@" /home/mcc/BenchKit/bin/verifypn -n '-ltl tarjan --ltl-heur aut -s DFS -p -q 0 -l 0 -d 119' /home/mcc/BenchKit/bin/tmp/tmp.Ne1kFviwwn /home/mcc/BenchKit/bin/tmp/tmp.O37y5aqptf --binary-query-io 1 -x 7 -n
FORMULA JoinFreeModules-PT-0100-LTLFireability-03 TRUE TECHNIQUES EXPLICIT TARJAN WEAK_SKIP OPTIM-1
Time left: 3584
------------------- QUERY 8 ----------------------
Solution found by parallel processing (step 1)
Query index 0 was solved
Query is NOT satisfied.
Spent 0.009207 on verification
@@@0.02,21028@@@
parallel: This job succeeded:
eval /usr/bin/time -f "@@@%e,%M@@@" /home/mcc/BenchKit/bin/verifypn -n '-ltl ndfs -q 0 -l 0 -d 119' /home/mcc/BenchKit/bin/tmp/tmp.Ne1kFviwwn /home/mcc/BenchKit/bin/tmp/tmp.O37y5aqptf --binary-query-io 1 -x 8 -n
FORMULA JoinFreeModules-PT-0100-LTLFireability-04 FALSE TECHNIQUES EXPLICIT NDFS WEAK_SKIP HEURISTIC AUTOMATON_HEUR OPTIM-1
Time left: 3584
------------------- QUERY 9 ----------------------
Solution found by parallel processing (step 1)
Query index 0 was solved
Query is NOT satisfied.
Spent 0.014967 on verification
@@@0.04,21624@@@
parallel: This job succeeded:
eval /usr/bin/time -f "@@@%e,%M@@@" /home/mcc/BenchKit/bin/verifypn -n '-ltl ndfs -q 0 -l 0 -d 119' /home/mcc/BenchKit/bin/tmp/tmp.Ne1kFviwwn /home/mcc/BenchKit/bin/tmp/tmp.O37y5aqptf --binary-query-io 1 -x 9 -n
FORMULA JoinFreeModules-PT-0100-LTLFireability-14 FALSE TECHNIQUES EXPLICIT NDFS WEAK_SKIP HEURISTIC AUTOMATON_HEUR OPTIM-1
Time left: 3584
------------------- QUERY 10 ----------------------
Solution found by parallel processing (step 1)
Query index 0 was solved
Query is NOT satisfied.
Spent 0.077488 on verification
@@@0.09,151008@@@
parallel: This job succeeded:
eval /usr/bin/time -f "@@@%e,%M@@@" /home/mcc/BenchKit/bin/verifypn -n '-ltl tarjan --ltl-heur dist -q 0 -l 0 -d 119' /home/mcc/BenchKit/bin/tmp/tmp.Ne1kFviwwn /home/mcc/BenchKit/bin/tmp/tmp.O37y5aqptf --binary-query-io 1 -x 10 -n
FORMULA JoinFreeModules-PT-0100-LTLFireability-09 FALSE TECHNIQUES EXPLICIT TARJAN WEAK_SKIP STUBBORN AUT_STUB HEURISTIC DIST_HEUR OPTIM-1
Time left: 3584
------------------- QUERY 11 ----------------------
Solution found by parallel processing (step 1)
Query index 0 was solved
Query is NOT satisfied.
Spent 0.011737 on verification
@@@0.03,21792@@@
parallel: This job succeeded:
eval /usr/bin/time -f "@@@%e,%M@@@" /home/mcc/BenchKit/bin/verifypn -n '-ltl ndfs -q 0 -l 0 -d 119' /home/mcc/BenchKit/bin/tmp/tmp.Ne1kFviwwn /home/mcc/BenchKit/bin/tmp/tmp.O37y5aqptf --binary-query-io 1 -x 11 -n
FORMULA JoinFreeModules-PT-0100-LTLFireability-11 FALSE TECHNIQUES EXPLICIT NDFS WEAK_SKIP HEURISTIC AUTOMATON_HEUR OPTIM-1
Time left: 3583
------------------- QUERY 12 ----------------------
Solution found by parallel processing (step 1)
Query index 0 was solved
Query is NOT satisfied.
Spent 0.066805 on verification
@@@0.08,150588@@@
parallel: This job succeeded:
eval /usr/bin/time -f "@@@%e,%M@@@" /home/mcc/BenchKit/bin/verifypn -n '-ltl tarjan --ltl-heur dist -q 0 -l 0 -d 119' /home/mcc/BenchKit/bin/tmp/tmp.Ne1kFviwwn /home/mcc/BenchKit/bin/tmp/tmp.O37y5aqptf --binary-query-io 1 -x 12 -n
FORMULA JoinFreeModules-PT-0100-LTLFireability-13 FALSE TECHNIQUES EXPLICIT TARJAN WEAK_SKIP STUBBORN AUT_STUB HEURISTIC LOGFIRECOUNT_HEUR(5000) OPTIM-1
Query index 0 was solved
Query is NOT satisfied.
Spent 0.064679 on verification
@@@0.08,150556@@@
parallel: This job succeeded:
eval /usr/bin/time -f "@@@%e,%M@@@" /home/mcc/BenchKit/bin/verifypn -n '-ltl tarjan --ltl-heur fire-count -q 0 -l 0 -d 119' /home/mcc/BenchKit/bin/tmp/tmp.Ne1kFviwwn /home/mcc/BenchKit/bin/tmp/tmp.O37y5aqptf --binary-query-io 1 -x 12 -n
FORMULA JoinFreeModules-PT-0100-LTLFireability-13 FALSE TECHNIQUES EXPLICIT TARJAN WEAK_SKIP STUBBORN AUT_STUB HEURISTIC DIST_HEUR OPTIM-1
Time left: 3583
------------------- QUERY 13 ----------------------
No solution found
Command terminated by signal 9
@@@198.51,5378608@@@
parallel: Warning: This job was killed because it timed out:
parallel: Warning: eval /usr/bin/time -f "@@@%e,%M@@@" /home/mcc/BenchKit/bin/verifypn -n '-ltl tarjan --ltl-heur dist -q 0 -l 0 -d 119' /home/mcc/BenchKit/bin/tmp/tmp.Ne1kFviwwn /home/mcc/BenchKit/bin/tmp/tmp.O37y5aqptf --binary-query-io 1 -x 13 -n
parallel: Warning: This job was killed because it timed out:
parallel: Warning: eval /usr/bin/time -f "@@@%e,%M@@@" /home/mcc/BenchKit/bin/verifypn -n '-ltl tarjan --ltl-heur aut -s DFS -p -q 0 -l 0 -d 119' /home/mcc/BenchKit/bin/tmp/tmp.Ne1kFviwwn /home/mcc/BenchKit/bin/tmp/tmp.O37y5aqptf --binary-query-io 1 -x 13 -n
parallel: Warning: This job was killed because it timed out:
parallel: Warning: eval /usr/bin/time -f "@@@%e,%M@@@" /home/mcc/BenchKit/bin/verifypn -n '-ltl ndfs -q 0 -l 0 -d 119' /home/mcc/BenchKit/bin/tmp/tmp.Ne1kFviwwn /home/mcc/BenchKit/bin/tmp/tmp.O37y5aqptf --binary-query-io 1 -x 13 -n
Time left: 3277
------------------- QUERY 14 ----------------------
Solution found by parallel processing (step 1)
Query index 0 was solved
Query is NOT satisfied.
Spent 0.072651 on verification
@@@0.09,150028@@@
parallel: This job succeeded:
eval /usr/bin/time -f "@@@%e,%M@@@" /home/mcc/BenchKit/bin/verifypn -n '-ltl tarjan --ltl-heur dist -q 0 -l 0 -d 119' /home/mcc/BenchKit/bin/tmp/tmp.Ne1kFviwwn /home/mcc/BenchKit/bin/tmp/tmp.O37y5aqptf --binary-query-io 1 -x 14 -n
FORMULA JoinFreeModules-PT-0100-LTLFireability-06 FALSE TECHNIQUES EXPLICIT TARJAN WEAK_SKIP STUBBORN AUT_STUB HEURISTIC DIST_HEUR OPTIM-1
Time left: 3277
------------------- QUERY 15 ----------------------
No solution found
parallel: Warning: This job was killed because it timed out:
parallel: Warning: eval /usr/bin/time -f "@@@%e,%M@@@" /home/mcc/BenchKit/bin/verifypn -n '-ltl tarjan --ltl-heur dist -q 0 -l 0 -d 119' /home/mcc/BenchKit/bin/tmp/tmp.Ne1kFviwwn /home/mcc/BenchKit/bin/tmp/tmp.O37y5aqptf --binary-query-io 1 -x 15 -n
parallel: Warning: This job was killed because it timed out:
parallel: Warning: eval /usr/bin/time -f "@@@%e,%M@@@" /home/mcc/BenchKit/bin/verifypn -n '-ltl tarjan --ltl-heur fire-count -q 0 -l 0 -d 119' /home/mcc/BenchKit/bin/tmp/tmp.Ne1kFviwwn /home/mcc/BenchKit/bin/tmp/tmp.O37y5aqptf --binary-query-io 1 -x 15 -n
parallel: Warning: This job was killed because it timed out:
parallel: Warning: eval /usr/bin/time -f "@@@%e,%M@@@" /home/mcc/BenchKit/bin/verifypn -n '-ltl tarjan --ltl-heur aut -s DFS -p -q 0 -l 0 -d 119' /home/mcc/BenchKit/bin/tmp/tmp.Ne1kFviwwn /home/mcc/BenchKit/bin/tmp/tmp.O37y5aqptf --binary-query-io 1 -x 15 -n
parallel: Warning: This job was killed because it timed out:
parallel: Warning: eval /usr/bin/time -f "@@@%e,%M@@@" /home/mcc/BenchKit/bin/verifypn -n '-ltl ndfs -q 0 -l 0 -d 119' /home/mcc/BenchKit/bin/tmp/tmp.Ne1kFviwwn /home/mcc/BenchKit/bin/tmp/tmp.O37y5aqptf --binary-query-io 1 -x 15 -n
Time left: 2975
------------------- QUERY 16 ----------------------
No solution found
parallel: Warning: This job was killed because it timed out:
parallel: Warning: eval /usr/bin/time -f "@@@%e,%M@@@" /home/mcc/BenchKit/bin/verifypn -n '-ltl tarjan --ltl-heur dist -q 0 -l 0 -d 119' /home/mcc/BenchKit/bin/tmp/tmp.Ne1kFviwwn /home/mcc/BenchKit/bin/tmp/tmp.O37y5aqptf --binary-query-io 1 -x 16 -n
parallel: Warning: This job was killed because it timed out:
parallel: Warning: eval /usr/bin/time -f "@@@%e,%M@@@" /home/mcc/BenchKit/bin/verifypn -n '-ltl tarjan --ltl-heur fire-count -q 0 -l 0 -d 119' /home/mcc/BenchKit/bin/tmp/tmp.Ne1kFviwwn /home/mcc/BenchKit/bin/tmp/tmp.O37y5aqptf --binary-query-io 1 -x 16 -n
parallel: Warning: This job was killed because it timed out:
parallel: Warning: eval /usr/bin/time -f "@@@%e,%M@@@" /home/mcc/BenchKit/bin/verifypn -n '-ltl tarjan --ltl-heur aut -s DFS -p -q 0 -l 0 -d 119' /home/mcc/BenchKit/bin/tmp/tmp.Ne1kFviwwn /home/mcc/BenchKit/bin/tmp/tmp.O37y5aqptf --binary-query-io 1 -x 16 -n
parallel: Warning: This job was killed because it timed out:
parallel: Warning: eval /usr/bin/time -f "@@@%e,%M@@@" /home/mcc/BenchKit/bin/verifypn -n '-ltl ndfs -q 0 -l 0 -d 119' /home/mcc/BenchKit/bin/tmp/tmp.Ne1kFviwwn /home/mcc/BenchKit/bin/tmp/tmp.O37y5aqptf --binary-query-io 1 -x 16 -n
Time left: 2673
---------------------------------------------------
Step 2: Sequential processing
---------------------------------------------------
Remaining 3 queries are verified sequentially.
Each query is verified for a dynamic timeout (at least 598 seconds)
Time left: 2673
------------------- QUERY 13 ----------------------
Running query 13 for 891 seconds. Remaining: 3 queries and 2673 seconds
Solution found by sequential processing (step 2)
Query index 0 was solved
Query is NOT satisfied.
Spent 0.071273 on verification
@@@0.12,152036@@@
parallel: This job succeeded:
eval /usr/bin/time -f "@@@%e,%M@@@" /home/mcc/BenchKit/bin/verifypn -n '-ltl tarjan -q 40 -l 5 -d 119 -s BestFS --ltl-por automaton --ltl-heur aut' /home/mcc/BenchKit/bin/tmp/tmp.Ne1kFviwwn /home/mcc/BenchKit/bin/tmp/tmp.O37y5aqptf --binary-query-io 1 -x 13 -n
FORMULA JoinFreeModules-PT-0100-LTLFireability-07 FALSE TECHNIQUES EXPLICIT TARJAN WEAK_SKIP STUBBORN AUT_STUB HEURISTIC AUTOMATON_HEUR OPTIM-1
Time left: 2673
------------------- QUERY 15 ----------------------
Running query 15 for 1336 seconds. Remaining: 2 queries and 2673 seconds
No solution found
terminate called after throwing an instance of 'std::bad_alloc'
what(): std::bad_alloc
Command terminated by signal 6
@@@1293.41,16070448@@@
Time left: 1379
------------------- QUERY 16 ----------------------
Running query 16 for 1379 seconds. Remaining: 1 queries and 1379 seconds
No solution found
parallel: Warning: This job was killed because it timed out:
parallel: Warning: eval /usr/bin/time -f "@@@%e,%M@@@" /home/mcc/BenchKit/bin/verifypn -n '-ltl tarjan -q 40 -l 5 -d 119 -s BestFS --ltl-por automaton --ltl-heur aut' /home/mcc/BenchKit/bin/tmp/tmp.Ne1kFviwwn /home/mcc/BenchKit/bin/tmp/tmp.O37y5aqptf --binary-query-io 1 -x 16 -n
Time left: -2
Out of time, terminating!
terminated-with-cleanup
BK_STOP 1748838353297
--------------------
content from stderr:
CPN OverApproximation is only usable on colored models
Sequence of Actions to be Executed by the VM
This is useful if one wants to reexecute the tool in the VM from the submitted image disk.
set -x
# this is for BenchKit: configuration of major elements for the test
export BK_INPUT="JoinFreeModules-PT-0100"
export BK_EXAMINATION="LTLFireability"
export BK_TOOL="gold2024"
export BK_RESULT_DIR="/tmp/BK_RESULTS/OUTPUTS"
export BK_TIME_CONFINEMENT="3600"
export BK_MEMORY_CONFINEMENT="16384"
export BK_BIN_PATH="/home/mcc/BenchKit/bin/"
# this is specific to your benchmark or test
export BIN_DIR="$HOME/BenchKit/bin"
# remove the execution directoty if it exists (to avoid increse of .vmdk images)
if [ -d execution ] ; then
rm -rf execution
fi
# this is for BenchKit: explicit launching of the test
echo "====================================================================="
echo " Generated by BenchKit 2-5832"
echo " Executing tool gold2024"
echo " Input is JoinFreeModules-PT-0100, examination is LTLFireability"
echo " Time confinement is $BK_TIME_CONFINEMENT seconds"
echo " Memory confinement is 16384 MBytes"
echo " Number of cores is 4"
echo " Run identifier is r124-tall-174876435000334"
echo "====================================================================="
echo
echo "--------------------"
echo "preparation of the directory to be used:"
tar xzf /home/mcc/BenchKit/INPUTS/JoinFreeModules-PT-0100.tgz
mv JoinFreeModules-PT-0100 execution
cd execution
if [ "LTLFireability" = "ReachabilityDeadlock" ] || [ "LTLFireability" = "UpperBounds" ] || [ "LTLFireability" = "QuasiLiveness" ] || [ "LTLFireability" = "StableMarking" ] || [ "LTLFireability" = "Liveness" ] || [ "LTLFireability" = "OneSafe" ] || [ "LTLFireability" = "StateSpace" ]; then
rm -f GenericPropertiesVerdict.xml
fi
pwd
ls -lh
echo
echo "--------------------"
echo "content from stdout:"
echo
echo "=== Data for post analysis generated by BenchKit (invocation template)"
echo
if [ "LTLFireability" = "UpperBounds" ] ; then
echo "The expected result is a vector of positive values"
echo NUM_VECTOR
elif [ "LTLFireability" != "StateSpace" ] ; then
echo "The expected result is a vector of booleans"
echo BOOL_VECTOR
else
echo "no data necessary for post analysis"
fi
echo
if [ -f "LTLFireability.xml" ] ; then # for cunf (txt files deleted;-)
echo echo "here is the order used to build the result vector(from xml file)"
for x in $(grep '
echo "FORMULA_NAME $x"
done
elif [ "LTLFireability" = "ReachabilityDeadlock" ] || [ "LTLFireability" = "QuasiLiveness" ] || [ "LTLFireability" = "StableMarking" ] || [ "LTLFireability" = "Liveness" ] || [ "LTLFireability" = "OneSafe" ] ; then
echo "FORMULA_NAME LTLFireability"
fi
echo
echo "=== Now, execution of the tool begins"
echo
echo -n "BK_START "
date -u +%s%3N
echo
timeout -s 9 $BK_TIME_CONFINEMENT bash -c "/home/mcc/BenchKit/BenchKit_head.sh 2> STDERR ; echo ; echo -n \"BK_STOP \" ; date -u +%s%3N"
if [ $? -eq 137 ] ; then
echo
echo "BK_TIME_CONFINEMENT_REACHED"
fi
echo
echo "--------------------"
echo "content from stderr:"
echo
cat STDERR ;