

About the Execution of Tapaal for JoinFreeModules-PT-0020
| Execution Summary | |||||
| Max Memory Used (MB) |
Time wait (ms) | CPU Usage (ms) | I/O Wait (ms) | Computed Result | Execution Status |
| 15719.100 | 3592618.00 | 4385908.00 | 35338.10 | TTFFFTFTFTFFF?T? | normal |
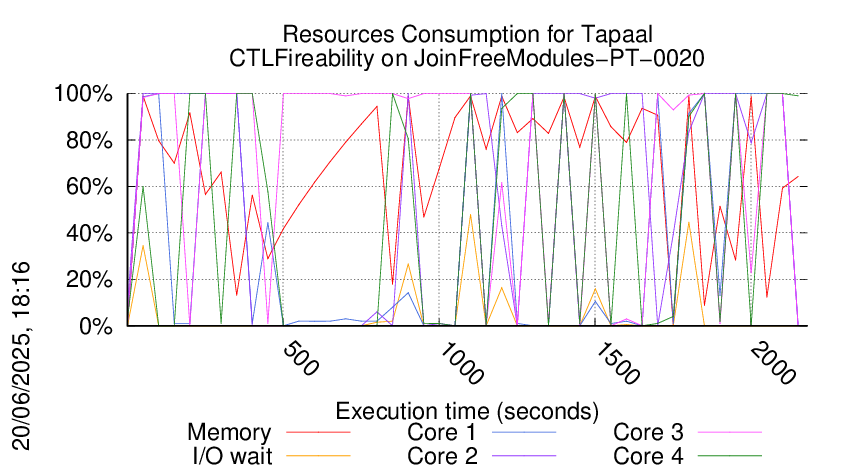
Execution Chart
We display below the execution chart for this examination (boot time has been removed).
Trace from the execution
Formatting '/data/fkordon/mcc2025-input.r116-tall-174876426000426.qcow2', fmt=qcow2 size=4294967296 backing_file=/data/fkordon/mcc2025-input.qcow2 backing_fmt=qcow2 cluster_size=65536 lazy_refcounts=off refcount_bits=16
Waiting for the VM to be ready (probing ssh)
..................
=====================================================================
Generated by BenchKit 2-5832
Executing tool tapaal
Input is JoinFreeModules-PT-0020, examination is CTLFireability
Time confinement is 3600 seconds
Memory confinement is 16384 MBytes
Number of cores is 4
Run identifier is r116-tall-174876426000426
=====================================================================
--------------------
preparation of the directory to be used:
/home/mcc/execution
total 528K
-rw-r--r-- 1 mcc users 8.1K May 29 14:47 CTLCardinality.txt
-rw-r--r-- 1 mcc users 90K May 29 14:47 CTLCardinality.xml
-rw-r--r-- 1 mcc users 6.9K May 29 14:47 CTLFireability.txt
-rw-r--r-- 1 mcc users 66K May 29 14:47 CTLFireability.xml
-rw-r--r-- 1 mcc users 4.2K May 29 14:32 GenericPropertiesDefinition.xml
-rw-r--r-- 1 mcc users 6.1K May 29 14:32 GenericPropertiesVerdict.xml
-rw-r--r-- 1 mcc users 3.7K May 29 14:47 LTLCardinality.txt
-rw-r--r-- 1 mcc users 27K May 29 14:47 LTLCardinality.xml
-rw-r--r-- 1 mcc users 2.2K May 29 14:47 LTLFireability.txt
-rw-r--r-- 1 mcc users 16K May 29 14:47 LTLFireability.xml
-rw-r--r-- 1 mcc users 11K May 29 14:47 ReachabilityCardinality.txt
-rw-r--r-- 1 mcc users 112K May 29 14:47 ReachabilityCardinality.xml
-rw-r--r-- 1 mcc users 7.5K May 29 14:47 ReachabilityFireability.txt
-rw-r--r-- 1 mcc users 63K May 29 14:47 ReachabilityFireability.xml
-rw-r--r-- 1 mcc users 1.7K May 29 14:47 UpperBounds.txt
-rw-r--r-- 1 mcc users 3.7K May 29 14:47 UpperBounds.xml
-rw-r--r-- 1 mcc users 6 May 29 14:32 equiv_col
-rw-r--r-- 1 mcc users 5 May 29 14:32 instance
-rw-r--r-- 1 mcc users 6 May 29 14:32 iscolored
-rw-r--r-- 1 mcc users 61K May 29 14:32 model.pnml
--------------------
content from stdout:
=== Data for post analysis generated by BenchKit (invocation template)
The expected result is a vector of booleans
BOOL_VECTOR
echo here is the order used to build the result vector(from xml file)
FORMULA_NAME JoinFreeModules-PT-0020-CTLFireability-2023-12
FORMULA_NAME JoinFreeModules-PT-0020-CTLFireability-2023-13
FORMULA_NAME JoinFreeModules-PT-0020-CTLFireability-2023-14
FORMULA_NAME JoinFreeModules-PT-0020-CTLFireability-2023-15
FORMULA_NAME JoinFreeModules-PT-0020-CTLFireability-2025-00
FORMULA_NAME JoinFreeModules-PT-0020-CTLFireability-2025-01
FORMULA_NAME JoinFreeModules-PT-0020-CTLFireability-2025-02
FORMULA_NAME JoinFreeModules-PT-0020-CTLFireability-2025-03
FORMULA_NAME JoinFreeModules-PT-0020-CTLFireability-2025-04
FORMULA_NAME JoinFreeModules-PT-0020-CTLFireability-2025-05
FORMULA_NAME JoinFreeModules-PT-0020-CTLFireability-2025-06
FORMULA_NAME JoinFreeModules-PT-0020-CTLFireability-2025-07
FORMULA_NAME JoinFreeModules-PT-0020-CTLFireability-2025-08
FORMULA_NAME JoinFreeModules-PT-0020-CTLFireability-2025-09
FORMULA_NAME JoinFreeModules-PT-0020-CTLFireability-2025-10
FORMULA_NAME JoinFreeModules-PT-0020-CTLFireability-2025-11
=== Now, execution of the tool begins
BK_START 1748831894980
tapaal
Got BK_BIN_PATH=/home/mcc/BenchKit/bin/
---> tapaal --- TAPAAL 2025-v2
Setting MODEL_PATH=.
Setting VERIFYPN=/home/mcc/BenchKit/bin/verifypn
Got BK_TIME_CONFINEMENT=3600
Setting TEMPDIR=/home/mcc/BenchKit/bin/tmp
Got BK_MEMORY_CONFINEMENT=16384
Limiting to 16265216 kB
Total timeout: 3590
Time left: 3590
*************************************
* TAPAAL verifying CTLFireability *
*************************************
TEMPDIR=/home/mcc/BenchKit/bin/tmp
QF=/home/mcc/BenchKit/bin/tmp/tmp.vEBXU1OXQt
MF=/home/mcc/BenchKit/bin/tmp/tmp.Sug0Ph6sZC
Time left: 3590
---------------------------------------------------
Step -1: Stripping Colors
---------------------------------------------------
Verifying stripped models (16 in total)
Time left: 3590
---------------------------------------------------
Step 0: Parallel Simplification
---------------------------------------------------
Doing parallel simplification (16 in total)
Total simplification timout is 718 -- reduction timeout is 299
timeout 3590 /home/mcc/BenchKit/bin/verifypn -n -q 718 -l 29 -d 299 -z 4 -s OverApprox --binary-query-io 2 --write-simplified /home/mcc/BenchKit/bin/tmp/tmp.vEBXU1OXQt --write-reduced /home/mcc/BenchKit/bin/tmp/tmp.Sug0Ph6sZC -x 1,2,3,4,5,6,7,8,9,10,11,12,13,14,15,16 ./model.pnml ./CTLFireability.xml
FORMULA JoinFreeModules-PT-0020-CTLFireability-2025-00 FALSE TECHNIQUES COLLATERAL_PROCESSING STRUCTURAL_REDUCTION QUERY_REDUCTION SAT_SMT LP_APPROX
Query index 0 was solved
Query is NOT satisfied.
FORMULA JoinFreeModules-PT-0020-CTLFireability-2025-01 TRUE TECHNIQUES COLLATERAL_PROCESSING STRUCTURAL_REDUCTION QUERY_REDUCTION SAT_SMT LP_APPROX
Query index 1 was solved
Query is satisfied.
FORMULA JoinFreeModules-PT-0020-CTLFireability-2025-07 FALSE TECHNIQUES COLLATERAL_PROCESSING STRUCTURAL_REDUCTION QUERY_REDUCTION SAT_SMT LP_APPROX
Query index 7 was solved
Query is NOT satisfied.
FORMULA JoinFreeModules-PT-0020-CTLFireability-2023-13 TRUE TECHNIQUES COLLATERAL_PROCESSING STRUCTURAL_REDUCTION QUERY_REDUCTION SAT_SMT LP_APPROX
Query index 13 was solved
Query is satisfied.
Solution found by parallel simplification (step 0)
Solution found by parallel simplification (step 0)
Solution found by parallel simplification (step 0)
Solution found by parallel simplification (step 0)
Time left: 3590
---------------------------------------------------
Step 1: Parallel processing
---------------------------------------------------
Doing parallel verification of individual queries (12 in total)
Each query is verified by 4 parallel strategies for 299 seconds
------------------- QUERY 1 ----------------------
Solution found by parallel processing (step 1)
Query index 0 was solved
Query is NOT satisfied.
Spent 0.203505 on verification
@@@0.21,83012@@@
parallel: This job succeeded:
eval /usr/bin/time -f "@@@%e,%M@@@" /home/mcc/BenchKit/bin/verifypn -n '-s RPFS -q 0 -l 0 -d 119' /home/mcc/BenchKit/bin/tmp/tmp.Sug0Ph6sZC /home/mcc/BenchKit/bin/tmp/tmp.vEBXU1OXQt --binary-query-io 1 -x 1 -n
FORMULA JoinFreeModules-PT-0020-CTLFireability-2025-06 FALSE TECHNIQUES COLLATERAL_PROCESSING EXPLICIT STATE_COMPRESSION SAT_SMT STUBBORN_SETS CTL_CZERO
Time left: 3590
------------------- QUERY 2 ----------------------
Solution found by parallel processing (step 1)
Query index 0 was solved
Query is NOT satisfied.
Spent 0.044903 on verification
@@@0.05,56860@@@
parallel: This job succeeded:
eval /usr/bin/time -f "@@@%e,%M@@@" /home/mcc/BenchKit/bin/verifypn -n '-s BestFS -q 0 -l 0 -d 119' /home/mcc/BenchKit/bin/tmp/tmp.Sug0Ph6sZC /home/mcc/BenchKit/bin/tmp/tmp.vEBXU1OXQt --binary-query-io 1 -x 2 -n
FORMULA JoinFreeModules-PT-0020-CTLFireability-2025-02 FALSE TECHNIQUES COLLATERAL_PROCESSING EXPLICIT STATE_COMPRESSION SAT_SMT STUBBORN_SETS CTL_CZERO
Time left: 3589
------------------- QUERY 3 ----------------------
No solution found
Command terminated by signal 9
@@@49.49,8966228@@@
Command terminated by signal 9
@@@149.20,6166500@@@
parallel: Warning: This job was killed because it timed out:
parallel: Warning: eval /usr/bin/time -f "@@@%e,%M@@@" /home/mcc/BenchKit/bin/verifypn -n '-s BestFS -q 0 -l 0 -d 119' /home/mcc/BenchKit/bin/tmp/tmp.Sug0Ph6sZC /home/mcc/BenchKit/bin/tmp/tmp.vEBXU1OXQt --binary-query-io 1 -x 3 -n
parallel: Warning: This job was killed because it timed out:
parallel: Warning: eval /usr/bin/time -f "@@@%e,%M@@@" /home/mcc/BenchKit/bin/verifypn -n '-s BFS -q 0 -l 0 -d 119' /home/mcc/BenchKit/bin/tmp/tmp.Sug0Ph6sZC /home/mcc/BenchKit/bin/tmp/tmp.vEBXU1OXQt --binary-query-io 1 -x 3 -n
Time left: 3271
------------------- QUERY 4 ----------------------
No solution found
Command terminated by signal 9
@@@58.43,8800744@@@
parallel: Warning: This job was killed because it timed out:
parallel: Warning: eval /usr/bin/time -f "@@@%e,%M@@@" /home/mcc/BenchKit/bin/verifypn -n '-s BestFS -q 0 -l 0 -d 119' /home/mcc/BenchKit/bin/tmp/tmp.Sug0Ph6sZC /home/mcc/BenchKit/bin/tmp/tmp.vEBXU1OXQt --binary-query-io 1 -x 4 -n
parallel: Warning: This job was killed because it timed out:
parallel: Warning: eval /usr/bin/time -f "@@@%e,%M@@@" /home/mcc/BenchKit/bin/verifypn -n '-s BFS -q 0 -l 0 -d 119' /home/mcc/BenchKit/bin/tmp/tmp.Sug0Ph6sZC /home/mcc/BenchKit/bin/tmp/tmp.vEBXU1OXQt --binary-query-io 1 -x 4 -n
parallel: Warning: This job was killed because it timed out:
parallel: Warning: eval /usr/bin/time -f "@@@%e,%M@@@" /home/mcc/BenchKit/bin/verifypn -n '-s DFS -q 0 -l 0 -d 119' /home/mcc/BenchKit/bin/tmp/tmp.Sug0Ph6sZC /home/mcc/BenchKit/bin/tmp/tmp.vEBXU1OXQt --binary-query-io 1 -x 4 -n
Time left: 2945
------------------- QUERY 5 ----------------------
Solution found by parallel processing (step 1)
Query index 0 was solved
Query is NOT satisfied.
Spent 0.062897 on verification
@@@0.08,56644@@@
parallel: This job succeeded:
eval /usr/bin/time -f "@@@%e,%M@@@" /home/mcc/BenchKit/bin/verifypn -n '-s BestFS -q 0 -l 0 -d 119' /home/mcc/BenchKit/bin/tmp/tmp.Sug0Ph6sZC /home/mcc/BenchKit/bin/tmp/tmp.vEBXU1OXQt --binary-query-io 1 -x 5 -n
Query index 0 was solved
Query is NOT satisfied.
Spent 0.062005 on verification
@@@0.06,56708@@@
parallel: This job succeeded:
eval /usr/bin/time -f "@@@%e,%M@@@" /home/mcc/BenchKit/bin/verifypn -n '-s BFS -q 0 -l 0 -d 119' /home/mcc/BenchKit/bin/tmp/tmp.Sug0Ph6sZC /home/mcc/BenchKit/bin/tmp/tmp.vEBXU1OXQt --binary-query-io 1 -x 5 -n
FORMULA JoinFreeModules-PT-0020-CTLFireability-2025-04 FALSE TECHNIQUES COLLATERAL_PROCESSING EXPLICIT STATE_COMPRESSION SAT_SMT STUBBORN_SETS CTL_CZERO
Time left: 2945
------------------- QUERY 6 ----------------------
Solution found by parallel processing (step 1)
Query index 0 was solved
Query is NOT satisfied.
Spent 0.059525 on verification
@@@0.06,56684@@@
parallel: This job succeeded:
eval /usr/bin/time -f "@@@%e,%M@@@" /home/mcc/BenchKit/bin/verifypn -n '-s DFS -q 0 -l 0 -d 119' /home/mcc/BenchKit/bin/tmp/tmp.Sug0Ph6sZC /home/mcc/BenchKit/bin/tmp/tmp.vEBXU1OXQt --binary-query-io 1 -x 6 -n
FORMULA JoinFreeModules-PT-0020-CTLFireability-2025-08 FALSE TECHNIQUES COLLATERAL_PROCESSING EXPLICIT STATE_COMPRESSION SAT_SMT STUBBORN_SETS CTL_CZERO
Time left: 2945
------------------- QUERY 7 ----------------------
Solution found by parallel processing (step 1)
Query index 0 was solved
Query is NOT satisfied.
Spent 0.046698 on verification
@@@0.05,56680@@@
parallel: This job succeeded:
eval /usr/bin/time -f "@@@%e,%M@@@" /home/mcc/BenchKit/bin/verifypn -n '-s BFS -q 0 -l 0 -d 119' /home/mcc/BenchKit/bin/tmp/tmp.Sug0Ph6sZC /home/mcc/BenchKit/bin/tmp/tmp.vEBXU1OXQt --binary-query-io 1 -x 7 -n
FORMULA JoinFreeModules-PT-0020-CTLFireability-2023-15 FALSE TECHNIQUES COLLATERAL_PROCESSING EXPLICIT STATE_COMPRESSION SAT_SMT STUBBORN_SETS CTL_CZERO
Time left: 2945
------------------- QUERY 8 ----------------------
Solution found by parallel processing (step 1)
Query index 0 was solved
Query is satisfied.
Spent 0.154115 on verification
@@@0.16,72004@@@
parallel: This job succeeded:
eval /usr/bin/time -f "@@@%e,%M@@@" /home/mcc/BenchKit/bin/verifypn -n '-s RPFS -q 0 -l 0 -d 119' /home/mcc/BenchKit/bin/tmp/tmp.Sug0Ph6sZC /home/mcc/BenchKit/bin/tmp/tmp.vEBXU1OXQt --binary-query-io 1 -x 8 -n
FORMULA JoinFreeModules-PT-0020-CTLFireability-2025-05 TRUE TECHNIQUES COLLATERAL_PROCESSING EXPLICIT STATE_COMPRESSION SAT_SMT STUBBORN_SETS CTL_CZERO
Time left: 2944
------------------- QUERY 9 ----------------------
Solution found by parallel processing (step 1)
Query index 0 was solved
Query is satisfied.
Spent 19.3409 on verification
@@@19.39,906200@@@
parallel: This job succeeded:
eval /usr/bin/time -f "@@@%e,%M@@@" /home/mcc/BenchKit/bin/verifypn -n '-s BFS -q 0 -l 0 -d 119' /home/mcc/BenchKit/bin/tmp/tmp.Sug0Ph6sZC /home/mcc/BenchKit/bin/tmp/tmp.vEBXU1OXQt --binary-query-io 1 -x 9 -n
FORMULA JoinFreeModules-PT-0020-CTLFireability-2025-03 TRUE TECHNIQUES COLLATERAL_PROCESSING EXPLICIT STATE_COMPRESSION SAT_SMT STUBBORN_SETS CTL_CZERO
Time left: 2924
------------------- QUERY 10 ----------------------
Solution found by parallel processing (step 1)
Query index 0 was solved
Query is NOT satisfied.
Spent 0.047915 on verification
@@@0.05,56816@@@
parallel: This job succeeded:
eval /usr/bin/time -f "@@@%e,%M@@@" /home/mcc/BenchKit/bin/verifypn -n '-s BestFS -q 0 -l 0 -d 119' /home/mcc/BenchKit/bin/tmp/tmp.Sug0Ph6sZC /home/mcc/BenchKit/bin/tmp/tmp.vEBXU1OXQt --binary-query-io 1 -x 10 -n
FORMULA JoinFreeModules-PT-0020-CTLFireability-2023-14 FALSE TECHNIQUES COLLATERAL_PROCESSING EXPLICIT STATE_COMPRESSION SAT_SMT STUBBORN_SETS CTL_CZERO
Time left: 2924
------------------- QUERY 11 ----------------------
Solution found by parallel processing (step 1)
Query index 0 was solved
Query is satisfied.
Spent 0.048837 on verification
@@@0.05,56624@@@
parallel: This job succeeded:
eval /usr/bin/time -f "@@@%e,%M@@@" /home/mcc/BenchKit/bin/verifypn -n '-s BestFS -q 0 -l 0 -d 119' /home/mcc/BenchKit/bin/tmp/tmp.Sug0Ph6sZC /home/mcc/BenchKit/bin/tmp/tmp.vEBXU1OXQt --binary-query-io 1 -x 11 -n
FORMULA JoinFreeModules-PT-0020-CTLFireability-2023-12 TRUE TECHNIQUES COLLATERAL_PROCESSING EXPLICIT STATE_COMPRESSION SAT_SMT STUBBORN_SETS CTL_CZERO
Time left: 2924
------------------- QUERY 12 ----------------------
Solution found by parallel processing (step 1)
Query index 0 was solved
Query is satisfied.
Spent 0.047631 on verification
@@@0.05,56696@@@
parallel: This job succeeded:
eval /usr/bin/time -f "@@@%e,%M@@@" /home/mcc/BenchKit/bin/verifypn -n '-s BFS -q 0 -l 0 -d 119' /home/mcc/BenchKit/bin/tmp/tmp.Sug0Ph6sZC /home/mcc/BenchKit/bin/tmp/tmp.vEBXU1OXQt --binary-query-io 1 -x 12 -n
FORMULA JoinFreeModules-PT-0020-CTLFireability-2025-10 TRUE TECHNIQUES COLLATERAL_PROCESSING EXPLICIT STATE_COMPRESSION SAT_SMT STUBBORN_SETS CTL_CZERO
Time left: 2924
---------------------------------------------------
Step 2: Sequential processing
---------------------------------------------------
Remaining 2 queries are verified sequentially.
Each query is verified for a dynamic timeout (at least 598 seconds)
Time left: 2924
------------------- QUERY 3 ----------------------
Running query 3 for 1462 seconds. Remaining: 2 queries and 2924 seconds
No solution found
Command terminated by signal 9
@@@90.07,12217856@@@
Command terminated by signal 9
@@@515.47,16111852@@@
Time left: 2408
------------------- QUERY 4 ----------------------
Running query 4 for 2408 seconds. Remaining: 1 queries and 2408 seconds
No solution found
Command terminated by signal 9
@@@241.69,11669012@@@
Command terminated by signal 9
@@@421.05,16112188@@@
Time left: 1987
Time left: 1987
---------------------------------------------------
Step 4: Random Parallel processing
---------------------------------------------------
Doing random parallel verification of individual queries (2 in total)
Each query is verified by 4 parallel strategies for 993 seconds
------------------- QUERY 3 ----------------------
No solution found
Command terminated by signal 9
@@@100.18,4105132@@@
Command terminated by signal 9
@@@121.86,5423940@@@
Command terminated by signal 9
@@@142.12,8154936@@@
terminate called after throwing an instance of 'std::bad_alloc'
what(): std::bad_alloc
Command terminated by signal 6
@@@184.76,16014888@@@
Time left: 1801
------------------- QUERY 4 ----------------------
No solution found
Command terminated by signal 9
@@@56.58,4089312@@@
Command terminated by signal 9
@@@73.76,5464400@@@
Command terminated by signal 9
@@@311.53,8079752@@@
terminate called after throwing an instance of 'std::bad_alloc'
what(): std::bad_alloc
Command terminated by signal 6
@@@355.36,16033428@@@
Time left: 1446
Time left: 1446
---------------------------------------------------
Step 4: Random Parallel processing
---------------------------------------------------
Doing random parallel verification of individual queries (2 in total)
Each query is verified by 4 parallel strategies for 723 seconds
------------------- QUERY 3 ----------------------
No solution found
Command terminated by signal 9
@@@28.60,5382428@@@
Command terminated by signal 9
@@@39.19,6323560@@@
Command terminated by signal 9
@@@60.29,8553940@@@
terminate called after throwing an instance of 'std::bad_alloc'
what(): std::bad_alloc
Command terminated by signal 6
@@@103.86,16012932@@@
Time left: 1342
------------------- QUERY 4 ----------------------
No solution found
Command terminated by signal 9
@@@37.52,4446080@@@
Command terminated by signal 9
@@@47.63,5624560@@@
Command terminated by signal 9
@@@62.67,8424260@@@
terminate called after throwing an instance of 'std::bad_alloc'
what(): std::bad_alloc
Command terminated by signal 6
@@@104.74,16032844@@@
Time left: 1237
Time left: 1237
---------------------------------------------------
Step 4: Random Parallel processing
---------------------------------------------------
Doing random parallel verification of individual queries (2 in total)
Each query is verified by 4 parallel strategies for 618 seconds
------------------- QUERY 3 ----------------------
No solution found
Command terminated by signal 9
@@@31.18,4084944@@@
Command terminated by signal 9
@@@39.60,5417484@@@
Command terminated by signal 9
@@@83.68,8084948@@@
terminate called after throwing an instance of 'std::bad_alloc'
what(): std::bad_alloc
Command terminated by signal 6
@@@128.74,16012928@@@
Time left: 1108
------------------- QUERY 4 ----------------------
No solution found
Command terminated by signal 9
@@@40.38,4083784@@@
Command terminated by signal 9
@@@50.01,5404128@@@
Command terminated by signal 9
@@@65.56,8116196@@@
terminate called after throwing an instance of 'std::bad_alloc'
what(): std::bad_alloc
Command terminated by signal 6
@@@110.79,16033464@@@
Time left: 997
Time left: 996
---------------------------------------------------
Step 4: Random Parallel processing
---------------------------------------------------
Doing random parallel verification of individual queries (2 in total)
Each query is verified by 4 parallel strategies for 498 seconds
------------------- QUERY 3 ----------------------
No solution found
Command terminated by signal 9
@@@29.32,4035112@@@
Command terminated by signal 9
@@@60.40,5394640@@@
Command terminated by signal 9
@@@76.49,8077760@@@
terminate called after throwing an instance of 'std::bad_alloc'
what(): std::bad_alloc
Command terminated by signal 6
@@@121.72,16014892@@@
Time left: 874
------------------- QUERY 4 ----------------------
No solution found
Command terminated by signal 9
@@@38.43,4142144@@@
Command terminated by signal 9
@@@60.54,5449400@@@
Command terminated by signal 9
@@@153.59,8098996@@@
terminate called after throwing an instance of 'std::bad_alloc'
what(): std::bad_alloc
Command terminated by signal 6
@@@199.44,16033444@@@
Time left: 675
Time left: 675
---------------------------------------------------
Step 4: Random Parallel processing
---------------------------------------------------
Doing random parallel verification of individual queries (2 in total)
Each query is verified by 4 parallel strategies for 337 seconds
------------------- QUERY 3 ----------------------
No solution found
Command terminated by signal 9
@@@90.81,4038144@@@
Command terminated by signal 9
@@@120.60,5375708@@@
Command terminated by signal 9
@@@136.27,8078152@@@
terminate called after throwing an instance of 'std::bad_alloc'
what(): std::bad_alloc
Command terminated by signal 6
@@@179.89,16014884@@@
Time left: 494
------------------- QUERY 4 ----------------------
No solution found
Command terminated by signal 9
@@@44.57,5317444@@@
Command terminated by signal 9
@@@165.98,5555508@@@
Command terminated by signal 9
@@@182.42,8327180@@@
terminate called after throwing an instance of 'std::bad_alloc'
what(): std::bad_alloc
Command terminated by signal 6
@@@227.92,16033424@@@
Time left: 266
Time left: 266
---------------------------------------------------
Step 4: Random Parallel processing
---------------------------------------------------
Doing random parallel verification of individual queries (2 in total)
Each query is verified by 4 parallel strategies for 133 seconds
------------------- QUERY 3 ----------------------
No solution found
Command terminated by signal 9
@@@26.14,4382440@@@
Command terminated by signal 9
@@@138.03,5627420@@@
parallel: Warning: This job was killed because it timed out:
parallel: Warning: eval /usr/bin/time -f "@@@%e,%M@@@" /home/mcc/BenchKit/bin/verifypn -n '-s RPFS --seed-offset 0 -q 3590 -l 0 -d 119' /home/mcc/BenchKit/bin/tmp/tmp.Sug0Ph6sZC /home/mcc/BenchKit/bin/tmp/tmp.vEBXU1OXQt --binary-query-io 1 -x 3 -n
parallel: Warning: This job was killed because it timed out:
parallel: Warning: eval /usr/bin/time -f "@@@%e,%M@@@" /home/mcc/BenchKit/bin/verifypn -n '-tar -s RDFS --seed-offset 9220 -q 0 -l 0 -d 119' /home/mcc/BenchKit/bin/tmp/tmp.Sug0Ph6sZC /home/mcc/BenchKit/bin/tmp/tmp.vEBXU1OXQt --binary-query-io 1 -x 3 -n
Time left: 127
------------------- QUERY 4 ----------------------
No solution found
Command terminated by signal 9
@@@24.83,4256356@@@
Command terminated by signal 9
@@@68.39,5583676@@@
Command terminated by signal 9
@@@86.06,8176172@@@
parallel: Warning: This job was killed because it timed out:
parallel: Warning: eval /usr/bin/time -f "@@@%e,%M@@@" /home/mcc/BenchKit/bin/verifypn -n '-s RPFS --seed-offset 2018 -q 0 -l 0 -d 119' /home/mcc/BenchKit/bin/tmp/tmp.Sug0Ph6sZC /home/mcc/BenchKit/bin/tmp/tmp.vEBXU1OXQt --binary-query-io 1 -x 4 -n
Time left: -2
Out of time, terminating!
terminated-with-cleanup
BK_STOP 1748835487598
--------------------
content from stderr:
CPN OverApproximation is only usable on colored models
Sequence of Actions to be Executed by the VM
This is useful if one wants to reexecute the tool in the VM from the submitted image disk.
set -x
# this is for BenchKit: configuration of major elements for the test
export BK_INPUT="JoinFreeModules-PT-0020"
export BK_EXAMINATION="CTLFireability"
export BK_TOOL="tapaal"
export BK_RESULT_DIR="/tmp/BK_RESULTS/OUTPUTS"
export BK_TIME_CONFINEMENT="3600"
export BK_MEMORY_CONFINEMENT="16384"
export BK_BIN_PATH="/home/mcc/BenchKit/bin/"
# this is specific to your benchmark or test
export BIN_DIR="$HOME/BenchKit/bin"
# remove the execution directoty if it exists (to avoid increse of .vmdk images)
if [ -d execution ] ; then
rm -rf execution
fi
# this is for BenchKit: explicit launching of the test
echo "====================================================================="
echo " Generated by BenchKit 2-5832"
echo " Executing tool tapaal"
echo " Input is JoinFreeModules-PT-0020, examination is CTLFireability"
echo " Time confinement is $BK_TIME_CONFINEMENT seconds"
echo " Memory confinement is 16384 MBytes"
echo " Number of cores is 4"
echo " Run identifier is r116-tall-174876426000426"
echo "====================================================================="
echo
echo "--------------------"
echo "preparation of the directory to be used:"
tar xzf /home/mcc/BenchKit/INPUTS/JoinFreeModules-PT-0020.tgz
mv JoinFreeModules-PT-0020 execution
cd execution
if [ "CTLFireability" = "ReachabilityDeadlock" ] || [ "CTLFireability" = "UpperBounds" ] || [ "CTLFireability" = "QuasiLiveness" ] || [ "CTLFireability" = "StableMarking" ] || [ "CTLFireability" = "Liveness" ] || [ "CTLFireability" = "OneSafe" ] || [ "CTLFireability" = "StateSpace" ]; then
rm -f GenericPropertiesVerdict.xml
fi
pwd
ls -lh
echo
echo "--------------------"
echo "content from stdout:"
echo
echo "=== Data for post analysis generated by BenchKit (invocation template)"
echo
if [ "CTLFireability" = "UpperBounds" ] ; then
echo "The expected result is a vector of positive values"
echo NUM_VECTOR
elif [ "CTLFireability" != "StateSpace" ] ; then
echo "The expected result is a vector of booleans"
echo BOOL_VECTOR
else
echo "no data necessary for post analysis"
fi
echo
if [ -f "CTLFireability.xml" ] ; then # for cunf (txt files deleted;-)
echo echo "here is the order used to build the result vector(from xml file)"
for x in $(grep '
echo "FORMULA_NAME $x"
done
elif [ "CTLFireability" = "ReachabilityDeadlock" ] || [ "CTLFireability" = "QuasiLiveness" ] || [ "CTLFireability" = "StableMarking" ] || [ "CTLFireability" = "Liveness" ] || [ "CTLFireability" = "OneSafe" ] ; then
echo "FORMULA_NAME CTLFireability"
fi
echo
echo "=== Now, execution of the tool begins"
echo
echo -n "BK_START "
date -u +%s%3N
echo
timeout -s 9 $BK_TIME_CONFINEMENT bash -c "/home/mcc/BenchKit/BenchKit_head.sh 2> STDERR ; echo ; echo -n \"BK_STOP \" ; date -u +%s%3N"
if [ $? -eq 137 ] ; then
echo
echo "BK_TIME_CONFINEMENT_REACHED"
fi
echo
echo "--------------------"
echo "content from stderr:"
echo
cat STDERR ;