

About the Execution of LTSMin+red for ServersAndClients-PT-100080
| Execution Summary | |||||
| Max Memory Used (MB) |
Time wait (ms) | CPU Usage (ms) | I/O Wait (ms) | Computed Result | Execution Status |
| 1475.247 | 24763.00 | 59278.00 | 73.30 | F | normal |
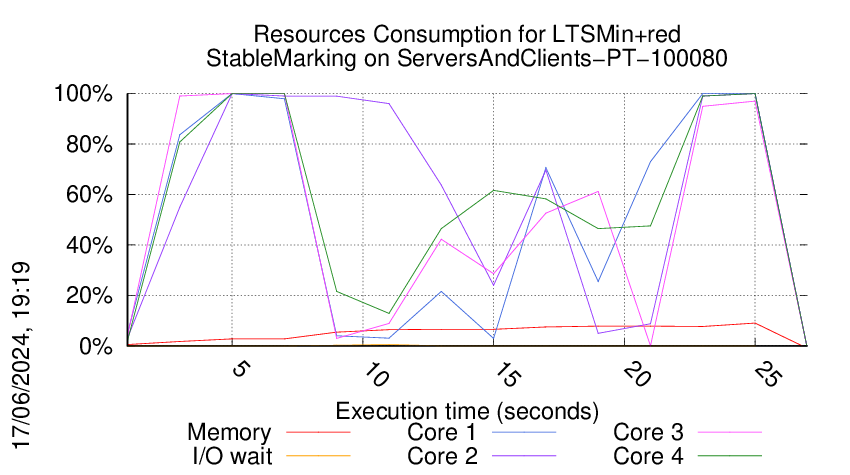
Execution Chart
We display below the execution chart for this examination (boot time has been removed).
Trace from the execution
Formatting '/data/fkordon/mcc2024-input.r526-tall-171679094600393.qcow2', fmt=qcow2 size=4294967296 backing_file=/data/fkordon/mcc2024-input.qcow2 backing_fmt=qcow2 cluster_size=65536 lazy_refcounts=off refcount_bits=16
Waiting for the VM to be ready (probing ssh)
................................................................................................................................................................................................................................................................................................................................................................................................................................................................................................................................................................................................................................................................................................................................................................................................................................................................................................................................................................................................................................................................................................................................................................................................................................................
=====================================================================
Generated by BenchKit 2-5568
Executing tool ltsminxred
Input is ServersAndClients-PT-100080, examination is StableMarking
Time confinement is 1800 seconds
Memory confinement is 16384 MBytes
Number of cores is 4
Run identifier is r526-tall-171679094600393
=====================================================================
--------------------
preparation of the directory to be used:
/home/mcc/execution
total 5.3M
-rw-r--r-- 1 mcc users 8.9K May 14 13:22 CTLCardinality.txt
-rw-r--r-- 1 mcc users 89K May 14 13:22 CTLCardinality.xml
-rw-r--r-- 1 mcc users 6.4K May 14 13:22 CTLFireability.txt
-rw-r--r-- 1 mcc users 52K May 14 13:22 CTLFireability.xml
-rw-r--r-- 1 mcc users 4.3K Apr 23 07:50 LTLCardinality.txt
-rw-r--r-- 1 mcc users 27K Apr 23 07:50 LTLCardinality.xml
-rw-r--r-- 1 mcc users 2.5K Apr 23 07:50 LTLFireability.txt
-rw-r--r-- 1 mcc users 16K Apr 23 07:50 LTLFireability.xml
-rw-r--r-- 1 mcc users 11K Apr 13 15:57 ReachabilityCardinality.txt
-rw-r--r-- 1 mcc users 92K Apr 13 15:57 ReachabilityCardinality.xml
-rw-r--r-- 1 mcc users 8.2K Apr 13 15:54 ReachabilityFireability.txt
-rw-r--r-- 1 mcc users 59K Apr 13 15:54 ReachabilityFireability.xml
-rw-r--r-- 1 mcc users 1.8K Apr 23 07:50 UpperBounds.txt
-rw-r--r-- 1 mcc users 3.9K Apr 23 07:50 UpperBounds.xml
-rw-r--r-- 1 mcc users 6 May 18 16:43 equiv_col
-rw-r--r-- 1 mcc users 7 May 18 16:43 instance
-rw-r--r-- 1 mcc users 6 May 18 16:43 iscolored
-rw-r--r-- 1 mcc users 4.9M May 18 16:43 model.pnml
--------------------
content from stdout:
=== Data for post analysis generated by BenchKit (invocation template)
The expected result is a vector of booleans
BOOL_VECTOR
FORMULA_NAME StableMarking
=== Now, execution of the tool begins
BK_START 1717220484221
Invoking MCC driver with
BK_TOOL=ltsminxred
BK_EXAMINATION=StableMarking
BK_BIN_PATH=/home/mcc/BenchKit/bin/
BK_TIME_CONFINEMENT=1800
BK_INPUT=ServersAndClients-PT-100080
BK_MEMORY_CONFINEMENT=16384
Applying reductions before tool ltsmin
Invoking reducer
Running Version 202405141337
[2024-06-01 05:41:25] [INFO ] Running its-tools with arguments : [-pnfolder, /home/mcc/execution, -examination, StableMarking, -timeout, 180, -rebuildPNML]
[2024-06-01 05:41:25] [INFO ] Parsing pnml file : /home/mcc/execution/model.pnml
[2024-06-01 05:41:25] [INFO ] Load time of PNML (sax parser for PT used): 411 ms
[2024-06-01 05:41:25] [INFO ] Transformed 8481 places.
[2024-06-01 05:41:25] [INFO ] Transformed 16200 transitions.
[2024-06-01 05:41:25] [INFO ] Found NUPN structural information;
[2024-06-01 05:41:25] [INFO ] Parsed PT model containing 8481 places and 16200 transitions and 48800 arcs in 572 ms.
RANDOM walk for 40000 steps (8 resets) in 15532 ms. (2 steps per ms) remains 2258/8481 properties
BEST_FIRST walk for 124 steps (0 resets) in 41 ms. (2 steps per ms) remains 2258/2258 properties
BEST_FIRST walk for 124 steps (0 resets) in 25 ms. (4 steps per ms) remains 2258/2258 properties
BEST_FIRST walk for 124 steps (0 resets) in 13 ms. (8 steps per ms) remains 2258/2258 properties
BEST_FIRST walk for 124 steps (0 resets) in 33 ms. (3 steps per ms) remains 2258/2258 properties
BEST_FIRST walk for 124 steps (0 resets) in 29 ms. (4 steps per ms) remains 2258/2258 properties
BEST_FIRST walk for 124 steps (0 resets) in 19 ms. (6 steps per ms) remains 2258/2258 properties
BEST_FIRST walk for 124 steps (0 resets) in 24 ms. (4 steps per ms) remains 2258/2258 properties
BEST_FIRST walk for 124 steps (0 resets) in 30 ms. (4 steps per ms) remains 2258/2258 properties
BEST_FIRST walk for 124 steps (0 resets) in 7 ms. (15 steps per ms) remains 2258/2258 properties
BEST_FIRST walk for 124 steps (0 resets) in 4 ms. (24 steps per ms) remains 2258/2258 properties
BEST_FIRST walk for 124 steps (0 resets) in 5 ms. (20 steps per ms) remains 2258/2258 properties
BEST_FIRST walk for 124 steps (0 resets) in 7 ms. (15 steps per ms) remains 2258/2258 properties
BEST_FIRST walk for 124 steps (0 resets) in 7 ms. (15 steps per ms) remains 2258/2258 properties
BEST_FIRST walk for 124 steps (0 resets) in 7 ms. (15 steps per ms) remains 2258/2258 properties
BEST_FIRST walk for 124 steps (0 resets) in 4 ms. (24 steps per ms) remains 2258/2258 properties
BEST_FIRST walk for 124 steps (0 resets) in 5 ms. (20 steps per ms) remains 2258/2258 properties
BEST_FIRST walk for 124 steps (0 resets) in 6 ms. (17 steps per ms) remains 2258/2258 properties
BEST_FIRST walk for 124 steps (0 resets) in 6 ms. (17 steps per ms) remains 2258/2258 properties
BEST_FIRST walk for 124 steps (0 resets) in 6 ms. (17 steps per ms) remains 2258/2258 properties
BEST_FIRST walk for 124 steps (0 resets) in 4 ms. (24 steps per ms) remains 2258/2258 properties
BEST_FIRST walk for 124 steps (0 resets) in 4 ms. (24 steps per ms) remains 2258/2258 properties
BEST_FIRST walk for 124 steps (0 resets) in 8 ms. (13 steps per ms) remains 2258/2258 properties
BEST_FIRST walk for 124 steps (0 resets) in 4 ms. (24 steps per ms) remains 2258/2258 properties
BEST_FIRST walk for 124 steps (0 resets) in 4 ms. (24 steps per ms) remains 2258/2258 properties
BEST_FIRST walk for 124 steps (0 resets) in 4 ms. (24 steps per ms) remains 2258/2258 properties
BEST_FIRST walk for 124 steps (0 resets) in 4 ms. (24 steps per ms) remains 2258/2258 properties
BEST_FIRST walk for 124 steps (0 resets) in 7 ms. (15 steps per ms) remains 2258/2258 properties
BEST_FIRST walk for 124 steps (0 resets) in 7 ms. (15 steps per ms) remains 2258/2258 properties
BEST_FIRST walk for 124 steps (0 resets) in 7 ms. (15 steps per ms) remains 2258/2258 properties
BEST_FIRST walk for 124 steps (0 resets) in 7 ms. (15 steps per ms) remains 2258/2258 properties
BEST_FIRST walk for 124 steps (0 resets) in 5 ms. (20 steps per ms) remains 2258/2258 properties
BEST_FIRST walk for 124 steps (0 resets) in 5 ms. (20 steps per ms) remains 2258/2258 properties
BEST_FIRST walk for 124 steps (0 resets) in 5 ms. (20 steps per ms) remains 2258/2258 properties
BEST_FIRST walk for 124 steps (0 resets) in 6 ms. (17 steps per ms) remains 2258/2258 properties
BEST_FIRST walk for 124 steps (0 resets) in 6 ms. (17 steps per ms) remains 2258/2258 properties
BEST_FIRST walk for 124 steps (0 resets) in 5 ms. (20 steps per ms) remains 2258/2258 properties
BEST_FIRST walk for 124 steps (0 resets) in 7 ms. (15 steps per ms) remains 2258/2258 properties
BEST_FIRST walk for 124 steps (0 resets) in 7 ms. (15 steps per ms) remains 2258/2258 properties
BEST_FIRST walk for 124 steps (0 resets) in 7 ms. (15 steps per ms) remains 2258/2258 properties
BEST_FIRST walk for 124 steps (0 resets) in 5 ms. (20 steps per ms) remains 2258/2258 properties
BEST_FIRST walk for 124 steps (0 resets) in 4 ms. (24 steps per ms) remains 2258/2258 properties
BEST_FIRST walk for 124 steps (0 resets) in 5 ms. (20 steps per ms) remains 2258/2258 properties
BEST_FIRST walk for 124 steps (0 resets) in 7 ms. (15 steps per ms) remains 2258/2258 properties
BEST_FIRST walk for 124 steps (0 resets) in 5 ms. (20 steps per ms) remains 2258/2258 properties
BEST_FIRST walk for 124 steps (0 resets) in 4 ms. (24 steps per ms) remains 2258/2258 properties
BEST_FIRST walk for 124 steps (0 resets) in 4 ms. (24 steps per ms) remains 2258/2258 properties
BEST_FIRST walk for 124 steps (0 resets) in 7 ms. (15 steps per ms) remains 2258/2258 properties
BEST_FIRST walk for 124 steps (0 resets) in 7 ms. (15 steps per ms) remains 2258/2258 properties
BEST_FIRST walk for 124 steps (0 resets) in 8 ms. (13 steps per ms) remains 2258/2258 properties
BEST_FIRST walk for 124 steps (0 resets) in 5 ms. (20 steps per ms) remains 2258/2258 properties
// Phase 1: matrix 16200 rows 8481 cols
[2024-06-01 05:41:30] [INFO ] Computed 281 invariants in 263 ms
At refinement iteration 0 (INCLUDED_ONLY) 0/2258 variables, 2258/2258 constraints. Problems are: Problem set: 0 solved, 2258 unsolved
Solver is answering 'unknown', stopping.
After SMT solving in domain Real declared 2258/24681 variables, and 2258 constraints, problems are : Problem set: 0 solved, 2258 unsolved in 5135 ms.
Refiners :[Domain max(s): 2258/8481 constraints, Positive P Invariants (semi-flows): 0/181 constraints, Generalized P Invariants (flows): 0/100 constraints, State Equation: 0/8481 constraints, PredecessorRefiner: 2258/2258 constraints, Known Traps: 0/0 constraints]
Escalating to Integer solving :Problem set: 0 solved, 2258 unsolved
At refinement iteration 0 (INCLUDED_ONLY) 0/2258 variables, 2258/2258 constraints. Problems are: Problem set: 0 solved, 2258 unsolved
Solver is answering 'unknown', stopping.
After SMT solving in domain Int declared 2258/24681 variables, and 2258 constraints, problems are : Problem set: 0 solved, 2258 unsolved in 5033 ms.
Refiners :[Domain max(s): 2258/8481 constraints, Positive P Invariants (semi-flows): 0/181 constraints, Generalized P Invariants (flows): 0/100 constraints, State Equation: 0/8481 constraints, PredecessorRefiner: 0/2258 constraints, Known Traps: 0/0 constraints]
After SMT, in 13814ms problems are : Problem set: 0 solved, 2258 unsolved
Skipping Parikh replay, no witness traces provided.
Support contains 2258 out of 8481 places. Attempting structural reductions.
Starting structural reductions in REACHABILITY mode, iteration 0 : 8481/8481 places, 16200/16200 transitions.
Drop transitions (Trivial Post-Agglo cleanup.) removed 5742 transitions
Trivial Post-agglo rules discarded 5742 transitions
Performed 5742 trivial Post agglomeration. Transition count delta: 5742
Iterating post reduction 0 with 5742 rules applied. Total rules applied 5742 place count 8481 transition count 10458
Reduce places removed 5742 places and 0 transitions.
Iterating post reduction 1 with 5742 rules applied. Total rules applied 11484 place count 2739 transition count 10458
Applied a total of 11484 rules in 588 ms. Remains 2739 /8481 variables (removed 5742) and now considering 10458/16200 (removed 5742) transitions.
Finished structural reductions in REACHABILITY mode , in 1 iterations and 598 ms. Remains : 2739/8481 places, 10458/16200 transitions.
RANDOM walk for 313541 steps (0 resets) in 14274 ms. (21 steps per ms) remains 0/2258 properties
Able to resolve query StableMarking after proving 8481 properties.
FORMULA StableMarking FALSE TECHNIQUES RANDOM_WALK TOPOLOGICAL
Total runtime 23637 ms.
ITS solved all properties within timeout
BK_STOP 1717220508984
--------------------
content from stderr:
+ ulimit -s 65536
+ [[ -z '' ]]
+ export LTSMIN_MEM_SIZE=8589934592
+ LTSMIN_MEM_SIZE=8589934592
+ export PYTHONPATH=/home/mcc/BenchKit/itstools/pylibs
+ PYTHONPATH=/home/mcc/BenchKit/itstools/pylibs
+ export LD_LIBRARY_PATH=/home/mcc/BenchKit/itstools/pylibs:
+ LD_LIBRARY_PATH=/home/mcc/BenchKit/itstools/pylibs:
++ sed s/.jar//
++ perl -pe 's/.*\.//g'
++ ls /home/mcc/BenchKit/bin//../reducer/bin//../../itstools//itstools/plugins/fr.lip6.move.gal.application.pnmcc_1.0.0.202405141337.jar
+ VERSION=202405141337
+ echo 'Running Version 202405141337'
+ /home/mcc/BenchKit/bin//../reducer/bin//../../itstools//itstools/its-tools -pnfolder /home/mcc/execution -examination StableMarking -timeout 180 -rebuildPNML
Sequence of Actions to be Executed by the VM
This is useful if one wants to reexecute the tool in the VM from the submitted image disk.
set -x
# this is for BenchKit: configuration of major elements for the test
export BK_INPUT="ServersAndClients-PT-100080"
export BK_EXAMINATION="StableMarking"
export BK_TOOL="ltsminxred"
export BK_RESULT_DIR="/tmp/BK_RESULTS/OUTPUTS"
export BK_TIME_CONFINEMENT="1800"
export BK_MEMORY_CONFINEMENT="16384"
export BK_BIN_PATH="/home/mcc/BenchKit/bin/"
# this is specific to your benchmark or test
export BIN_DIR="$HOME/BenchKit/bin"
# remove the execution directoty if it exists (to avoid increse of .vmdk images)
if [ -d execution ] ; then
rm -rf execution
fi
# this is for BenchKit: explicit launching of the test
echo "====================================================================="
echo " Generated by BenchKit 2-5568"
echo " Executing tool ltsminxred"
echo " Input is ServersAndClients-PT-100080, examination is StableMarking"
echo " Time confinement is $BK_TIME_CONFINEMENT seconds"
echo " Memory confinement is 16384 MBytes"
echo " Number of cores is 4"
echo " Run identifier is r526-tall-171679094600393"
echo "====================================================================="
echo
echo "--------------------"
echo "preparation of the directory to be used:"
tar xzf /home/mcc/BenchKit/INPUTS/ServersAndClients-PT-100080.tgz
mv ServersAndClients-PT-100080 execution
cd execution
if [ "StableMarking" = "ReachabilityDeadlock" ] || [ "StableMarking" = "UpperBounds" ] || [ "StableMarking" = "QuasiLiveness" ] || [ "StableMarking" = "StableMarking" ] || [ "StableMarking" = "Liveness" ] || [ "StableMarking" = "OneSafe" ] || [ "StableMarking" = "StateSpace" ]; then
rm -f GenericPropertiesVerdict.xml
fi
pwd
ls -lh
echo
echo "--------------------"
echo "content from stdout:"
echo
echo "=== Data for post analysis generated by BenchKit (invocation template)"
echo
if [ "StableMarking" = "UpperBounds" ] ; then
echo "The expected result is a vector of positive values"
echo NUM_VECTOR
elif [ "StableMarking" != "StateSpace" ] ; then
echo "The expected result is a vector of booleans"
echo BOOL_VECTOR
else
echo "no data necessary for post analysis"
fi
echo
if [ -f "StableMarking.txt" ] ; then
echo "here is the order used to build the result vector(from text file)"
for x in $(grep Property StableMarking.txt | cut -d ' ' -f 2 | sort -u) ; do
echo "FORMULA_NAME $x"
done
elif [ -f "StableMarking.xml" ] ; then # for cunf (txt files deleted;-)
echo echo "here is the order used to build the result vector(from xml file)"
for x in $(grep '
echo "FORMULA_NAME $x"
done
elif [ "StableMarking" = "ReachabilityDeadlock" ] || [ "StableMarking" = "QuasiLiveness" ] || [ "StableMarking" = "StableMarking" ] || [ "StableMarking" = "Liveness" ] || [ "StableMarking" = "OneSafe" ] ; then
echo "FORMULA_NAME StableMarking"
fi
echo
echo "=== Now, execution of the tool begins"
echo
echo -n "BK_START "
date -u +%s%3N
echo
timeout -s 9 $BK_TIME_CONFINEMENT bash -c "/home/mcc/BenchKit/BenchKit_head.sh 2> STDERR ; echo ; echo -n \"BK_STOP \" ; date -u +%s%3N"
if [ $? -eq 137 ] ; then
echo
echo "BK_TIME_CONFINEMENT_REACHED"
fi
echo
echo "--------------------"
echo "content from stderr:"
echo
cat STDERR ;