

About the Execution of LTSMin+red for CANConstruction-PT-080
| Execution Summary | |||||
| Max Memory Used (MB) |
Time wait (ms) | CPU Usage (ms) | I/O Wait (ms) | Computed Result | Execution Status |
| 2801.567 | 66507.00 | 167533.00 | 226.00 | F | normal |
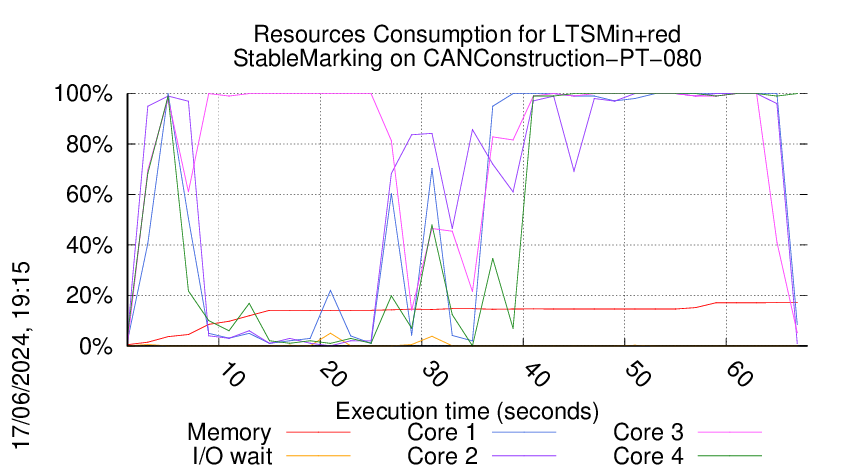
Execution Chart
We display below the execution chart for this examination (boot time has been removed).
Trace from the execution
Formatting '/data/fkordon/mcc2024-input.r478-tall-171620515700043.qcow2', fmt=qcow2 size=4294967296 backing_file=/data/fkordon/mcc2024-input.qcow2 backing_fmt=qcow2 cluster_size=65536 lazy_refcounts=off refcount_bits=16
Waiting for the VM to be ready (probing ssh)
......................................................................................................................................................................................................................................................................................................................................................................................................................................................................................................................................................................................................................................................................................................................................................................................................................................................................................................................................................................................................................................................................................................................................................................................................................................................................................................................................................................................................................................................................................................................................................................................................................................................................................................................................................................................................................................................................................................................................................
=====================================================================
Generated by BenchKit 2-5568
Executing tool ltsminxred
Input is CANConstruction-PT-080, examination is StableMarking
Time confinement is 1800 seconds
Memory confinement is 16384 MBytes
Number of cores is 4
Run identifier is r478-tall-171620515700043
=====================================================================
--------------------
preparation of the directory to be used:
/home/mcc/execution
total 9.9M
-rw-r--r-- 1 mcc users 9.8K May 14 13:22 CTLCardinality.txt
-rw-r--r-- 1 mcc users 83K May 14 13:22 CTLCardinality.xml
-rw-r--r-- 1 mcc users 6.6K May 14 13:22 CTLFireability.txt
-rw-r--r-- 1 mcc users 46K May 14 13:22 CTLFireability.xml
-rw-r--r-- 1 mcc users 4.2K May 19 07:07 LTLCardinality.txt
-rw-r--r-- 1 mcc users 23K May 19 15:32 LTLCardinality.xml
-rw-r--r-- 1 mcc users 3.2K Apr 22 14:31 LTLFireability.txt
-rw-r--r-- 1 mcc users 20K Apr 22 14:31 LTLFireability.xml
-rw-r--r-- 1 mcc users 15K Apr 12 20:28 ReachabilityCardinality.txt
-rw-r--r-- 1 mcc users 114K Apr 12 20:28 ReachabilityCardinality.xml
-rw-r--r-- 1 mcc users 5.1K Apr 12 20:04 ReachabilityFireability.txt
-rw-r--r-- 1 mcc users 26K Apr 12 20:04 ReachabilityFireability.xml
-rw-r--r-- 1 mcc users 1.9K Apr 22 14:31 UpperBounds.txt
-rw-r--r-- 1 mcc users 4.0K Apr 22 14:31 UpperBounds.xml
-rw-r--r-- 1 mcc users 6 May 18 16:42 equiv_col
-rw-r--r-- 1 mcc users 4 May 18 16:42 instance
-rw-r--r-- 1 mcc users 6 May 18 16:42 iscolored
-rw-r--r-- 1 mcc users 9.5M May 18 16:42 model.pnml
--------------------
content from stdout:
=== Data for post analysis generated by BenchKit (invocation template)
The expected result is a vector of booleans
BOOL_VECTOR
FORMULA_NAME StableMarking
=== Now, execution of the tool begins
BK_START 1717178306221
Invoking MCC driver with
BK_TOOL=ltsminxred
BK_EXAMINATION=StableMarking
BK_BIN_PATH=/home/mcc/BenchKit/bin/
BK_TIME_CONFINEMENT=1800
BK_INPUT=CANConstruction-PT-080
BK_MEMORY_CONFINEMENT=16384
Applying reductions before tool ltsmin
Invoking reducer
Running Version 202405141337
[2024-05-31 17:58:27] [INFO ] Running its-tools with arguments : [-pnfolder, /home/mcc/execution, -examination, StableMarking, -timeout, 180, -rebuildPNML]
[2024-05-31 17:58:27] [INFO ] Parsing pnml file : /home/mcc/execution/model.pnml
[2024-05-31 17:58:28] [INFO ] Load time of PNML (sax parser for PT used): 557 ms
[2024-05-31 17:58:28] [INFO ] Transformed 13762 places.
[2024-05-31 17:58:28] [INFO ] Transformed 26240 transitions.
[2024-05-31 17:58:28] [INFO ] Parsed PT model containing 13762 places and 26240 transitions and 78400 arcs in 777 ms.
RANDOM walk for 40000 steps (25 resets) in 6668 ms. (5 steps per ms) remains 7523/13762 properties
BEST_FIRST walk for 124 steps (0 resets) in 38 ms. (3 steps per ms) remains 7523/7523 properties
BEST_FIRST walk for 124 steps (0 resets) in 43 ms. (2 steps per ms) remains 7523/7523 properties
BEST_FIRST walk for 124 steps (0 resets) in 41 ms. (2 steps per ms) remains 7523/7523 properties
BEST_FIRST walk for 124 steps (0 resets) in 9 ms. (12 steps per ms) remains 7523/7523 properties
BEST_FIRST walk for 124 steps (0 resets) in 28 ms. (4 steps per ms) remains 7523/7523 properties
BEST_FIRST walk for 124 steps (0 resets) in 20 ms. (5 steps per ms) remains 7523/7523 properties
BEST_FIRST walk for 124 steps (0 resets) in 32 ms. (3 steps per ms) remains 7523/7523 properties
BEST_FIRST walk for 124 steps (0 resets) in 12 ms. (9 steps per ms) remains 7523/7523 properties
BEST_FIRST walk for 124 steps (0 resets) in 9 ms. (12 steps per ms) remains 7523/7523 properties
BEST_FIRST walk for 124 steps (0 resets) in 8 ms. (13 steps per ms) remains 7523/7523 properties
BEST_FIRST walk for 124 steps (0 resets) in 9 ms. (12 steps per ms) remains 7523/7523 properties
BEST_FIRST walk for 124 steps (0 resets) in 5 ms. (20 steps per ms) remains 7523/7523 properties
BEST_FIRST walk for 124 steps (0 resets) in 8 ms. (13 steps per ms) remains 7523/7523 properties
BEST_FIRST walk for 124 steps (0 resets) in 8 ms. (13 steps per ms) remains 7523/7523 properties
BEST_FIRST walk for 124 steps (0 resets) in 4 ms. (24 steps per ms) remains 7523/7523 properties
BEST_FIRST walk for 124 steps (0 resets) in 11 ms. (10 steps per ms) remains 7523/7523 properties
BEST_FIRST walk for 124 steps (0 resets) in 8 ms. (13 steps per ms) remains 7523/7523 properties
BEST_FIRST walk for 124 steps (0 resets) in 4 ms. (24 steps per ms) remains 7523/7523 properties
BEST_FIRST walk for 124 steps (0 resets) in 4 ms. (24 steps per ms) remains 7523/7523 properties
BEST_FIRST walk for 124 steps (0 resets) in 11 ms. (10 steps per ms) remains 7523/7523 properties
BEST_FIRST walk for 124 steps (0 resets) in 8 ms. (13 steps per ms) remains 7523/7523 properties
BEST_FIRST walk for 124 steps (0 resets) in 4 ms. (24 steps per ms) remains 7523/7523 properties
BEST_FIRST walk for 124 steps (0 resets) in 8 ms. (13 steps per ms) remains 7523/7523 properties
BEST_FIRST walk for 124 steps (0 resets) in 8 ms. (13 steps per ms) remains 7523/7523 properties
BEST_FIRST walk for 124 steps (0 resets) in 8 ms. (13 steps per ms) remains 7523/7523 properties
BEST_FIRST walk for 124 steps (0 resets) in 12 ms. (9 steps per ms) remains 7523/7523 properties
BEST_FIRST walk for 124 steps (0 resets) in 8 ms. (13 steps per ms) remains 7523/7523 properties
BEST_FIRST walk for 124 steps (0 resets) in 4 ms. (24 steps per ms) remains 7523/7523 properties
BEST_FIRST walk for 124 steps (0 resets) in 4 ms. (24 steps per ms) remains 7523/7523 properties
BEST_FIRST walk for 124 steps (0 resets) in 4 ms. (24 steps per ms) remains 7523/7523 properties
BEST_FIRST walk for 124 steps (0 resets) in 5 ms. (20 steps per ms) remains 7523/7523 properties
BEST_FIRST walk for 124 steps (0 resets) in 8 ms. (13 steps per ms) remains 7523/7523 properties
BEST_FIRST walk for 124 steps (0 resets) in 7 ms. (15 steps per ms) remains 7523/7523 properties
BEST_FIRST walk for 124 steps (0 resets) in 7 ms. (15 steps per ms) remains 7523/7523 properties
BEST_FIRST walk for 124 steps (0 resets) in 7 ms. (15 steps per ms) remains 7523/7523 properties
BEST_FIRST walk for 124 steps (0 resets) in 9 ms. (12 steps per ms) remains 7523/7523 properties
BEST_FIRST walk for 124 steps (0 resets) in 5 ms. (20 steps per ms) remains 7523/7523 properties
BEST_FIRST walk for 124 steps (0 resets) in 8 ms. (13 steps per ms) remains 7523/7523 properties
BEST_FIRST walk for 124 steps (0 resets) in 8 ms. (13 steps per ms) remains 7523/7523 properties
BEST_FIRST walk for 124 steps (0 resets) in 5 ms. (20 steps per ms) remains 7523/7523 properties
BEST_FIRST walk for 124 steps (0 resets) in 5 ms. (20 steps per ms) remains 7523/7523 properties
BEST_FIRST walk for 124 steps (0 resets) in 8 ms. (13 steps per ms) remains 7523/7523 properties
BEST_FIRST walk for 124 steps (0 resets) in 7 ms. (15 steps per ms) remains 7523/7523 properties
BEST_FIRST walk for 124 steps (0 resets) in 5 ms. (20 steps per ms) remains 7523/7523 properties
BEST_FIRST walk for 124 steps (0 resets) in 7 ms. (15 steps per ms) remains 7523/7523 properties
BEST_FIRST walk for 124 steps (0 resets) in 5 ms. (20 steps per ms) remains 7523/7523 properties
BEST_FIRST walk for 124 steps (0 resets) in 6 ms. (17 steps per ms) remains 7523/7523 properties
BEST_FIRST walk for 124 steps (0 resets) in 8 ms. (13 steps per ms) remains 7523/7523 properties
BEST_FIRST walk for 124 steps (0 resets) in 8 ms. (13 steps per ms) remains 7523/7523 properties
BEST_FIRST walk for 124 steps (0 resets) in 8 ms. (13 steps per ms) remains 7523/7523 properties
// Phase 1: matrix 26240 rows 13762 cols
[2024-05-31 17:58:31] [INFO ] Computed 161 invariants in 353 ms
[2024-05-31 17:58:31] [INFO ] State equation strengthened by 12720 read => feed constraints.
Error getting values : (error "ParserException while parsing response: (timeout
org.smtlib.IParser$ParserException: Unbalanced parentheses at end of input")
Solver is answering 'unknown', stopping.
After SMT solving in domain Real declared 7523/40002 variables, and 0 constraints, problems are : Problem set: 0 solved, 7523 unsolved in 5185 ms.
Refiners :[Positive P Invariants (semi-flows): 0/81 constraints, Generalized P Invariants (flows): 0/80 constraints, State Equation: 0/13762 constraints, ReadFeed: 0/12720 constraints, PredecessorRefiner: 7523/7523 constraints, Known Traps: 0/0 constraints]
Escalating to Integer solving :Problem set: 0 solved, 7523 unsolved
Solver is answering 'unknown', stopping.
After SMT solving in domain Int declared 7523/40002 variables, and 0 constraints, problems are : Problem set: 0 solved, 7523 unsolved in 5092 ms.
Refiners :[Positive P Invariants (semi-flows): 0/81 constraints, Generalized P Invariants (flows): 0/80 constraints, State Equation: 0/13762 constraints, ReadFeed: 0/12720 constraints, PredecessorRefiner: 0/7523 constraints, Known Traps: 0/0 constraints]
After SMT, in 30535ms problems are : Problem set: 0 solved, 7523 unsolved
Skipping Parikh replay, no witness traces provided.
Support contains 7523 out of 13762 places. Attempting structural reductions.
Starting structural reductions in REACHABILITY mode, iteration 0 : 13762/13762 places, 26240/26240 transitions.
Drop transitions (Trivial Post-Agglo cleanup.) removed 320 transitions
Trivial Post-agglo rules discarded 320 transitions
Performed 320 trivial Post agglomeration. Transition count delta: 320
Iterating post reduction 0 with 320 rules applied. Total rules applied 320 place count 13762 transition count 25920
Reduce places removed 320 places and 0 transitions.
Performed 2 Post agglomeration using F-continuation condition.Transition count delta: 2
Iterating post reduction 1 with 322 rules applied. Total rules applied 642 place count 13442 transition count 25918
Reduce places removed 2 places and 0 transitions.
Iterating post reduction 2 with 2 rules applied. Total rules applied 644 place count 13440 transition count 25918
Discarding 2498 places :
Symmetric choice reduction at 3 with 2498 rule applications. Total rules 3142 place count 10942 transition count 20922
Iterating global reduction 3 with 2498 rules applied. Total rules applied 5640 place count 10942 transition count 20922
Performed 80 Post agglomeration using F-continuation condition.Transition count delta: 80
Deduced a syphon composed of 80 places in 9 ms
Reduce places removed 80 places and 0 transitions.
Iterating global reduction 3 with 160 rules applied. Total rules applied 5800 place count 10862 transition count 20842
Free-agglomeration rule (complex) applied 4 times.
Iterating global reduction 3 with 4 rules applied. Total rules applied 5804 place count 10862 transition count 20838
Reduce places removed 4 places and 0 transitions.
Iterating post reduction 3 with 4 rules applied. Total rules applied 5808 place count 10858 transition count 20838
Partial Free-agglomeration rule applied 160 times.
Drop transitions (Partial Free agglomeration) removed 160 transitions
Iterating global reduction 4 with 160 rules applied. Total rules applied 5968 place count 10858 transition count 20838
Applied a total of 5968 rules in 3029 ms. Remains 10858 /13762 variables (removed 2904) and now considering 20838/26240 (removed 5402) transitions.
Finished structural reductions in REACHABILITY mode , in 1 iterations and 3042 ms. Remains : 10858/13762 places, 20838/26240 transitions.
RANDOM walk for 1092959 steps (1673 resets) in 105272 ms. (10 steps per ms) remains 0/7523 properties
Able to resolve query StableMarking after proving 13762 properties.
FORMULA StableMarking FALSE TECHNIQUES RANDOM_WALK TOPOLOGICAL
Total runtime 65248 ms.
ITS solved all properties within timeout
BK_STOP 1717178372728
--------------------
content from stderr:
+ ulimit -s 65536
+ [[ -z '' ]]
+ export LTSMIN_MEM_SIZE=8589934592
+ LTSMIN_MEM_SIZE=8589934592
+ export PYTHONPATH=/home/mcc/BenchKit/itstools/pylibs
+ PYTHONPATH=/home/mcc/BenchKit/itstools/pylibs
+ export LD_LIBRARY_PATH=/home/mcc/BenchKit/itstools/pylibs:
+ LD_LIBRARY_PATH=/home/mcc/BenchKit/itstools/pylibs:
++ sed s/.jar//
++ perl -pe 's/.*\.//g'
++ ls /home/mcc/BenchKit/bin//../reducer/bin//../../itstools//itstools/plugins/fr.lip6.move.gal.application.pnmcc_1.0.0.202405141337.jar
+ VERSION=202405141337
+ echo 'Running Version 202405141337'
+ /home/mcc/BenchKit/bin//../reducer/bin//../../itstools//itstools/its-tools -pnfolder /home/mcc/execution -examination StableMarking -timeout 180 -rebuildPNML
Sequence of Actions to be Executed by the VM
This is useful if one wants to reexecute the tool in the VM from the submitted image disk.
set -x
# this is for BenchKit: configuration of major elements for the test
export BK_INPUT="CANConstruction-PT-080"
export BK_EXAMINATION="StableMarking"
export BK_TOOL="ltsminxred"
export BK_RESULT_DIR="/tmp/BK_RESULTS/OUTPUTS"
export BK_TIME_CONFINEMENT="1800"
export BK_MEMORY_CONFINEMENT="16384"
export BK_BIN_PATH="/home/mcc/BenchKit/bin/"
# this is specific to your benchmark or test
export BIN_DIR="$HOME/BenchKit/bin"
# remove the execution directoty if it exists (to avoid increse of .vmdk images)
if [ -d execution ] ; then
rm -rf execution
fi
# this is for BenchKit: explicit launching of the test
echo "====================================================================="
echo " Generated by BenchKit 2-5568"
echo " Executing tool ltsminxred"
echo " Input is CANConstruction-PT-080, examination is StableMarking"
echo " Time confinement is $BK_TIME_CONFINEMENT seconds"
echo " Memory confinement is 16384 MBytes"
echo " Number of cores is 4"
echo " Run identifier is r478-tall-171620515700043"
echo "====================================================================="
echo
echo "--------------------"
echo "preparation of the directory to be used:"
tar xzf /home/mcc/BenchKit/INPUTS/CANConstruction-PT-080.tgz
mv CANConstruction-PT-080 execution
cd execution
if [ "StableMarking" = "ReachabilityDeadlock" ] || [ "StableMarking" = "UpperBounds" ] || [ "StableMarking" = "QuasiLiveness" ] || [ "StableMarking" = "StableMarking" ] || [ "StableMarking" = "Liveness" ] || [ "StableMarking" = "OneSafe" ] || [ "StableMarking" = "StateSpace" ]; then
rm -f GenericPropertiesVerdict.xml
fi
pwd
ls -lh
echo
echo "--------------------"
echo "content from stdout:"
echo
echo "=== Data for post analysis generated by BenchKit (invocation template)"
echo
if [ "StableMarking" = "UpperBounds" ] ; then
echo "The expected result is a vector of positive values"
echo NUM_VECTOR
elif [ "StableMarking" != "StateSpace" ] ; then
echo "The expected result is a vector of booleans"
echo BOOL_VECTOR
else
echo "no data necessary for post analysis"
fi
echo
if [ -f "StableMarking.txt" ] ; then
echo "here is the order used to build the result vector(from text file)"
for x in $(grep Property StableMarking.txt | cut -d ' ' -f 2 | sort -u) ; do
echo "FORMULA_NAME $x"
done
elif [ -f "StableMarking.xml" ] ; then # for cunf (txt files deleted;-)
echo echo "here is the order used to build the result vector(from xml file)"
for x in $(grep '
echo "FORMULA_NAME $x"
done
elif [ "StableMarking" = "ReachabilityDeadlock" ] || [ "StableMarking" = "QuasiLiveness" ] || [ "StableMarking" = "StableMarking" ] || [ "StableMarking" = "Liveness" ] || [ "StableMarking" = "OneSafe" ] ; then
echo "FORMULA_NAME StableMarking"
fi
echo
echo "=== Now, execution of the tool begins"
echo
echo -n "BK_START "
date -u +%s%3N
echo
timeout -s 9 $BK_TIME_CONFINEMENT bash -c "/home/mcc/BenchKit/BenchKit_head.sh 2> STDERR ; echo ; echo -n \"BK_STOP \" ; date -u +%s%3N"
if [ $? -eq 137 ] ; then
echo
echo "BK_TIME_CONFINEMENT_REACHED"
fi
echo
echo "--------------------"
echo "content from stderr:"
echo
cat STDERR ;