

About the Execution of LTSMin+red for BugTracking-PT-q8m256
| Execution Summary | |||||
| Max Memory Used (MB) |
Time wait (ms) | CPU Usage (ms) | I/O Wait (ms) | Computed Result | Execution Status |
| 16203.899 | 959379.00 | 3226274.00 | 292.70 | FTTFFTFTFTTFFFFF | normal |
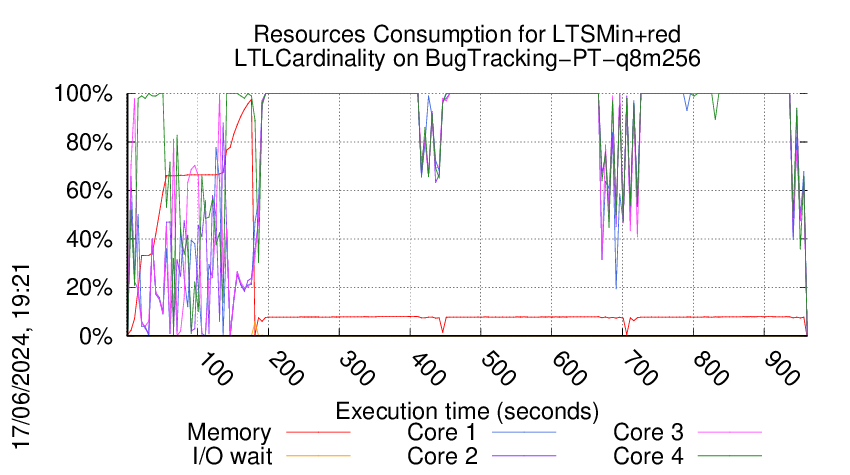
Execution Chart
We display below the execution chart for this examination (boot time has been removed).
Trace from the execution
Formatting '/mnt/tpsp/fkordon/mcc2024-input.r472-tajo-171620399500443.qcow2', fmt=qcow2 size=4294967296 backing_file='/mnt/tpsp/fkordon/mcc2024-input.qcow2' backing_fmt='qcow2' encryption=off cluster_size=65536 lazy_refcounts=off
Waiting for the VM to be ready (probing ssh)
..........................................................................................................................................................................................................................................................................................................................................................................................................................................................................................................................................................................................................................................................................................................................................................................................................................................................................................................................................................................................................................................................................................................................................................................................................................................................................................................................................................................................................
=====================================================================
Generated by BenchKit 2-5568
Executing tool ltsminxred
Input is BugTracking-PT-q8m256, examination is LTLCardinality
Time confinement is 3600 seconds
Memory confinement is 16384 MBytes
Number of cores is 4
Run identifier is r472-tajo-171620399500443
=====================================================================
--------------------
preparation of the directory to be used:
/home/mcc/execution
total 16M
-rw-r--r-- 1 mcc users 8.7K May 14 13:22 CTLCardinality.txt
-rw-r--r-- 1 mcc users 79K May 14 13:22 CTLCardinality.xml
-rw-r--r-- 1 mcc users 6.2K May 14 13:22 CTLFireability.txt
-rw-r--r-- 1 mcc users 57K May 14 13:22 CTLFireability.xml
-rw-r--r-- 1 mcc users 4.7K May 19 07:06 LTLCardinality.txt
-rw-r--r-- 1 mcc users 28K May 19 15:30 LTLCardinality.xml
-rw-r--r-- 1 mcc users 2.5K Apr 22 14:30 LTLFireability.txt
-rw-r--r-- 1 mcc users 19K Apr 22 14:30 LTLFireability.xml
-rw-r--r-- 1 mcc users 15K May 14 13:22 ReachabilityCardinality.txt
-rw-r--r-- 1 mcc users 125K May 14 13:22 ReachabilityCardinality.xml
-rw-r--r-- 1 mcc users 11K May 14 13:22 ReachabilityFireability.txt
-rw-r--r-- 1 mcc users 91K May 14 13:22 ReachabilityFireability.xml
-rw-r--r-- 1 mcc users 1.7K May 19 07:10 UpperBounds.txt
-rw-r--r-- 1 mcc users 3.9K May 19 15:24 UpperBounds.xml
-rw-r--r-- 1 mcc users 6 May 18 16:42 equiv_col
-rw-r--r-- 1 mcc users 7 May 18 16:42 instance
-rw-r--r-- 1 mcc users 6 May 18 16:42 iscolored
-rw-r--r-- 1 mcc users 16M May 18 16:42 model.pnml
--------------------
content from stdout:
=== Data for post analysis generated by BenchKit (invocation template)
The expected result is a vector of booleans
BOOL_VECTOR
here is the order used to build the result vector(from text file)
FORMULA_NAME BugTracking-PT-q8m256-LTLCardinality-00
FORMULA_NAME BugTracking-PT-q8m256-LTLCardinality-01
FORMULA_NAME BugTracking-PT-q8m256-LTLCardinality-02
FORMULA_NAME BugTracking-PT-q8m256-LTLCardinality-03
FORMULA_NAME BugTracking-PT-q8m256-LTLCardinality-04
FORMULA_NAME BugTracking-PT-q8m256-LTLCardinality-05
FORMULA_NAME BugTracking-PT-q8m256-LTLCardinality-06
FORMULA_NAME BugTracking-PT-q8m256-LTLCardinality-07
FORMULA_NAME BugTracking-PT-q8m256-LTLCardinality-08
FORMULA_NAME BugTracking-PT-q8m256-LTLCardinality-09
FORMULA_NAME BugTracking-PT-q8m256-LTLCardinality-10
FORMULA_NAME BugTracking-PT-q8m256-LTLCardinality-11
FORMULA_NAME BugTracking-PT-q8m256-LTLCardinality-12
FORMULA_NAME BugTracking-PT-q8m256-LTLCardinality-13
FORMULA_NAME BugTracking-PT-q8m256-LTLCardinality-14
FORMULA_NAME BugTracking-PT-q8m256-LTLCardinality-15
=== Now, execution of the tool begins
BK_START 1717224749597
Invoking MCC driver with
BK_TOOL=ltsminxred
BK_EXAMINATION=LTLCardinality
BK_BIN_PATH=/home/mcc/BenchKit/bin/
BK_TIME_CONFINEMENT=3600
BK_INPUT=BugTracking-PT-q8m256
BK_MEMORY_CONFINEMENT=16384
Applying reductions before tool ltsmin
Invoking reducer
Running Version 202405141337
[2024-06-01 06:52:31] [INFO ] Running its-tools with arguments : [-pnfolder, /home/mcc/execution, -examination, LTLCardinality, -timeout, 360, -rebuildPNML]
[2024-06-01 06:52:31] [INFO ] Parsing pnml file : /home/mcc/execution/model.pnml
[2024-06-01 06:52:32] [INFO ] Load time of PNML (sax parser for PT used): 1202 ms
[2024-06-01 06:52:32] [INFO ] Transformed 754 places.
[2024-06-01 06:52:32] [INFO ] Transformed 27370 transitions.
[2024-06-01 06:52:32] [INFO ] Parsed PT model containing 754 places and 27370 transitions and 136172 arcs in 1481 ms.
Parsed 16 properties from file /home/mcc/execution/LTLCardinality.xml in 14 ms.
Working with output stream class java.io.PrintStream
Initial state reduction rules removed 3 formulas.
Deduced a syphon composed of 474 places in 83 ms
Reduce places removed 474 places and 23466 transitions.
FORMULA BugTracking-PT-q8m256-LTLCardinality-02 TRUE TECHNIQUES TOPOLOGICAL INITIAL_STATE
FORMULA BugTracking-PT-q8m256-LTLCardinality-03 FALSE TECHNIQUES TOPOLOGICAL INITIAL_STATE
FORMULA BugTracking-PT-q8m256-LTLCardinality-04 FALSE TECHNIQUES TOPOLOGICAL INITIAL_STATE
FORMULA BugTracking-PT-q8m256-LTLCardinality-05 TRUE TECHNIQUES TOPOLOGICAL INITIAL_STATE
FORMULA BugTracking-PT-q8m256-LTLCardinality-09 TRUE TECHNIQUES TOPOLOGICAL INITIAL_STATE
FORMULA BugTracking-PT-q8m256-LTLCardinality-11 FALSE TECHNIQUES TOPOLOGICAL INITIAL_STATE
FORMULA BugTracking-PT-q8m256-LTLCardinality-12 FALSE TECHNIQUES TOPOLOGICAL INITIAL_STATE
FORMULA BugTracking-PT-q8m256-LTLCardinality-13 FALSE TECHNIQUES TOPOLOGICAL INITIAL_STATE
FORMULA BugTracking-PT-q8m256-LTLCardinality-01 TRUE TECHNIQUES TOPOLOGICAL INITIAL_STATE
FORMULA BugTracking-PT-q8m256-LTLCardinality-07 TRUE TECHNIQUES TOPOLOGICAL INITIAL_STATE
FORMULA BugTracking-PT-q8m256-LTLCardinality-08 FALSE TECHNIQUES TOPOLOGICAL INITIAL_STATE
FORMULA BugTracking-PT-q8m256-LTLCardinality-14 FALSE TECHNIQUES TOPOLOGICAL INITIAL_STATE
Support contains 6 out of 280 places. Attempting structural reductions.
Starting structural reductions in LTL mode, iteration 0 : 280/280 places, 3904/3904 transitions.
Reduce places removed 1 places and 0 transitions.
Iterating post reduction 0 with 1 rules applied. Total rules applied 1 place count 279 transition count 3904
Discarding 1 places :
Symmetric choice reduction at 1 with 1 rule applications. Total rules 2 place count 278 transition count 3871
Iterating global reduction 1 with 1 rules applied. Total rules applied 3 place count 278 transition count 3871
Applied a total of 3 rules in 105 ms. Remains 278 /280 variables (removed 2) and now considering 3871/3904 (removed 33) transitions.
[2024-06-01 06:52:33] [INFO ] Flow matrix only has 3707 transitions (discarded 164 similar events)
// Phase 1: matrix 3707 rows 278 cols
[2024-06-01 06:52:33] [INFO ] Computed 9 invariants in 43 ms
[2024-06-01 06:52:34] [INFO ] Implicit Places using invariants in 889 ms returned []
[2024-06-01 06:52:34] [INFO ] Flow matrix only has 3707 transitions (discarded 164 similar events)
[2024-06-01 06:52:34] [INFO ] Invariant cache hit.
[2024-06-01 06:52:34] [INFO ] State equation strengthened by 282 read => feed constraints.
[2024-06-01 06:52:36] [INFO ] Implicit Places using invariants and state equation in 1976 ms returned []
Implicit Place search using SMT with State Equation took 2899 ms to find 0 implicit places.
Running 3869 sub problems to find dead transitions.
[2024-06-01 06:52:36] [INFO ] Flow matrix only has 3707 transitions (discarded 164 similar events)
[2024-06-01 06:52:36] [INFO ] Invariant cache hit.
[2024-06-01 06:52:36] [INFO ] State equation strengthened by 282 read => feed constraints.
At refinement iteration 0 (INCLUDED_ONLY) 0/276 variables, 8/8 constraints. Problems are: Problem set: 0 solved, 3869 unsolved
[2024-06-01 06:53:40] [INFO ] Deduced a trap composed of 9 places in 316 ms of which 12 ms to minimize.
[2024-06-01 06:53:40] [INFO ] Deduced a trap composed of 7 places in 80 ms of which 1 ms to minimize.
[2024-06-01 06:53:41] [INFO ] Deduced a trap composed of 11 places in 125 ms of which 2 ms to minimize.
Problem TDEAD784 is UNSAT
Problem TDEAD790 is UNSAT
Problem TDEAD796 is UNSAT
Problem TDEAD802 is UNSAT
Problem TDEAD808 is UNSAT
Problem TDEAD809 is UNSAT
Problem TDEAD810 is UNSAT
Problem TDEAD811 is UNSAT
Problem TDEAD812 is UNSAT
Problem TDEAD813 is UNSAT
Problem TDEAD814 is UNSAT
Problem TDEAD817 is UNSAT
Problem TDEAD818 is UNSAT
Problem TDEAD819 is UNSAT
Solver is answering 'unknown', stopping.
After SMT solving in domain Real declared 276/3985 variables, and 11 constraints, problems are : Problem set: 14 solved, 3855 unsolved in 30108 ms.
Refiners :[Positive P Invariants (semi-flows): 8/9 constraints, State Equation: 0/278 constraints, ReadFeed: 0/282 constraints, PredecessorRefiner: 3869/2672 constraints, Known Traps: 3/3 constraints]
Escalating to Integer solving :Problem set: 14 solved, 3855 unsolved
At refinement iteration 0 (INCLUDED_ONLY) 0/276 variables, 8/8 constraints. Problems are: Problem set: 14 solved, 3855 unsolved
Problem TDEAD2781 is UNSAT
Problem TDEAD2782 is UNSAT
Problem TDEAD2783 is UNSAT
Problem TDEAD2784 is UNSAT
Problem TDEAD2785 is UNSAT
Problem TDEAD2786 is UNSAT
Problem TDEAD2787 is UNSAT
Problem TDEAD2788 is UNSAT
Problem TDEAD2789 is UNSAT
Problem TDEAD2794 is UNSAT
Problem TDEAD2795 is UNSAT
Problem TDEAD2796 is UNSAT
Problem TDEAD2797 is UNSAT
Problem TDEAD2798 is UNSAT
Problem TDEAD2799 is UNSAT
Problem TDEAD2800 is UNSAT
Problem TDEAD2801 is UNSAT
Problem TDEAD2802 is UNSAT
Problem TDEAD2803 is UNSAT
Problem TDEAD2804 is UNSAT
Problem TDEAD2805 is UNSAT
At refinement iteration 1 (INCLUDED_ONLY) 0/276 variables, 3/11 constraints. Problems are: Problem set: 35 solved, 3834 unsolved
[2024-06-01 06:54:21] [INFO ] Deduced a trap composed of 23 places in 102 ms of which 8 ms to minimize.
Problem TDEAD2706 is UNSAT
Problem TDEAD2715 is UNSAT
Problem TDEAD2716 is UNSAT
Problem TDEAD2727 is UNSAT
Problem TDEAD2728 is UNSAT
[2024-06-01 06:54:22] [INFO ] Deduced a trap composed of 9 places in 138 ms of which 0 ms to minimize.
SMT process timed out in 105987ms, After SMT, problems are : Problem set: 35 solved, 3834 unsolved
Search for dead transitions found 40 dead transitions in 106055ms
Found 40 dead transitions using SMT.
Drop transitions (Dead Transitions using SMT only with invariants) removed 40 transitions
Dead transitions reduction (with SMT) removed 40 transitions
Starting structural reductions in LTL mode, iteration 1 : 278/280 places, 3831/3904 transitions.
Reduce places removed 10 places and 316 transitions.
Iterating post reduction 0 with 10 rules applied. Total rules applied 10 place count 268 transition count 3515
Reduce places removed 5 places and 152 transitions.
Iterating post reduction 1 with 5 rules applied. Total rules applied 15 place count 263 transition count 3363
Reduce places removed 2 places and 57 transitions.
Iterating post reduction 2 with 2 rules applied. Total rules applied 17 place count 261 transition count 3306
Reduce places removed 1 places and 32 transitions.
Iterating post reduction 3 with 1 rules applied. Total rules applied 18 place count 260 transition count 3274
Discarding 1 places :
Symmetric choice reduction at 4 with 1 rule applications. Total rules 19 place count 259 transition count 3249
Iterating global reduction 4 with 1 rules applied. Total rules applied 20 place count 259 transition count 3249
Applied a total of 20 rules in 48 ms. Remains 259 /278 variables (removed 19) and now considering 3249/3831 (removed 582) transitions.
[2024-06-01 06:54:22] [INFO ] Flow matrix only has 3119 transitions (discarded 130 similar events)
// Phase 1: matrix 3119 rows 259 cols
[2024-06-01 06:54:22] [INFO ] Computed 9 invariants in 11 ms
[2024-06-01 06:54:23] [INFO ] Implicit Places using invariants in 1105 ms returned []
[2024-06-01 06:54:23] [INFO ] Flow matrix only has 3119 transitions (discarded 130 similar events)
[2024-06-01 06:54:23] [INFO ] Invariant cache hit.
[2024-06-01 06:54:23] [INFO ] State equation strengthened by 250 read => feed constraints.
[2024-06-01 06:54:25] [INFO ] Implicit Places using invariants and state equation in 2007 ms returned []
Implicit Place search using SMT with State Equation took 3129 ms to find 0 implicit places.
Starting structural reductions in LTL mode, iteration 2 : 259/280 places, 3249/3904 transitions.
Finished structural reductions in LTL mode , in 2 iterations and 112306 ms. Remains : 259/280 places, 3249/3904 transitions.
Support contains 6 out of 259 places after structural reductions.
[2024-06-01 06:54:26] [INFO ] Flatten gal took : 486 ms
[2024-06-01 06:54:26] [INFO ] Flatten gal took : 157 ms
[2024-06-01 06:54:26] [INFO ] Input system was already deterministic with 3249 transitions.
RANDOM walk for 40027 steps (23 resets) in 2259 ms. (17 steps per ms) remains 2/5 properties
BEST_FIRST walk for 40004 steps (8 resets) in 342 ms. (116 steps per ms) remains 2/2 properties
BEST_FIRST walk for 40003 steps (8 resets) in 262 ms. (152 steps per ms) remains 2/2 properties
[2024-06-01 06:54:27] [INFO ] Flow matrix only has 3119 transitions (discarded 130 similar events)
[2024-06-01 06:54:27] [INFO ] Invariant cache hit.
[2024-06-01 06:54:27] [INFO ] State equation strengthened by 250 read => feed constraints.
All remaining problems are real, not stopping.
At refinement iteration 0 (INCLUDED_ONLY) 0/3 variables, 0/0 constraints. Problems are: Problem set: 0 solved, 2 unsolved
At refinement iteration 1 (OVERLAPS) 31/34 variables, 1/1 constraints. Problems are: Problem set: 0 solved, 2 unsolved
At refinement iteration 2 (INCLUDED_ONLY) 0/34 variables, 0/1 constraints. Problems are: Problem set: 0 solved, 2 unsolved
At refinement iteration 3 (OVERLAPS) 905/939 variables, 34/35 constraints. Problems are: Problem set: 0 solved, 2 unsolved
At refinement iteration 4 (INCLUDED_ONLY) 0/939 variables, 2/37 constraints. Problems are: Problem set: 0 solved, 2 unsolved
At refinement iteration 5 (INCLUDED_ONLY) 0/939 variables, 0/37 constraints. Problems are: Problem set: 0 solved, 2 unsolved
At refinement iteration 6 (OVERLAPS) 1159/2098 variables, 49/86 constraints. Problems are: Problem set: 0 solved, 2 unsolved
At refinement iteration 7 (INCLUDED_ONLY) 0/2098 variables, 1/87 constraints. Problems are: Problem set: 0 solved, 2 unsolved
At refinement iteration 8 (INCLUDED_ONLY) 0/2098 variables, 146/233 constraints. Problems are: Problem set: 0 solved, 2 unsolved
At refinement iteration 9 (INCLUDED_ONLY) 0/2098 variables, 0/233 constraints. Problems are: Problem set: 0 solved, 2 unsolved
At refinement iteration 10 (OVERLAPS) 8/2106 variables, 3/236 constraints. Problems are: Problem set: 0 solved, 2 unsolved
At refinement iteration 11 (INCLUDED_ONLY) 0/2106 variables, 3/239 constraints. Problems are: Problem set: 0 solved, 2 unsolved
At refinement iteration 12 (INCLUDED_ONLY) 0/2106 variables, 0/239 constraints. Problems are: Problem set: 0 solved, 2 unsolved
At refinement iteration 13 (OVERLAPS) 1217/3323 variables, 142/381 constraints. Problems are: Problem set: 0 solved, 2 unsolved
At refinement iteration 14 (INCLUDED_ONLY) 0/3323 variables, 2/383 constraints. Problems are: Problem set: 0 solved, 2 unsolved
At refinement iteration 15 (INCLUDED_ONLY) 0/3323 variables, 95/478 constraints. Problems are: Problem set: 0 solved, 2 unsolved
At refinement iteration 16 (INCLUDED_ONLY) 0/3323 variables, 0/478 constraints. Problems are: Problem set: 0 solved, 2 unsolved
At refinement iteration 17 (OVERLAPS) 4/3327 variables, 1/479 constraints. Problems are: Problem set: 0 solved, 2 unsolved
At refinement iteration 18 (INCLUDED_ONLY) 0/3327 variables, 0/479 constraints. Problems are: Problem set: 0 solved, 2 unsolved
At refinement iteration 19 (OVERLAPS) 51/3378 variables, 31/510 constraints. Problems are: Problem set: 0 solved, 2 unsolved
At refinement iteration 20 (INCLUDED_ONLY) 0/3378 variables, 1/511 constraints. Problems are: Problem set: 0 solved, 2 unsolved
At refinement iteration 21 (INCLUDED_ONLY) 0/3378 variables, 7/518 constraints. Problems are: Problem set: 0 solved, 2 unsolved
At refinement iteration 22 (INCLUDED_ONLY) 0/3378 variables, 0/518 constraints. Problems are: Problem set: 0 solved, 2 unsolved
At refinement iteration 23 (OVERLAPS) 0/3378 variables, 0/518 constraints. Problems are: Problem set: 0 solved, 2 unsolved
No progress, stopping.
After SMT solving in domain Real declared 3378/3378 variables, and 518 constraints, problems are : Problem set: 0 solved, 2 unsolved in 1170 ms.
Refiners :[Positive P Invariants (semi-flows): 9/9 constraints, State Equation: 259/259 constraints, ReadFeed: 250/250 constraints, PredecessorRefiner: 2/2 constraints, Known Traps: 0/0 constraints]
Escalating to Integer solving :Problem set: 0 solved, 2 unsolved
At refinement iteration 0 (INCLUDED_ONLY) 0/3 variables, 0/0 constraints. Problems are: Problem set: 0 solved, 2 unsolved
At refinement iteration 1 (OVERLAPS) 31/34 variables, 1/1 constraints. Problems are: Problem set: 0 solved, 2 unsolved
At refinement iteration 2 (INCLUDED_ONLY) 0/34 variables, 0/1 constraints. Problems are: Problem set: 0 solved, 2 unsolved
At refinement iteration 3 (OVERLAPS) 905/939 variables, 34/35 constraints. Problems are: Problem set: 0 solved, 2 unsolved
At refinement iteration 4 (INCLUDED_ONLY) 0/939 variables, 2/37 constraints. Problems are: Problem set: 0 solved, 2 unsolved
At refinement iteration 5 (INCLUDED_ONLY) 0/939 variables, 0/37 constraints. Problems are: Problem set: 0 solved, 2 unsolved
At refinement iteration 6 (OVERLAPS) 1159/2098 variables, 49/86 constraints. Problems are: Problem set: 0 solved, 2 unsolved
At refinement iteration 7 (INCLUDED_ONLY) 0/2098 variables, 1/87 constraints. Problems are: Problem set: 0 solved, 2 unsolved
At refinement iteration 8 (INCLUDED_ONLY) 0/2098 variables, 146/233 constraints. Problems are: Problem set: 0 solved, 2 unsolved
At refinement iteration 9 (INCLUDED_ONLY) 0/2098 variables, 0/233 constraints. Problems are: Problem set: 0 solved, 2 unsolved
At refinement iteration 10 (OVERLAPS) 8/2106 variables, 3/236 constraints. Problems are: Problem set: 0 solved, 2 unsolved
At refinement iteration 11 (INCLUDED_ONLY) 0/2106 variables, 3/239 constraints. Problems are: Problem set: 0 solved, 2 unsolved
At refinement iteration 12 (INCLUDED_ONLY) 0/2106 variables, 0/239 constraints. Problems are: Problem set: 0 solved, 2 unsolved
At refinement iteration 13 (OVERLAPS) 1217/3323 variables, 142/381 constraints. Problems are: Problem set: 0 solved, 2 unsolved
At refinement iteration 14 (INCLUDED_ONLY) 0/3323 variables, 2/383 constraints. Problems are: Problem set: 0 solved, 2 unsolved
At refinement iteration 15 (INCLUDED_ONLY) 0/3323 variables, 95/478 constraints. Problems are: Problem set: 0 solved, 2 unsolved
At refinement iteration 16 (INCLUDED_ONLY) 0/3323 variables, 2/480 constraints. Problems are: Problem set: 0 solved, 2 unsolved
[2024-06-01 06:54:30] [INFO ] Deduced a trap composed of 24 places in 588 ms of which 2 ms to minimize.
[2024-06-01 06:54:30] [INFO ] Deduced a trap composed of 9 places in 345 ms of which 1 ms to minimize.
[2024-06-01 06:54:31] [INFO ] Deduced a trap composed of 8 places in 369 ms of which 2 ms to minimize.
[2024-06-01 06:54:31] [INFO ] Deduced a trap composed of 28 places in 356 ms of which 2 ms to minimize.
[2024-06-01 06:54:31] [INFO ] Deduced a trap composed of 7 places in 272 ms of which 1 ms to minimize.
At refinement iteration 17 (INCLUDED_ONLY) 0/3323 variables, 5/485 constraints. Problems are: Problem set: 0 solved, 2 unsolved
At refinement iteration 18 (INCLUDED_ONLY) 0/3323 variables, 0/485 constraints. Problems are: Problem set: 0 solved, 2 unsolved
At refinement iteration 19 (OVERLAPS) 4/3327 variables, 1/486 constraints. Problems are: Problem set: 0 solved, 2 unsolved
At refinement iteration 20 (INCLUDED_ONLY) 0/3327 variables, 0/486 constraints. Problems are: Problem set: 0 solved, 2 unsolved
Problem AtomicPropp1 is UNSAT
At refinement iteration 21 (OVERLAPS) 51/3378 variables, 31/517 constraints. Problems are: Problem set: 1 solved, 1 unsolved
At refinement iteration 22 (INCLUDED_ONLY) 0/3378 variables, 1/518 constraints. Problems are: Problem set: 1 solved, 1 unsolved
At refinement iteration 23 (INCLUDED_ONLY) 0/3378 variables, 7/525 constraints. Problems are: Problem set: 1 solved, 1 unsolved
[2024-06-01 06:54:32] [INFO ] Deduced a trap composed of 43 places in 291 ms of which 4 ms to minimize.
[2024-06-01 06:54:33] [INFO ] Deduced a trap composed of 9 places in 589 ms of which 2 ms to minimize.
[2024-06-01 06:54:33] [INFO ] Deduced a trap composed of 25 places in 214 ms of which 1 ms to minimize.
[2024-06-01 06:54:34] [INFO ] Deduced a trap composed of 19 places in 339 ms of which 2 ms to minimize.
SMT process timed out in 6319ms, After SMT, problems are : Problem set: 1 solved, 1 unsolved
Skipping Parikh replay, no witness traces provided.
Support contains 2 out of 259 places. Attempting structural reductions.
Starting structural reductions in REACHABILITY mode, iteration 0 : 259/259 places, 3249/3249 transitions.
Graph (complete) has 3916 edges and 259 vertex of which 258 are kept as prefixes of interest. Removing 1 places using SCC suffix rule.8 ms
Discarding 1 places :
Also discarding 0 output transitions
Performed 2 Post agglomeration using F-continuation condition.Transition count delta: -5
Deduced a syphon composed of 2 places in 3 ms
Reduce places removed 2 places and 0 transitions.
Iterating global reduction 0 with 4 rules applied. Total rules applied 5 place count 256 transition count 3254
Free-agglomeration rule applied 6 times.
Iterating global reduction 0 with 6 rules applied. Total rules applied 11 place count 256 transition count 3248
Reduce places removed 6 places and 0 transitions.
Iterating post reduction 0 with 6 rules applied. Total rules applied 17 place count 250 transition count 3248
Applied a total of 17 rules in 187 ms. Remains 250 /259 variables (removed 9) and now considering 3248/3249 (removed 1) transitions.
Finished structural reductions in REACHABILITY mode , in 1 iterations and 188 ms. Remains : 250/259 places, 3248/3249 transitions.
RANDOM walk for 40517 steps (8 resets) in 195 ms. (206 steps per ms) remains 1/1 properties
BEST_FIRST walk for 40002 steps (8 resets) in 277 ms. (143 steps per ms) remains 1/1 properties
Interrupted probabilistic random walk after 146802 steps, run timeout after 3001 ms. (steps per millisecond=48 ) properties seen :0 out of 1
Probabilistic random walk after 146802 steps, saw 69977 distinct states, run finished after 3004 ms. (steps per millisecond=48 ) properties seen :0
[2024-06-01 06:54:37] [INFO ] Flow matrix only has 3111 transitions (discarded 137 similar events)
// Phase 1: matrix 3111 rows 250 cols
[2024-06-01 06:54:37] [INFO ] Computed 8 invariants in 60 ms
[2024-06-01 06:54:37] [INFO ] State equation strengthened by 251 read => feed constraints.
All remaining problems are real, not stopping.
At refinement iteration 0 (INCLUDED_ONLY) 0/2 variables, 0/0 constraints. Problems are: Problem set: 0 solved, 1 unsolved
At refinement iteration 1 (OVERLAPS) 31/33 variables, 1/1 constraints. Problems are: Problem set: 0 solved, 1 unsolved
At refinement iteration 2 (INCLUDED_ONLY) 0/33 variables, 0/1 constraints. Problems are: Problem set: 0 solved, 1 unsolved
At refinement iteration 3 (OVERLAPS) 903/936 variables, 33/34 constraints. Problems are: Problem set: 0 solved, 1 unsolved
At refinement iteration 4 (INCLUDED_ONLY) 0/936 variables, 1/35 constraints. Problems are: Problem set: 0 solved, 1 unsolved
At refinement iteration 5 (INCLUDED_ONLY) 0/936 variables, 0/35 constraints. Problems are: Problem set: 0 solved, 1 unsolved
At refinement iteration 6 (OVERLAPS) 862/1798 variables, 48/83 constraints. Problems are: Problem set: 0 solved, 1 unsolved
At refinement iteration 7 (INCLUDED_ONLY) 0/1798 variables, 2/85 constraints. Problems are: Problem set: 0 solved, 1 unsolved
At refinement iteration 8 (INCLUDED_ONLY) 0/1798 variables, 129/214 constraints. Problems are: Problem set: 0 solved, 1 unsolved
At refinement iteration 9 (INCLUDED_ONLY) 0/1798 variables, 0/214 constraints. Problems are: Problem set: 0 solved, 1 unsolved
At refinement iteration 10 (OVERLAPS) 1/1799 variables, 1/215 constraints. Problems are: Problem set: 0 solved, 1 unsolved
At refinement iteration 11 (INCLUDED_ONLY) 0/1799 variables, 1/216 constraints. Problems are: Problem set: 0 solved, 1 unsolved
At refinement iteration 12 (INCLUDED_ONLY) 0/1799 variables, 0/216 constraints. Problems are: Problem set: 0 solved, 1 unsolved
At refinement iteration 13 (OVERLAPS) 1409/3208 variables, 85/301 constraints. Problems are: Problem set: 0 solved, 1 unsolved
At refinement iteration 14 (INCLUDED_ONLY) 0/3208 variables, 1/302 constraints. Problems are: Problem set: 0 solved, 1 unsolved
At refinement iteration 15 (INCLUDED_ONLY) 0/3208 variables, 85/387 constraints. Problems are: Problem set: 0 solved, 1 unsolved
At refinement iteration 16 (INCLUDED_ONLY) 0/3208 variables, 0/387 constraints. Problems are: Problem set: 0 solved, 1 unsolved
At refinement iteration 17 (OVERLAPS) 2/3210 variables, 1/388 constraints. Problems are: Problem set: 0 solved, 1 unsolved
At refinement iteration 18 (INCLUDED_ONLY) 0/3210 variables, 0/388 constraints. Problems are: Problem set: 0 solved, 1 unsolved
At refinement iteration 19 (OVERLAPS) 149/3359 variables, 81/469 constraints. Problems are: Problem set: 0 solved, 1 unsolved
At refinement iteration 20 (INCLUDED_ONLY) 0/3359 variables, 2/471 constraints. Problems are: Problem set: 0 solved, 1 unsolved
At refinement iteration 21 (INCLUDED_ONLY) 0/3359 variables, 36/507 constraints. Problems are: Problem set: 0 solved, 1 unsolved
At refinement iteration 22 (INCLUDED_ONLY) 0/3359 variables, 0/507 constraints. Problems are: Problem set: 0 solved, 1 unsolved
At refinement iteration 23 (OVERLAPS) 2/3361 variables, 2/509 constraints. Problems are: Problem set: 0 solved, 1 unsolved
At refinement iteration 24 (INCLUDED_ONLY) 0/3361 variables, 0/509 constraints. Problems are: Problem set: 0 solved, 1 unsolved
At refinement iteration 25 (OVERLAPS) 0/3361 variables, 0/509 constraints. Problems are: Problem set: 0 solved, 1 unsolved
No progress, stopping.
After SMT solving in domain Real declared 3361/3361 variables, and 509 constraints, problems are : Problem set: 0 solved, 1 unsolved in 919 ms.
Refiners :[Positive P Invariants (semi-flows): 8/8 constraints, State Equation: 250/250 constraints, ReadFeed: 251/251 constraints, PredecessorRefiner: 1/1 constraints, Known Traps: 0/0 constraints]
Escalating to Integer solving :Problem set: 0 solved, 1 unsolved
At refinement iteration 0 (INCLUDED_ONLY) 0/2 variables, 0/0 constraints. Problems are: Problem set: 0 solved, 1 unsolved
At refinement iteration 1 (OVERLAPS) 31/33 variables, 1/1 constraints. Problems are: Problem set: 0 solved, 1 unsolved
At refinement iteration 2 (INCLUDED_ONLY) 0/33 variables, 0/1 constraints. Problems are: Problem set: 0 solved, 1 unsolved
At refinement iteration 3 (OVERLAPS) 903/936 variables, 33/34 constraints. Problems are: Problem set: 0 solved, 1 unsolved
At refinement iteration 4 (INCLUDED_ONLY) 0/936 variables, 1/35 constraints. Problems are: Problem set: 0 solved, 1 unsolved
At refinement iteration 5 (INCLUDED_ONLY) 0/936 variables, 0/35 constraints. Problems are: Problem set: 0 solved, 1 unsolved
At refinement iteration 6 (OVERLAPS) 862/1798 variables, 48/83 constraints. Problems are: Problem set: 0 solved, 1 unsolved
At refinement iteration 7 (INCLUDED_ONLY) 0/1798 variables, 2/85 constraints. Problems are: Problem set: 0 solved, 1 unsolved
At refinement iteration 8 (INCLUDED_ONLY) 0/1798 variables, 129/214 constraints. Problems are: Problem set: 0 solved, 1 unsolved
At refinement iteration 9 (INCLUDED_ONLY) 0/1798 variables, 0/214 constraints. Problems are: Problem set: 0 solved, 1 unsolved
At refinement iteration 10 (OVERLAPS) 1/1799 variables, 1/215 constraints. Problems are: Problem set: 0 solved, 1 unsolved
At refinement iteration 11 (INCLUDED_ONLY) 0/1799 variables, 1/216 constraints. Problems are: Problem set: 0 solved, 1 unsolved
At refinement iteration 12 (INCLUDED_ONLY) 0/1799 variables, 0/216 constraints. Problems are: Problem set: 0 solved, 1 unsolved
At refinement iteration 13 (OVERLAPS) 1409/3208 variables, 85/301 constraints. Problems are: Problem set: 0 solved, 1 unsolved
At refinement iteration 14 (INCLUDED_ONLY) 0/3208 variables, 1/302 constraints. Problems are: Problem set: 0 solved, 1 unsolved
At refinement iteration 15 (INCLUDED_ONLY) 0/3208 variables, 85/387 constraints. Problems are: Problem set: 0 solved, 1 unsolved
At refinement iteration 16 (INCLUDED_ONLY) 0/3208 variables, 1/388 constraints. Problems are: Problem set: 0 solved, 1 unsolved
At refinement iteration 17 (INCLUDED_ONLY) 0/3208 variables, 0/388 constraints. Problems are: Problem set: 0 solved, 1 unsolved
At refinement iteration 18 (OVERLAPS) 2/3210 variables, 1/389 constraints. Problems are: Problem set: 0 solved, 1 unsolved
At refinement iteration 19 (INCLUDED_ONLY) 0/3210 variables, 0/389 constraints. Problems are: Problem set: 0 solved, 1 unsolved
At refinement iteration 20 (OVERLAPS) 149/3359 variables, 81/470 constraints. Problems are: Problem set: 0 solved, 1 unsolved
At refinement iteration 21 (INCLUDED_ONLY) 0/3359 variables, 2/472 constraints. Problems are: Problem set: 0 solved, 1 unsolved
At refinement iteration 22 (INCLUDED_ONLY) 0/3359 variables, 36/508 constraints. Problems are: Problem set: 0 solved, 1 unsolved
[2024-06-01 06:54:39] [INFO ] Deduced a trap composed of 18 places in 307 ms of which 2 ms to minimize.
At refinement iteration 23 (INCLUDED_ONLY) 0/3359 variables, 1/509 constraints. Problems are: Problem set: 0 solved, 1 unsolved
At refinement iteration 24 (INCLUDED_ONLY) 0/3359 variables, 0/509 constraints. Problems are: Problem set: 0 solved, 1 unsolved
At refinement iteration 25 (OVERLAPS) 2/3361 variables, 2/511 constraints. Problems are: Problem set: 0 solved, 1 unsolved
[2024-06-01 06:54:40] [INFO ] Deduced a trap composed of 40 places in 254 ms of which 2 ms to minimize.
At refinement iteration 26 (INCLUDED_ONLY) 0/3361 variables, 1/512 constraints. Problems are: Problem set: 0 solved, 1 unsolved
At refinement iteration 27 (INCLUDED_ONLY) 0/3361 variables, 0/512 constraints. Problems are: Problem set: 0 solved, 1 unsolved
[2024-06-01 06:54:40] [INFO ] Deduced a trap composed of 55 places in 238 ms of which 1 ms to minimize.
At refinement iteration 28 (OVERLAPS) 0/3361 variables, 1/513 constraints. Problems are: Problem set: 0 solved, 1 unsolved
At refinement iteration 29 (INCLUDED_ONLY) 0/3361 variables, 0/513 constraints. Problems are: Problem set: 0 solved, 1 unsolved
At refinement iteration 30 (OVERLAPS) 0/3361 variables, 0/513 constraints. Problems are: Problem set: 0 solved, 1 unsolved
No progress, stopping.
After SMT solving in domain Int declared 3361/3361 variables, and 513 constraints, problems are : Problem set: 0 solved, 1 unsolved in 2949 ms.
Refiners :[Positive P Invariants (semi-flows): 8/8 constraints, State Equation: 250/250 constraints, ReadFeed: 251/251 constraints, PredecessorRefiner: 1/1 constraints, Known Traps: 3/3 constraints]
After SMT, in 3963ms problems are : Problem set: 0 solved, 1 unsolved
Parikh walk visited 0 properties in 1000 ms.
Support contains 2 out of 250 places. Attempting structural reductions.
Starting structural reductions in REACHABILITY mode, iteration 0 : 250/250 places, 3248/3248 transitions.
Applied a total of 0 rules in 67 ms. Remains 250 /250 variables (removed 0) and now considering 3248/3248 (removed 0) transitions.
Finished structural reductions in REACHABILITY mode , in 1 iterations and 67 ms. Remains : 250/250 places, 3248/3248 transitions.
Starting structural reductions in REACHABILITY mode, iteration 0 : 250/250 places, 3248/3248 transitions.
Applied a total of 0 rules in 65 ms. Remains 250 /250 variables (removed 0) and now considering 3248/3248 (removed 0) transitions.
[2024-06-01 06:54:42] [INFO ] Flow matrix only has 3111 transitions (discarded 137 similar events)
[2024-06-01 06:54:42] [INFO ] Invariant cache hit.
[2024-06-01 06:54:42] [INFO ] Implicit Places using invariants in 409 ms returned []
[2024-06-01 06:54:42] [INFO ] Flow matrix only has 3111 transitions (discarded 137 similar events)
[2024-06-01 06:54:42] [INFO ] Invariant cache hit.
[2024-06-01 06:54:43] [INFO ] State equation strengthened by 251 read => feed constraints.
[2024-06-01 06:54:44] [INFO ] Implicit Places using invariants and state equation in 1834 ms returned []
Implicit Place search using SMT with State Equation took 2246 ms to find 0 implicit places.
[2024-06-01 06:54:44] [INFO ] Redundant transitions in 186 ms returned []
Running 3247 sub problems to find dead transitions.
[2024-06-01 06:54:45] [INFO ] Flow matrix only has 3111 transitions (discarded 137 similar events)
[2024-06-01 06:54:45] [INFO ] Invariant cache hit.
[2024-06-01 06:54:45] [INFO ] State equation strengthened by 251 read => feed constraints.
FORMULA BugTracking-PT-q8m256-LTLCardinality-00 FALSE TECHNIQUES EXPLICIT PARALLEL_PROCESSING USE_NUPN
Could not compute solution for formula : BugTracking-PT-q8m256-LTLCardinality-01
FORMULA BugTracking-PT-q8m256-LTLCardinality-02 TRUE TECHNIQUES EXPLICIT PARALLEL_PROCESSING USE_NUPN
FORMULA BugTracking-PT-q8m256-LTLCardinality-03 FALSE TECHNIQUES EXPLICIT PARALLEL_PROCESSING USE_NUPN
FORMULA BugTracking-PT-q8m256-LTLCardinality-04 FALSE TECHNIQUES EXPLICIT PARALLEL_PROCESSING USE_NUPN
FORMULA BugTracking-PT-q8m256-LTLCardinality-05 TRUE TECHNIQUES EXPLICIT PARALLEL_PROCESSING USE_NUPN
FORMULA BugTracking-PT-q8m256-LTLCardinality-06 FALSE TECHNIQUES EXPLICIT PARALLEL_PROCESSING USE_NUPN
Could not compute solution for formula : BugTracking-PT-q8m256-LTLCardinality-07
FORMULA BugTracking-PT-q8m256-LTLCardinality-08 FALSE TECHNIQUES EXPLICIT PARALLEL_PROCESSING USE_NUPN
FORMULA BugTracking-PT-q8m256-LTLCardinality-09 TRUE TECHNIQUES EXPLICIT PARALLEL_PROCESSING USE_NUPN
FORMULA BugTracking-PT-q8m256-LTLCardinality-10 TRUE TECHNIQUES EXPLICIT PARALLEL_PROCESSING USE_NUPN
FORMULA BugTracking-PT-q8m256-LTLCardinality-11 FALSE TECHNIQUES EXPLICIT PARALLEL_PROCESSING USE_NUPN
FORMULA BugTracking-PT-q8m256-LTLCardinality-12 FALSE TECHNIQUES EXPLICIT PARALLEL_PROCESSING USE_NUPN
Could not compute solution for formula : BugTracking-PT-q8m256-LTLCardinality-13
FORMULA BugTracking-PT-q8m256-LTLCardinality-14 FALSE TECHNIQUES EXPLICIT PARALLEL_PROCESSING USE_NUPN
FORMULA BugTracking-PT-q8m256-LTLCardinality-15 FALSE TECHNIQUES EXPLICIT PARALLEL_PROCESSING USE_NUPN
BK_STOP 1717225708976
--------------------
content from stderr:
+ ulimit -s 65536
+ [[ -z '' ]]
+ export LTSMIN_MEM_SIZE=8589934592
+ LTSMIN_MEM_SIZE=8589934592
+ export PYTHONPATH=/home/mcc/BenchKit/itstools/pylibs
+ PYTHONPATH=/home/mcc/BenchKit/itstools/pylibs
+ export LD_LIBRARY_PATH=/home/mcc/BenchKit/itstools/pylibs:
+ LD_LIBRARY_PATH=/home/mcc/BenchKit/itstools/pylibs:
++ sed s/.jar//
++ ls /home/mcc/BenchKit/bin//../reducer/bin//../../itstools//itstools/plugins/fr.lip6.move.gal.application.pnmcc_1.0.0.202405141337.jar
++ perl -pe 's/.*\.//g'
+ VERSION=202405141337
+ echo 'Running Version 202405141337'
+ /home/mcc/BenchKit/bin//../reducer/bin//../../itstools//itstools/its-tools -pnfolder /home/mcc/execution -examination LTLCardinality -timeout 360 -rebuildPNML
mcc2024
ltl formula name BugTracking-PT-q8m256-LTLCardinality-00
ltl formula formula --ltl=/tmp/630/ltl_0_
pnml2lts-mc( 0/ 4): Loading model from model.pnml
pnml2lts-mc( 0/ 4): Edge label is id
Warning: program compiled against libxml 210 using older 209
Warning: program compiled against libxml 210 using older 209
Warning: program compiled against libxml 210 using older 209
Warning: program compiled against libxml 210 using older 209
pnml2lts-mc( 0/ 4): Petri net has 754 places, 27370 transitions and 136172 arcs
pnml2lts-mc( 0/ 4): Petri net BugTracking-PT-q8 analyzed
pnml2lts-mc( 0/ 4): There are no safe places
pnml2lts-mc( 0/ 4): Loading Petri net took 5.830 real 1.290 user 1.490 sys
pnml2lts-mc( 3/ 4): LTL layer: formula: /tmp/630/ltl_0_
pnml2lts-mc( 2/ 4): LTL layer: formula: /tmp/630/ltl_0_
pnml2lts-mc( 0/ 4): LTL layer: formula: /tmp/630/ltl_0_
pnml2lts-mc( 1/ 4): LTL layer: formula: /tmp/630/ltl_0_
pnml2lts-mc( 0/ 4): buchi has 2 states
pnml2lts-mc( 0/ 4): There are 753 state labels and 1 edge labels
pnml2lts-mc( 0/ 4): State length is 755, there are 27374 groups
pnml2lts-mc( 0/ 4): Running ufscc using 4 cores
pnml2lts-mc( 0/ 4): Using a tree table with 2^25 elements
pnml2lts-mc( 0/ 4): Successor permutation: dynamic
pnml2lts-mc( 0/ 4): Global bits: 0, count bits: 0, local bits: 0
pnml2lts-mc( 2/ 4):
pnml2lts-mc( 2/ 4): Accepting cycle FOUND at depth ~302!
pnml2lts-mc( 2/ 4):
pnml2lts-mc( 0/ 4):
pnml2lts-mc( 0/ 4): total scc count: 122
pnml2lts-mc( 0/ 4): unique states count: 1646
pnml2lts-mc( 0/ 4): unique transitions count: 4801
pnml2lts-mc( 0/ 4): - self-loop count: 11
pnml2lts-mc( 0/ 4): - claim dead count: 4
pnml2lts-mc( 0/ 4): - claim found count: 2
pnml2lts-mc( 0/ 4): - claim success count: 1652
pnml2lts-mc( 0/ 4): - cum. max stack depth: 1525
pnml2lts-mc( 0/ 4):
pnml2lts-mc( 0/ 4): Explored 1652 states 4820 transitions, fanout: 2.918
pnml2lts-mc( 0/ 4): Total exploration time 0.960 sec (0.960 sec minimum, 0.960 sec on average)
pnml2lts-mc( 0/ 4): States per second: 1721, Transitions per second: 5021
pnml2lts-mc( 0/ 4):
pnml2lts-mc( 0/ 4): Queue width: 12B, total height: 0, memory: 0.00MB
pnml2lts-mc( 0/ 4): Tree memory: 0.2MB, 43.2 B/state, compr.: 1.4%
pnml2lts-mc( 0/ 4): Tree fill ratio (roots/leafs): 0.0%/0.0%
pnml2lts-mc( 0/ 4): Stored 27880 string chucks using 0MB
pnml2lts-mc( 0/ 4): Total memory used for chunk indexing: 1MB
pnml2lts-mc( 0/ 4): Est. total memory use: 1.2MB (~257.0MB paged-in)
ltl formula name BugTracking-PT-q8m256-LTLCardinality-01
ltl formula formula --ltl=/tmp/630/ltl_1_
Warning: program compiled against libxml 210 using older 209
pnml2lts-mc( 0/ 4): Loading model from model.pnml
pnml2lts-mc( 0/ 4): Edge label is id
Warning: program compiled against libxml 210 using older 209
Warning: program compiled against libxml 210 using older 209
Warning: program compiled against libxml 210 using older 209
pnml2lts-mc( 0/ 4): Petri net has 754 places, 27370 transitions and 136172 arcs
pnml2lts-mc( 0/ 4): Petri net BugTracking-PT-q8 analyzed
pnml2lts-mc( 0/ 4): There are no safe places
pnml2lts-mc( 0/ 4): Loading Petri net took 3.650 real 1.300 user 1.110 sys
pnml2lts-mc( 2/ 4): LTL layer: formula: /tmp/630/ltl_1_
pnml2lts-mc( 1/ 4): LTL layer: formula: /tmp/630/ltl_1_
pnml2lts-mc( 0/ 4): LTL layer: formula: /tmp/630/ltl_1_
pnml2lts-mc( 3/ 4): LTL layer: formula: /tmp/630/ltl_1_
pnml2lts-mc( 0/ 4): buchi has 7 states
pnml2lts-mc( 0/ 4): There are 753 state labels and 1 edge labels
pnml2lts-mc( 0/ 4): State length is 755, there are 27390 groups
pnml2lts-mc( 0/ 4): Running ufscc using 4 cores
pnml2lts-mc( 0/ 4): Using a tree table with 2^25 elements
pnml2lts-mc( 0/ 4): Successor permutation: dynamic
pnml2lts-mc( 0/ 4): Global bits: 0, count bits: 0, local bits: 0
pnml2lts-mc( 2/ 4): ~2500 levels ~10000 states ~28992 transitions
pnml2lts-mc( 2/ 4): ~5000 levels ~20000 states ~58988 transitions
pnml2lts-mc( 2/ 4): ~10000 levels ~40000 states ~118992 transitions
pnml2lts-mc( 1/ 4): ~20000 levels ~80000 states ~262588 transitions
pnml2lts-mc( 1/ 4): ~40000 levels ~160000 states ~525448 transitions
pnml2lts-mc( 1/ 4): ~80000 levels ~320000 states ~1051164 transitions
ltl formula name BugTracking-PT-q8m256-LTLCardinality-02
ltl formula formula --ltl=/tmp/630/ltl_2_
pnml2lts-mc( 0/ 4): Loading model from model.pnml
pnml2lts-mc( 0/ 4): Edge label is id
Warning: program compiled against libxml 210 using older 209
Warning: program compiled against libxml 210 using older 209
Warning: program compiled against libxml 210 using older 209
Warning: program compiled against libxml 210 using older 209
pnml2lts-mc( 0/ 4): Petri net has 754 places, 27370 transitions and 136172 arcs
pnml2lts-mc( 0/ 4): Petri net BugTracking-PT-q8 analyzed
pnml2lts-mc( 0/ 4): There are no safe places
pnml2lts-mc( 0/ 4): Loading Petri net took 3.570 real 1.310 user 1.120 sys
pnml2lts-mc( 0/ 4): LTL layer: formula: /tmp/630/ltl_2_
pnml2lts-mc( 3/ 4): LTL layer: formula: /tmp/630/ltl_2_
pnml2lts-mc( 2/ 4): LTL layer: formula: /tmp/630/ltl_2_
pnml2lts-mc( 1/ 4): LTL layer: formula: /tmp/630/ltl_2_
pnml2lts-mc( 0/ 4): buchi has 4 states
pnml2lts-mc( 0/ 4): Weak Buchi automaton detected, adding non-accepting as progress label.
pnml2lts-mc( 0/ 4): There are 754 state labels and 1 edge labels
pnml2lts-mc( 0/ 4): State length is 755, there are 27378 groups
pnml2lts-mc( 0/ 4): Running ufscc using 4 cores
pnml2lts-mc( 0/ 4): Using a tree table with 2^25 elements
pnml2lts-mc( 0/ 4): Successor permutation: dynamic
pnml2lts-mc( 0/ 4): Global bits: 0, count bits: 0, local bits: 0
pnml2lts-mc( 0/ 4):
pnml2lts-mc( 0/ 4): Empty product with LTL!
pnml2lts-mc( 0/ 4):
pnml2lts-mc( 0/ 4):
pnml2lts-mc( 0/ 4): total scc count: 3
pnml2lts-mc( 0/ 4): unique states count: 3
pnml2lts-mc( 0/ 4): unique transitions count: 2
pnml2lts-mc( 0/ 4): - self-loop count: 0
pnml2lts-mc( 0/ 4): - claim dead count: 1
pnml2lts-mc( 0/ 4): - claim found count: 0
pnml2lts-mc( 0/ 4): - claim success count: 7
pnml2lts-mc( 0/ 4): - cum. max stack depth: 6
pnml2lts-mc( 0/ 4):
pnml2lts-mc( 0/ 4): Explored 7 states 12 transitions, fanout: 1.714
pnml2lts-mc( 0/ 4): Total exploration time 0.010 sec (0.010 sec minimum, 0.010 sec on average)
pnml2lts-mc( 0/ 4): States per second: 700, Transitions per second: 1200
pnml2lts-mc( 0/ 4):
pnml2lts-mc( 0/ 4): Queue width: 12B, total height: 0, memory: 0.00MB
pnml2lts-mc( 0/ 4): Tree memory: 0.0MB, 149.3 B/state, compr.: 4.9%
pnml2lts-mc( 0/ 4): Tree fill ratio (roots/leafs): 0.0%/0.0%
pnml2lts-mc( 0/ 4): Stored 27880 string chucks using 0MB
pnml2lts-mc( 0/ 4): Total memory used for chunk indexing: 1MB
pnml2lts-mc( 0/ 4): Est. total memory use: 1.0MB (~257.0MB paged-in)
ltl formula name BugTracking-PT-q8m256-LTLCardinality-03
ltl formula formula --ltl=/tmp/630/ltl_3_
pnml2lts-mc( 0/ 4): Loading model from model.pnml
pnml2lts-mc( 0/ 4): Edge label is id
Warning: program compiled against libxml 210 using older 209
Warning: program compiled against libxml 210 using older 209
Warning: program compiled against libxml 210 using older 209
Warning: program compiled against libxml 210 using older 209
pnml2lts-mc( 0/ 4): Petri net has 754 places, 27370 transitions and 136172 arcs
pnml2lts-mc( 0/ 4): Petri net BugTracking-PT-q8 analyzed
pnml2lts-mc( 0/ 4): There are no safe places
pnml2lts-mc( 0/ 4): Loading Petri net took 3.620 real 1.280 user 1.240 sys
pnml2lts-mc( 1/ 4): LTL layer: formula: /tmp/630/ltl_3_
pnml2lts-mc( 2/ 4): LTL layer: formula: /tmp/630/ltl_3_
pnml2lts-mc( 3/ 4): LTL layer: formula: /tmp/630/ltl_3_
pnml2lts-mc( 0/ 4): LTL layer: formula: /tmp/630/ltl_3_
pnml2lts-mc( 0/ 4): buchi has 5 states
pnml2lts-mc( 0/ 4): Weak Buchi automaton detected, adding non-accepting as progress label.
pnml2lts-mc( 0/ 4): There are 754 state labels and 1 edge labels
pnml2lts-mc( 0/ 4): State length is 755, there are 27381 groups
pnml2lts-mc( 0/ 4): Running ufscc using 4 cores
pnml2lts-mc( 0/ 4): Using a tree table with 2^25 elements
pnml2lts-mc( 0/ 4): Successor permutation: dynamic
pnml2lts-mc( 0/ 4): Global bits: 0, count bits: 0, local bits: 0
pnml2lts-mc( 0/ 4):
pnml2lts-mc( 0/ 4): Accepting cycle FOUND at depth ~257!
pnml2lts-mc( 0/ 4):
pnml2lts-mc( 0/ 4):
pnml2lts-mc( 0/ 4): total scc count: 0
pnml2lts-mc( 0/ 4): unique states count: 906
pnml2lts-mc( 0/ 4): unique transitions count: 2578
pnml2lts-mc( 0/ 4): - self-loop count: 1
pnml2lts-mc( 0/ 4): - claim dead count: 0
pnml2lts-mc( 0/ 4): - claim found count: 0
pnml2lts-mc( 0/ 4): - claim success count: 911
pnml2lts-mc( 0/ 4): - cum. max stack depth: 911
pnml2lts-mc( 0/ 4):
pnml2lts-mc( 0/ 4): Explored 911 states 2593 transitions, fanout: 2.846
pnml2lts-mc( 0/ 4): Total exploration time 0.650 sec (0.640 sec minimum, 0.645 sec on average)
pnml2lts-mc( 0/ 4): States per second: 1402, Transitions per second: 3989
pnml2lts-mc( 0/ 4):
pnml2lts-mc( 0/ 4): Queue width: 12B, total height: 0, memory: 0.00MB
pnml2lts-mc( 0/ 4): Tree memory: 0.1MB, 56.8 B/state, compr.: 1.9%
pnml2lts-mc( 0/ 4): Tree fill ratio (roots/leafs): 0.0%/0.0%
pnml2lts-mc( 0/ 4): Stored 27880 string chucks using 0MB
pnml2lts-mc( 0/ 4): Total memory used for chunk indexing: 1MB
pnml2lts-mc( 0/ 4): Est. total memory use: 1.1MB (~257.0MB paged-in)
ltl formula name BugTracking-PT-q8m256-LTLCardinality-04
ltl formula formula --ltl=/tmp/630/ltl_4_
pnml2lts-mc( 0/ 4): Loading model from model.pnml
pnml2lts-mc( 0/ 4): Edge label is id
Warning: program compiled against libxml 210 using older 209
Warning: program compiled against libxml 210 using older 209
Warning: program compiled against libxml 210 using older 209
Warning: program compiled against libxml 210 using older 209
pnml2lts-mc( 0/ 4): Petri net has 754 places, 27370 transitions and 136172 arcs
pnml2lts-mc( 0/ 4): Petri net BugTracking-PT-q8 analyzed
pnml2lts-mc( 0/ 4): There are no safe places
pnml2lts-mc( 0/ 4): Loading Petri net took 3.710 real 1.270 user 1.100 sys
pnml2lts-mc( 0/ 4): LTL layer: formula: /tmp/630/ltl_4_
pnml2lts-mc( 2/ 4): LTL layer: formula: /tmp/630/ltl_4_
pnml2lts-mc( 1/ 4): LTL layer: formula: /tmp/630/ltl_4_
pnml2lts-mc( 3/ 4): LTL layer: formula: /tmp/630/ltl_4_
pnml2lts-mc( 0/ 4): buchi has 5 states
pnml2lts-mc( 0/ 4): Weak Buchi automaton detected, adding non-accepting as progress label.
pnml2lts-mc( 0/ 4): There are 754 state labels and 1 edge labels
pnml2lts-mc( 0/ 4): State length is 755, there are 27386 groups
pnml2lts-mc( 0/ 4): Running ufscc using 4 cores
pnml2lts-mc( 0/ 4): Using a tree table with 2^25 elements
pnml2lts-mc( 0/ 4): Successor permutation: dynamic
pnml2lts-mc( 0/ 4): Global bits: 0, count bits: 0, local bits: 0
pnml2lts-mc( 0/ 4):
pnml2lts-mc( 0/ 4): Accepting cycle FOUND at depth ~257!
pnml2lts-mc( 0/ 4):
pnml2lts-mc( 0/ 4):
pnml2lts-mc( 0/ 4): total scc count: 0
pnml2lts-mc( 0/ 4): unique states count: 686
pnml2lts-mc( 0/ 4): unique transitions count: 1802
pnml2lts-mc( 0/ 4): - self-loop count: 1
pnml2lts-mc( 0/ 4): - claim dead count: 0
pnml2lts-mc( 0/ 4): - claim found count: 0
pnml2lts-mc( 0/ 4): - claim success count: 905
pnml2lts-mc( 0/ 4): - cum. max stack depth: 905
pnml2lts-mc( 0/ 4):
pnml2lts-mc( 0/ 4): Explored 905 states 2464 transitions, fanout: 2.723
pnml2lts-mc( 0/ 4): Total exploration time 0.570 sec (0.570 sec minimum, 0.570 sec on average)
pnml2lts-mc( 0/ 4): States per second: 1588, Transitions per second: 4323
pnml2lts-mc( 0/ 4):
pnml2lts-mc( 0/ 4): Queue width: 12B, total height: 0, memory: 0.00MB
pnml2lts-mc( 0/ 4): Tree memory: 0.1MB, 70.0 B/state, compr.: 2.3%
pnml2lts-mc( 0/ 4): Tree fill ratio (roots/leafs): 0.0%/0.0%
pnml2lts-mc( 0/ 4): Stored 27880 string chucks using 0MB
pnml2lts-mc( 0/ 4): Total memory used for chunk indexing: 1MB
pnml2lts-mc( 0/ 4): Est. total memory use: 1.1MB (~257.0MB paged-in)
ltl formula name BugTracking-PT-q8m256-LTLCardinality-05
ltl formula formula --ltl=/tmp/630/ltl_5_
pnml2lts-mc( 0/ 4): Loading model from model.pnml
pnml2lts-mc( 0/ 4): Edge label is id
Warning: program compiled against libxml 210 using older 209
Warning: program compiled against libxml 210 using older 209
Warning: program compiled against libxml 210 using older 209
Warning: program compiled against libxml 210 using older 209
pnml2lts-mc( 0/ 4): Petri net has 754 places, 27370 transitions and 136172 arcs
pnml2lts-mc( 0/ 4): Petri net BugTracking-PT-q8 analyzed
pnml2lts-mc( 0/ 4): There are no safe places
pnml2lts-mc( 0/ 4): Loading Petri net took 3.610 real 1.300 user 1.010 sys
pnml2lts-mc( 2/ 4): LTL layer: formula: /tmp/630/ltl_5_
pnml2lts-mc( 0/ 4): LTL layer: formula: /tmp/630/ltl_5_
pnml2lts-mc( 3/ 4): LTL layer: formula: /tmp/630/ltl_5_
pnml2lts-mc( 1/ 4): LTL layer: formula: /tmp/630/ltl_5_
pnml2lts-mc( 0/ 4): buchi has 3 states
pnml2lts-mc( 0/ 4): Weak Buchi automaton detected, adding non-accepting as progress label.
pnml2lts-mc( 0/ 4): There are 754 state labels and 1 edge labels
pnml2lts-mc( 0/ 4): State length is 755, there are 27376 groups
pnml2lts-mc( 0/ 4): Running ufscc using 4 cores
pnml2lts-mc( 0/ 4): Using a tree table with 2^25 elements
pnml2lts-mc( 0/ 4): Successor permutation: dynamic
pnml2lts-mc( 0/ 4): Global bits: 0, count bits: 0, local bits: 0
pnml2lts-mc( 0/ 4):
pnml2lts-mc( 0/ 4): Empty product with LTL!
pnml2lts-mc( 0/ 4):
pnml2lts-mc( 0/ 4):
pnml2lts-mc( 0/ 4): total scc count: 1
pnml2lts-mc( 0/ 4): unique states count: 1
pnml2lts-mc( 0/ 4): unique transitions count: 0
pnml2lts-mc( 0/ 4): - self-loop count: 0
pnml2lts-mc( 0/ 4): - claim dead count: 0
pnml2lts-mc( 0/ 4): - claim found count: 0
pnml2lts-mc( 0/ 4): - claim success count: 4
pnml2lts-mc( 0/ 4): - cum. max stack depth: 4
pnml2lts-mc( 0/ 4):
pnml2lts-mc( 0/ 4): Explored 4 states 4 transitions, fanout: 1.000
pnml2lts-mc( 0/ 4): Total exploration time 0.010 sec (0.000 sec minimum, 0.007 sec on average)
pnml2lts-mc( 0/ 4): States per second: 400, Transitions per second: 400
pnml2lts-mc( 0/ 4):
pnml2lts-mc( 0/ 4): Queue width: 12B, total height: 0, memory: 0.00MB
pnml2lts-mc( 0/ 4): Tree memory: 0.0MB, 288.0 B/state, compr.: 9.5%
pnml2lts-mc( 0/ 4): Tree fill ratio (roots/leafs): 0.0%/0.0%
pnml2lts-mc( 0/ 4): Stored 27880 string chucks using 0MB
pnml2lts-mc( 0/ 4): Total memory used for chunk indexing: 1MB
pnml2lts-mc( 0/ 4): Est. total memory use: 1.0MB (~257.0MB paged-in)
ltl formula name BugTracking-PT-q8m256-LTLCardinality-06
ltl formula formula --ltl=/tmp/630/ltl_6_
Warning: program compiled against libxml 210 using older 209
pnml2lts-mc( 0/ 4): Loading model from model.pnml
pnml2lts-mc( 0/ 4): Edge label is id
Warning: program compiled against libxml 210 using older 209
Warning: program compiled against libxml 210 using older 209
Warning: program compiled against libxml 210 using older 209
pnml2lts-mc( 0/ 4): Petri net has 754 places, 27370 transitions and 136172 arcs
pnml2lts-mc( 0/ 4): Petri net BugTracking-PT-q8 analyzed
pnml2lts-mc( 0/ 4): There are no safe places
pnml2lts-mc( 0/ 4): Loading Petri net took 3.670 real 1.340 user 1.040 sys
pnml2lts-mc( 3/ 4): LTL layer: formula: /tmp/630/ltl_6_
pnml2lts-mc( 1/ 4): LTL layer: formula: /tmp/630/ltl_6_
pnml2lts-mc( 2/ 4): LTL layer: formula: /tmp/630/ltl_6_
pnml2lts-mc( 0/ 4): LTL layer: formula: /tmp/630/ltl_6_
pnml2lts-mc( 0/ 4): buchi has 2 states
pnml2lts-mc( 0/ 4): Weak Buchi automaton detected, adding non-accepting as progress label.
pnml2lts-mc( 0/ 4): There are 754 state labels and 1 edge labels
pnml2lts-mc( 0/ 4): State length is 755, there are 27373 groups
pnml2lts-mc( 0/ 4): Running ufscc using 4 cores
pnml2lts-mc( 0/ 4): Using a tree table with 2^25 elements
pnml2lts-mc( 0/ 4): Successor permutation: dynamic
pnml2lts-mc( 0/ 4): Global bits: 0, count bits: 0, local bits: 0
pnml2lts-mc( 1/ 4):
pnml2lts-mc( 1/ 4): Accepting cycle FOUND at depth ~461!
pnml2lts-mc( 1/ 4):
pnml2lts-mc( 0/ 4):
pnml2lts-mc( 0/ 4): total scc count: 157
pnml2lts-mc( 0/ 4): unique states count: 2115
pnml2lts-mc( 0/ 4): unique transitions count: 5256
pnml2lts-mc( 0/ 4): - self-loop count: 18
pnml2lts-mc( 0/ 4): - claim dead count: 5
pnml2lts-mc( 0/ 4): - claim found count: 113
pnml2lts-mc( 0/ 4): - claim success count: 2124
pnml2lts-mc( 0/ 4): - cum. max stack depth: 1915
pnml2lts-mc( 0/ 4):
pnml2lts-mc( 0/ 4): Explored 2129 states 5290 transitions, fanout: 2.485
pnml2lts-mc( 0/ 4): Total exploration time 1.210 sec (1.210 sec minimum, 1.210 sec on average)
pnml2lts-mc( 0/ 4): States per second: 1760, Transitions per second: 4372
pnml2lts-mc( 0/ 4):
pnml2lts-mc( 0/ 4): Queue width: 12B, total height: 0, memory: 0.00MB
pnml2lts-mc( 0/ 4): Tree memory: 0.2MB, 49.8 B/state, compr.: 1.6%
pnml2lts-mc( 0/ 4): Tree fill ratio (roots/leafs): 0.0%/0.0%
pnml2lts-mc( 0/ 4): Stored 27880 string chucks using 0MB
pnml2lts-mc( 0/ 4): Total memory used for chunk indexing: 1MB
pnml2lts-mc( 0/ 4): Est. total memory use: 1.2MB (~257.0MB paged-in)
ltl formula name BugTracking-PT-q8m256-LTLCardinality-07
ltl formula formula --ltl=/tmp/630/ltl_7_
Warning: program compiled against libxml 210 using older 209
pnml2lts-mc( 0/ 4): Loading model from model.pnml
pnml2lts-mc( 0/ 4): Edge label is id
Warning: program compiled against libxml 210 using older 209
Warning: program compiled against libxml 210 using older 209
Warning: program compiled against libxml 210 using older 209
pnml2lts-mc( 0/ 4): Petri net has 754 places, 27370 transitions and 136172 arcs
pnml2lts-mc( 0/ 4): Petri net BugTracking-PT-q8 analyzed
pnml2lts-mc( 0/ 4): There are no safe places
pnml2lts-mc( 0/ 4): Loading Petri net took 3.620 real 1.270 user 1.070 sys
pnml2lts-mc( 3/ 4): LTL layer: formula: /tmp/630/ltl_7_
pnml2lts-mc( 0/ 4): LTL layer: formula: /tmp/630/ltl_7_
pnml2lts-mc( 1/ 4): LTL layer: formula: /tmp/630/ltl_7_
pnml2lts-mc( 2/ 4): LTL layer: formula: /tmp/630/ltl_7_
pnml2lts-mc( 0/ 4): buchi has 7 states
pnml2lts-mc( 0/ 4): Weak Buchi automaton detected, adding non-accepting as progress label.
pnml2lts-mc( 0/ 4): There are 754 state labels and 1 edge labels
pnml2lts-mc( 0/ 4): State length is 755, there are 27381 groups
pnml2lts-mc( 0/ 4): Running ufscc using 4 cores
pnml2lts-mc( 0/ 4): Using a tree table with 2^25 elements
pnml2lts-mc( 0/ 4): Successor permutation: dynamic
pnml2lts-mc( 0/ 4): Global bits: 0, count bits: 0, local bits: 0
pnml2lts-mc( 1/ 4): ~444 levels ~10000 states ~19404 transitions
pnml2lts-mc( 2/ 4): ~820 levels ~20000 states ~30160 transitions
pnml2lts-mc( 2/ 4): ~1600 levels ~40000 states ~60380 transitions
pnml2lts-mc( 1/ 4): ~3532 levels ~80000 states ~155280 transitions
pnml2lts-mc( 1/ 4): ~7062 levels ~160000 states ~310596 transitions
pnml2lts-mc( 2/ 4): ~12347 levels ~320000 states ~486668 transitions
ltl formula name BugTracking-PT-q8m256-LTLCardinality-08
ltl formula formula --ltl=/tmp/630/ltl_8_
Warning: program compiled against libxml 210 using older 209
Warning: program compiled against libxml 210 using older 209
pnml2lts-mc( 0/ 4): Loading model from model.pnml
pnml2lts-mc( 0/ 4): Edge label is id
Warning: program compiled against libxml 210 using older 209
Warning: program compiled against libxml 210 using older 209
pnml2lts-mc( 0/ 4): Petri net has 754 places, 27370 transitions and 136172 arcs
pnml2lts-mc( 0/ 4): Petri net BugTracking-PT-q8 analyzed
pnml2lts-mc( 0/ 4): There are no safe places
pnml2lts-mc( 0/ 4): Loading Petri net took 5.870 real 1.090 user 1.340 sys
pnml2lts-mc( 1/ 4): LTL layer: formula: /tmp/630/ltl_8_
pnml2lts-mc( 3/ 4): LTL layer: formula: /tmp/630/ltl_8_
pnml2lts-mc( 0/ 4): LTL layer: formula: /tmp/630/ltl_8_
pnml2lts-mc( 2/ 4): LTL layer: formula: /tmp/630/ltl_8_
pnml2lts-mc( 0/ 4): buchi has 2 states
pnml2lts-mc( 0/ 4): Weak Buchi automaton detected, adding non-accepting as progress label.
pnml2lts-mc( 0/ 4): There are 754 state labels and 1 edge labels
pnml2lts-mc( 0/ 4): State length is 755, there are 27372 groups
pnml2lts-mc( 0/ 4): Running ufscc using 4 cores
pnml2lts-mc( 0/ 4): Using a tree table with 2^25 elements
pnml2lts-mc( 0/ 4): Successor permutation: dynamic
pnml2lts-mc( 0/ 4): Global bits: 0, count bits: 0, local bits: 0
pnml2lts-mc( 0/ 4):
pnml2lts-mc( 0/ 4): Accepting cycle FOUND at depth ~257!
pnml2lts-mc( 0/ 4):
pnml2lts-mc( 0/ 4):
pnml2lts-mc( 0/ 4): total scc count: 0
pnml2lts-mc( 0/ 4): unique states count: 686
pnml2lts-mc( 0/ 4): unique transitions count: 1859
pnml2lts-mc( 0/ 4): - self-loop count: 1
pnml2lts-mc( 0/ 4): - claim dead count: 0
pnml2lts-mc( 0/ 4): - claim found count: 0
pnml2lts-mc( 0/ 4): - claim success count: 691
pnml2lts-mc( 0/ 4): - cum. max stack depth: 691
pnml2lts-mc( 0/ 4):
pnml2lts-mc( 0/ 4): Explored 691 states 1874 transitions, fanout: 2.712
pnml2lts-mc( 0/ 4): Total exploration time 0.650 sec (0.650 sec minimum, 0.650 sec on average)
pnml2lts-mc( 0/ 4): States per second: 1063, Transitions per second: 2883
pnml2lts-mc( 0/ 4):
pnml2lts-mc( 0/ 4): Queue width: 12B, total height: 0, memory: 0.00MB
pnml2lts-mc( 0/ 4): Tree memory: 0.1MB, 65.9 B/state, compr.: 2.2%
pnml2lts-mc( 0/ 4): Tree fill ratio (roots/leafs): 0.0%/0.0%
pnml2lts-mc( 0/ 4): Stored 27880 string chucks using 0MB
pnml2lts-mc( 0/ 4): Total memory used for chunk indexing: 1MB
pnml2lts-mc( 0/ 4): Est. total memory use: 1.1MB (~257.0MB paged-in)
ltl formula name BugTracking-PT-q8m256-LTLCardinality-09
ltl formula formula --ltl=/tmp/630/ltl_9_
pnml2lts-mc( 0/ 4): Loading model from model.pnml
pnml2lts-mc( 0/ 4): Edge label is id
Warning: program compiled against libxml 210 using older 209
Warning: program compiled against libxml 210 using older 209
Warning: program compiled against libxml 210 using older 209
Warning: program compiled against libxml 210 using older 209
pnml2lts-mc( 0/ 4): Petri net has 754 places, 27370 transitions and 136172 arcs
pnml2lts-mc( 0/ 4): Petri net BugTracking-PT-q8 analyzed
pnml2lts-mc( 0/ 4): There are no safe places
pnml2lts-mc( 0/ 4): Loading Petri net took 5.440 real 1.130 user 1.070 sys
pnml2lts-mc( 0/ 4): LTL layer: formula: /tmp/630/ltl_9_
pnml2lts-mc( 1/ 4): LTL layer: formula: /tmp/630/ltl_9_
pnml2lts-mc( 3/ 4): LTL layer: formula: /tmp/630/ltl_9_
pnml2lts-mc( 2/ 4): LTL layer: formula: /tmp/630/ltl_9_
pnml2lts-mc( 0/ 4): buchi has 2 states
pnml2lts-mc( 0/ 4): Weak Buchi automaton detected, adding non-accepting as progress label.
pnml2lts-mc( 0/ 4): There are 754 state labels and 1 edge labels
pnml2lts-mc( 0/ 4): State length is 755, there are 27375 groups
pnml2lts-mc( 0/ 4): Running ufscc using 4 cores
pnml2lts-mc( 0/ 4): Using a tree table with 2^25 elements
pnml2lts-mc( 0/ 4): Successor permutation: dynamic
pnml2lts-mc( 0/ 4): Global bits: 0, count bits: 0, local bits: 0
pnml2lts-mc( 0/ 4):
pnml2lts-mc( 0/ 4): Empty product with LTL!
pnml2lts-mc( 0/ 4):
pnml2lts-mc( 0/ 4):
pnml2lts-mc( 0/ 4): total scc count: 1
pnml2lts-mc( 0/ 4): unique states count: 1
pnml2lts-mc( 0/ 4): unique transitions count: 0
pnml2lts-mc( 0/ 4): - self-loop count: 0
pnml2lts-mc( 0/ 4): - claim dead count: 0
pnml2lts-mc( 0/ 4): - claim found count: 0
pnml2lts-mc( 0/ 4): - claim success count: 4
pnml2lts-mc( 0/ 4): - cum. max stack depth: 4
pnml2lts-mc( 0/ 4):
pnml2lts-mc( 0/ 4): Explored 4 states 4 transitions, fanout: 1.000
pnml2lts-mc( 0/ 4): Total exploration time 0.010 sec (0.000 sec minimum, 0.007 sec on average)
pnml2lts-mc( 0/ 4): States per second: 400, Transitions per second: 400
pnml2lts-mc( 0/ 4):
pnml2lts-mc( 0/ 4): Queue width: 12B, total height: 0, memory: 0.00MB
pnml2lts-mc( 0/ 4): Tree memory: 0.0MB, 288.0 B/state, compr.: 9.5%
pnml2lts-mc( 0/ 4): Tree fill ratio (roots/leafs): 0.0%/0.0%
pnml2lts-mc( 0/ 4): Stored 27880 string chucks using 0MB
pnml2lts-mc( 0/ 4): Total memory used for chunk indexing: 1MB
pnml2lts-mc( 0/ 4): Est. total memory use: 1.0MB (~257.0MB paged-in)
ltl formula name BugTracking-PT-q8m256-LTLCardinality-10
ltl formula formula --ltl=/tmp/630/ltl_10_
pnml2lts-mc( 0/ 4): Loading model from model.pnml
pnml2lts-mc( 0/ 4): Edge label is id
Warning: program compiled against libxml 210 using older 209
Warning: program compiled against libxml 210 using older 209
Warning: program compiled against libxml 210 using older 209
Warning: program compiled against libxml 210 using older 209
pnml2lts-mc( 0/ 4): Petri net has 754 places, 27370 transitions and 136172 arcs
pnml2lts-mc( 0/ 4): Petri net BugTracking-PT-q8 analyzed
pnml2lts-mc( 0/ 4): There are no safe places
pnml2lts-mc( 0/ 4): Loading Petri net took 6.060 real 1.120 user 1.110 sys
pnml2lts-mc( 0/ 4): LTL layer: formula: /tmp/630/ltl_10_
pnml2lts-mc( 1/ 4): LTL layer: formula: /tmp/630/ltl_10_
pnml2lts-mc( 2/ 4): LTL layer: formula: /tmp/630/ltl_10_
pnml2lts-mc( 3/ 4): LTL layer: formula: /tmp/630/ltl_10_
pnml2lts-mc( 0/ 4): buchi has 4 states
pnml2lts-mc( 0/ 4): Weak Buchi automaton detected, adding non-accepting as progress label.
pnml2lts-mc( 0/ 4): There are 754 state labels and 1 edge labels
pnml2lts-mc( 0/ 4): State length is 755, there are 27374 groups
pnml2lts-mc( 0/ 4): Running ufscc using 4 cores
pnml2lts-mc( 0/ 4): Using a tree table with 2^25 elements
pnml2lts-mc( 0/ 4): Successor permutation: dynamic
pnml2lts-mc( 0/ 4): Global bits: 0, count bits: 0, local bits: 0
pnml2lts-mc( 0/ 4):
pnml2lts-mc( 0/ 4): Empty product with LTL!
pnml2lts-mc( 0/ 4):
pnml2lts-mc( 0/ 4):
pnml2lts-mc( 0/ 4): total scc count: 14
pnml2lts-mc( 0/ 4): unique states count: 14
pnml2lts-mc( 0/ 4): unique transitions count: 18
pnml2lts-mc( 0/ 4): - self-loop count: 0
pnml2lts-mc( 0/ 4): - claim dead count: 7
pnml2lts-mc( 0/ 4): - claim found count: 0
pnml2lts-mc( 0/ 4): - claim success count: 23
pnml2lts-mc( 0/ 4): - cum. max stack depth: 14
pnml2lts-mc( 0/ 4):
pnml2lts-mc( 0/ 4): Explored 23 states 39 transitions, fanout: 1.696
pnml2lts-mc( 0/ 4): Total exploration time 0.030 sec (0.010 sec minimum, 0.018 sec on average)
pnml2lts-mc( 0/ 4): States per second: 767, Transitions per second: 1300
pnml2lts-mc( 0/ 4):
pnml2lts-mc( 0/ 4): Queue width: 12B, total height: 0, memory: 0.00MB
pnml2lts-mc( 0/ 4): Tree memory: 0.0MB, 92.0 B/state, compr.: 3.0%
pnml2lts-mc( 0/ 4): Tree fill ratio (roots/leafs): 0.0%/0.0%
pnml2lts-mc( 0/ 4): Stored 27880 string chucks using 0MB
pnml2lts-mc( 0/ 4): Total memory used for chunk indexing: 1MB
pnml2lts-mc( 0/ 4): Est. total memory use: 1.0MB (~257.0MB paged-in)
ltl formula name BugTracking-PT-q8m256-LTLCardinality-11
ltl formula formula --ltl=/tmp/630/ltl_11_
pnml2lts-mc( 0/ 4): Loading model from model.pnml
pnml2lts-mc( 0/ 4): Edge label is id
Warning: program compiled against libxml 210 using older 209
Warning: program compiled against libxml 210 using older 209
Warning: program compiled against libxml 210 using older 209
Warning: program compiled against libxml 210 using older 209
pnml2lts-mc( 0/ 4): Petri net has 754 places, 27370 transitions and 136172 arcs
pnml2lts-mc( 0/ 4): Petri net BugTracking-PT-q8 analyzed
pnml2lts-mc( 0/ 4): There are no safe places
pnml2lts-mc( 0/ 4): Loading Petri net took 5.920 real 1.440 user 1.550 sys
pnml2lts-mc( 2/ 4): LTL layer: formula: /tmp/630/ltl_11_
pnml2lts-mc( 0/ 4): LTL layer: formula: /tmp/630/ltl_11_
pnml2lts-mc( 3/ 4): LTL layer: formula: /tmp/630/ltl_11_
pnml2lts-mc( 1/ 4): LTL layer: formula: /tmp/630/ltl_11_
pnml2lts-mc( 0/ 4): buchi has 3 states
pnml2lts-mc( 0/ 4): Weak Buchi automaton detected, adding non-accepting as progress label.
pnml2lts-mc( 0/ 4): There are 754 state labels and 1 edge labels
pnml2lts-mc( 0/ 4): State length is 755, there are 27375 groups
pnml2lts-mc( 0/ 4): Running ufscc using 4 cores
pnml2lts-mc( 0/ 4): Using a tree table with 2^25 elements
pnml2lts-mc( 0/ 4): Successor permutation: dynamic
pnml2lts-mc( 0/ 4): Global bits: 0, count bits: 0, local bits: 0
pnml2lts-mc( 1/ 4):
pnml2lts-mc( 1/ 4): Accepting cycle FOUND at depth ~257!
pnml2lts-mc( 1/ 4):
pnml2lts-mc( 0/ 4):
pnml2lts-mc( 0/ 4): total scc count: 0
pnml2lts-mc( 0/ 4): unique states count: 1294
pnml2lts-mc( 0/ 4): unique transitions count: 4317
pnml2lts-mc( 0/ 4): - self-loop count: 1
pnml2lts-mc( 0/ 4): - claim dead count: 0
pnml2lts-mc( 0/ 4): - claim found count: 0
pnml2lts-mc( 0/ 4): - claim success count: 1299
pnml2lts-mc( 0/ 4): - cum. max stack depth: 1299
pnml2lts-mc( 0/ 4):
pnml2lts-mc( 0/ 4): Explored 1299 states 4337 transitions, fanout: 3.339
pnml2lts-mc( 0/ 4): Total exploration time 0.990 sec (0.990 sec minimum, 0.990 sec on average)
pnml2lts-mc( 0/ 4): States per second: 1312, Transitions per second: 4381
pnml2lts-mc( 0/ 4):
pnml2lts-mc( 0/ 4): Queue width: 12B, total height: 0, memory: 0.00MB
pnml2lts-mc( 0/ 4): Tree memory: 0.1MB, 33.2 B/state, compr.: 1.1%
pnml2lts-mc( 0/ 4): Tree fill ratio (roots/leafs): 0.0%/0.0%
pnml2lts-mc( 0/ 4): Stored 27880 string chucks using 0MB
pnml2lts-mc( 0/ 4): Total memory used for chunk indexing: 1MB
pnml2lts-mc( 0/ 4): Est. total memory use: 1.1MB (~257.0MB paged-in)
ltl formula name BugTracking-PT-q8m256-LTLCardinality-12
ltl formula formula --ltl=/tmp/630/ltl_12_
pnml2lts-mc( 0/ 4): Loading model from model.pnml
pnml2lts-mc( 0/ 4): Edge label is id
Warning: program compiled against libxml 210 using older 209
Warning: program compiled against libxml 210 using older 209
Warning: program compiled against libxml 210 using older 209
Warning: program compiled against libxml 210 using older 209
pnml2lts-mc( 0/ 4): Petri net has 754 places, 27370 transitions and 136172 arcs
pnml2lts-mc( 0/ 4): Petri net BugTracking-PT-q8 analyzed
pnml2lts-mc( 0/ 4): There are no safe places
pnml2lts-mc( 0/ 4): Loading Petri net took 5.900 real 1.410 user 1.380 sys
pnml2lts-mc( 1/ 4): LTL layer: formula: /tmp/630/ltl_12_
pnml2lts-mc( 0/ 4): LTL layer: formula: /tmp/630/ltl_12_
pnml2lts-mc( 2/ 4): LTL layer: formula: /tmp/630/ltl_12_
pnml2lts-mc( 3/ 4): LTL layer: formula: /tmp/630/ltl_12_
pnml2lts-mc( 0/ 4): buchi has 2 states
pnml2lts-mc( 0/ 4): There are 753 state labels and 1 edge labels
pnml2lts-mc( 0/ 4): State length is 755, there are 27374 groups
pnml2lts-mc( 0/ 4): Running ufscc using 4 cores
pnml2lts-mc( 0/ 4): Using a tree table with 2^25 elements
pnml2lts-mc( 0/ 4): Successor permutation: dynamic
pnml2lts-mc( 0/ 4): Global bits: 0, count bits: 0, local bits: 0
pnml2lts-mc( 3/ 4):
pnml2lts-mc( 3/ 4): Accepting cycle FOUND at depth ~267!
pnml2lts-mc( 3/ 4):
pnml2lts-mc( 0/ 4):
pnml2lts-mc( 0/ 4): total scc count: 0
pnml2lts-mc( 0/ 4): unique states count: 949
pnml2lts-mc( 0/ 4): unique transitions count: 2864
pnml2lts-mc( 0/ 4): - self-loop count: 1
pnml2lts-mc( 0/ 4): - claim dead count: 0
pnml2lts-mc( 0/ 4): - claim found count: 0
pnml2lts-mc( 0/ 4): - claim success count: 954
pnml2lts-mc( 0/ 4): - cum. max stack depth: 954
pnml2lts-mc( 0/ 4):
pnml2lts-mc( 0/ 4): Explored 954 states 2879 transitions, fanout: 3.018
pnml2lts-mc( 0/ 4): Total exploration time 0.700 sec (0.690 sec minimum, 0.695 sec on average)
pnml2lts-mc( 0/ 4): States per second: 1363, Transitions per second: 4113
pnml2lts-mc( 0/ 4):
pnml2lts-mc( 0/ 4): Queue width: 12B, total height: 0, memory: 0.00MB
pnml2lts-mc( 0/ 4): Tree memory: 0.1MB, 51.8 B/state, compr.: 1.7%
pnml2lts-mc( 0/ 4): Tree fill ratio (roots/leafs): 0.0%/0.0%
pnml2lts-mc( 0/ 4): Stored 27880 string chucks using 0MB
pnml2lts-mc( 0/ 4): Total memory used for chunk indexing: 1MB
pnml2lts-mc( 0/ 4): Est. total memory use: 1.1MB (~257.0MB paged-in)
ltl formula name BugTracking-PT-q8m256-LTLCardinality-13
ltl formula formula --ltl=/tmp/630/ltl_13_
pnml2lts-mc( 0/ 4): Loading model from model.pnml
pnml2lts-mc( 0/ 4): Edge label is id
Warning: program compiled against libxml 210 using older 209
Warning: program compiled against libxml 210 using older 209
Warning: program compiled against libxml 210 using older 209
Warning: program compiled against libxml 210 using older 209
pnml2lts-mc( 0/ 4): Petri net has 754 places, 27370 transitions and 136172 arcs
pnml2lts-mc( 0/ 4): Petri net BugTracking-PT-q8 analyzed
pnml2lts-mc( 0/ 4): There are no safe places
pnml2lts-mc( 0/ 4): Loading Petri net took 5.410 real 1.220 user 1.350 sys
pnml2lts-mc( 2/ 4): LTL layer: formula: /tmp/630/ltl_13_
pnml2lts-mc( 0/ 4): LTL layer: formula: /tmp/630/ltl_13_
pnml2lts-mc( 3/ 4): LTL layer: formula: /tmp/630/ltl_13_
pnml2lts-mc( 1/ 4): LTL layer: formula: /tmp/630/ltl_13_
pnml2lts-mc( 0/ 4): buchi has 5 states
pnml2lts-mc( 0/ 4): Weak Buchi automaton detected, adding non-accepting as progress label.
pnml2lts-mc( 0/ 4): There are 754 state labels and 1 edge labels
pnml2lts-mc( 0/ 4): State length is 755, there are 27386 groups
pnml2lts-mc( 0/ 4): Running ufscc using 4 cores
pnml2lts-mc( 0/ 4): Using a tree table with 2^25 elements
pnml2lts-mc( 0/ 4): Successor permutation: dynamic
pnml2lts-mc( 0/ 4): Global bits: 0, count bits: 0, local bits: 0
pnml2lts-mc( 2/ 4): ~1839 levels ~10000 states ~18124 transitions
pnml2lts-mc( 2/ 4): ~3699 levels ~20000 states ~36424 transitions
pnml2lts-mc( 3/ 4): ~10000 levels ~40000 states ~165460 transitions
pnml2lts-mc( 3/ 4): ~20000 levels ~80000 states ~332124 transitions
pnml2lts-mc( 3/ 4): ~40000 levels ~160000 states ~665460 transitions
pnml2lts-mc( 2/ 4): ~59412 levels ~320000 states ~584992 transitions
ltl formula name BugTracking-PT-q8m256-LTLCardinality-14
ltl formula formula --ltl=/tmp/630/ltl_14_
pnml2lts-mc( 0/ 4): Loading model from model.pnml
pnml2lts-mc( 0/ 4): Edge label is id
Warning: program compiled against libxml 210 using older 209
Warning: program compiled against libxml 210 using older 209
Warning: program compiled against libxml 210 using older 209
Warning: program compiled against libxml 210 using older 209
pnml2lts-mc( 0/ 4): Petri net has 754 places, 27370 transitions and 136172 arcs
pnml2lts-mc( 0/ 4): Petri net BugTracking-PT-q8 analyzed
pnml2lts-mc( 0/ 4): There are no safe places
pnml2lts-mc( 0/ 4): Loading Petri net took 6.430 real 1.360 user 1.420 sys
pnml2lts-mc( 1/ 4): LTL layer: formula: /tmp/630/ltl_14_
pnml2lts-mc( 3/ 4): LTL layer: formula: /tmp/630/ltl_14_
pnml2lts-mc( 2/ 4): LTL layer: formula: /tmp/630/ltl_14_
pnml2lts-mc( 0/ 4): LTL layer: formula: /tmp/630/ltl_14_
pnml2lts-mc( 0/ 4): buchi has 2 states
pnml2lts-mc( 0/ 4): There are 753 state labels and 1 edge labels
pnml2lts-mc( 0/ 4): State length is 755, there are 27376 groups
pnml2lts-mc( 0/ 4): Running ufscc using 4 cores
pnml2lts-mc( 0/ 4): Using a tree table with 2^25 elements
pnml2lts-mc( 0/ 4): Successor permutation: dynamic
pnml2lts-mc( 0/ 4): Global bits: 0, count bits: 0, local bits: 0
pnml2lts-mc( 0/ 4):
pnml2lts-mc( 0/ 4): Accepting cycle FOUND at depth ~257!
pnml2lts-mc( 0/ 4):
pnml2lts-mc( 0/ 4):
pnml2lts-mc( 0/ 4): total scc count: 0
pnml2lts-mc( 0/ 4): unique states count: 680
pnml2lts-mc( 0/ 4): unique transitions count: 3566
pnml2lts-mc( 0/ 4): - self-loop count: 2
pnml2lts-mc( 0/ 4): - claim dead count: 0
pnml2lts-mc( 0/ 4): - claim found count: 0
pnml2lts-mc( 0/ 4): - claim success count: 689
pnml2lts-mc( 0/ 4): - cum. max stack depth: 689
pnml2lts-mc( 0/ 4):
pnml2lts-mc( 0/ 4): Explored 689 states 3608 transitions, fanout: 5.237
pnml2lts-mc( 0/ 4): Total exploration time 0.680 sec (0.670 sec minimum, 0.675 sec on average)
pnml2lts-mc( 0/ 4): States per second: 1013, Transitions per second: 5306
pnml2lts-mc( 0/ 4):
pnml2lts-mc( 0/ 4): Queue width: 12B, total height: 0, memory: 0.00MB
pnml2lts-mc( 0/ 4): Tree memory: 0.1MB, 62.3 B/state, compr.: 2.1%
pnml2lts-mc( 0/ 4): Tree fill ratio (roots/leafs): 0.0%/0.0%
pnml2lts-mc( 0/ 4): Stored 27880 string chucks using 0MB
pnml2lts-mc( 0/ 4): Total memory used for chunk indexing: 1MB
pnml2lts-mc( 0/ 4): Est. total memory use: 1.1MB (~257.0MB paged-in)
ltl formula name BugTracking-PT-q8m256-LTLCardinality-15
ltl formula formula --ltl=/tmp/630/ltl_15_
pnml2lts-mc( 0/ 4): Loading model from model.pnml
pnml2lts-mc( 0/ 4): Edge label is id
Warning: program compiled against libxml 210 using older 209
Warning: program compiled against libxml 210 using older 209
Warning: program compiled against libxml 210 using older 209
Warning: program compiled against libxml 210 using older 209
pnml2lts-mc( 0/ 4): Petri net has 754 places, 27370 transitions and 136172 arcs
pnml2lts-mc( 0/ 4): Petri net BugTracking-PT-q8 analyzed
pnml2lts-mc( 0/ 4): There are no safe places
pnml2lts-mc( 0/ 4): Loading Petri net took 6.500 real 1.270 user 1.570 sys
pnml2lts-mc( 0/ 4): LTL layer: formula: /tmp/630/ltl_15_
pnml2lts-mc( 1/ 4): LTL layer: formula: /tmp/630/ltl_15_
pnml2lts-mc( 2/ 4): LTL layer: formula: /tmp/630/ltl_15_
pnml2lts-mc( 0/ 4): buchi has 3 states
pnml2lts-mc( 3/ 4): LTL layer: formula: /tmp/630/ltl_15_
pnml2lts-mc( 0/ 4): There are 753 state labels and 1 edge labels
pnml2lts-mc( 0/ 4): State length is 755, there are 27376 groups
pnml2lts-mc( 0/ 4): Running ufscc using 4 cores
pnml2lts-mc( 0/ 4): Using a tree table with 2^25 elements
pnml2lts-mc( 0/ 4): Successor permutation: dynamic
pnml2lts-mc( 0/ 4): Global bits: 0, count bits: 0, local bits: 0
pnml2lts-mc( 2/ 4):
pnml2lts-mc( 2/ 4): Accepting cycle FOUND at depth ~257!
pnml2lts-mc( 2/ 4):
pnml2lts-mc( 0/ 4):
pnml2lts-mc( 0/ 4): total scc count: 0
pnml2lts-mc( 0/ 4): unique states count: 1604
pnml2lts-mc( 0/ 4): unique transitions count: 4524
pnml2lts-mc( 0/ 4): - self-loop count: 1
pnml2lts-mc( 0/ 4): - claim dead count: 0
pnml2lts-mc( 0/ 4): - claim found count: 0
pnml2lts-mc( 0/ 4): - claim success count: 1612
pnml2lts-mc( 0/ 4): - cum. max stack depth: 1612
pnml2lts-mc( 0/ 4):
pnml2lts-mc( 0/ 4): Explored 1612 states 4555 transitions, fanout: 2.826
pnml2lts-mc( 0/ 4): Total exploration time 1.320 sec (1.290 sec minimum, 1.312 sec on average)
pnml2lts-mc( 0/ 4): States per second: 1221, Transitions per second: 3451
pnml2lts-mc( 0/ 4):
pnml2lts-mc( 0/ 4): Queue width: 12B, total height: 0, memory: 0.00MB
pnml2lts-mc( 0/ 4): Tree memory: 0.2MB, 60.2 B/state, compr.: 2.0%
pnml2lts-mc( 0/ 4): Tree fill ratio (roots/leafs): 0.0%/0.0%
pnml2lts-mc( 0/ 4): Stored 27880 string chucks using 0MB
pnml2lts-mc( 0/ 4): Total memory used for chunk indexing: 1MB
pnml2lts-mc( 0/ 4): Est. total memory use: 1.2MB (~257.0MB paged-in)
Sequence of Actions to be Executed by the VM
This is useful if one wants to reexecute the tool in the VM from the submitted image disk.
set -x
# this is for BenchKit: configuration of major elements for the test
export BK_INPUT="BugTracking-PT-q8m256"
export BK_EXAMINATION="LTLCardinality"
export BK_TOOL="ltsminxred"
export BK_RESULT_DIR="/tmp/BK_RESULTS/OUTPUTS"
export BK_TIME_CONFINEMENT="3600"
export BK_MEMORY_CONFINEMENT="16384"
export BK_BIN_PATH="/home/mcc/BenchKit/bin/"
# this is specific to your benchmark or test
export BIN_DIR="$HOME/BenchKit/bin"
# remove the execution directoty if it exists (to avoid increse of .vmdk images)
if [ -d execution ] ; then
rm -rf execution
fi
# this is for BenchKit: explicit launching of the test
echo "====================================================================="
echo " Generated by BenchKit 2-5568"
echo " Executing tool ltsminxred"
echo " Input is BugTracking-PT-q8m256, examination is LTLCardinality"
echo " Time confinement is $BK_TIME_CONFINEMENT seconds"
echo " Memory confinement is 16384 MBytes"
echo " Number of cores is 4"
echo " Run identifier is r472-tajo-171620399500443"
echo "====================================================================="
echo
echo "--------------------"
echo "preparation of the directory to be used:"
tar xzf /home/mcc/BenchKit/INPUTS/BugTracking-PT-q8m256.tgz
mv BugTracking-PT-q8m256 execution
cd execution
if [ "LTLCardinality" = "ReachabilityDeadlock" ] || [ "LTLCardinality" = "UpperBounds" ] || [ "LTLCardinality" = "QuasiLiveness" ] || [ "LTLCardinality" = "StableMarking" ] || [ "LTLCardinality" = "Liveness" ] || [ "LTLCardinality" = "OneSafe" ] || [ "LTLCardinality" = "StateSpace" ]; then
rm -f GenericPropertiesVerdict.xml
fi
pwd
ls -lh
echo
echo "--------------------"
echo "content from stdout:"
echo
echo "=== Data for post analysis generated by BenchKit (invocation template)"
echo
if [ "LTLCardinality" = "UpperBounds" ] ; then
echo "The expected result is a vector of positive values"
echo NUM_VECTOR
elif [ "LTLCardinality" != "StateSpace" ] ; then
echo "The expected result is a vector of booleans"
echo BOOL_VECTOR
else
echo "no data necessary for post analysis"
fi
echo
if [ -f "LTLCardinality.txt" ] ; then
echo "here is the order used to build the result vector(from text file)"
for x in $(grep Property LTLCardinality.txt | cut -d ' ' -f 2 | sort -u) ; do
echo "FORMULA_NAME $x"
done
elif [ -f "LTLCardinality.xml" ] ; then # for cunf (txt files deleted;-)
echo echo "here is the order used to build the result vector(from xml file)"
for x in $(grep '
echo "FORMULA_NAME $x"
done
elif [ "LTLCardinality" = "ReachabilityDeadlock" ] || [ "LTLCardinality" = "QuasiLiveness" ] || [ "LTLCardinality" = "StableMarking" ] || [ "LTLCardinality" = "Liveness" ] || [ "LTLCardinality" = "OneSafe" ] ; then
echo "FORMULA_NAME LTLCardinality"
fi
echo
echo "=== Now, execution of the tool begins"
echo
echo -n "BK_START "
date -u +%s%3N
echo
timeout -s 9 $BK_TIME_CONFINEMENT bash -c "/home/mcc/BenchKit/BenchKit_head.sh 2> STDERR ; echo ; echo -n \"BK_STOP \" ; date -u +%s%3N"
if [ $? -eq 137 ] ; then
echo
echo "BK_TIME_CONFINEMENT_REACHED"
fi
echo
echo "--------------------"
echo "content from stderr:"
echo
cat STDERR ;