

About the Execution of LTSMin+red for BugTracking-PT-q8m128
| Execution Summary | |||||
| Max Memory Used (MB) |
Time wait (ms) | CPU Usage (ms) | I/O Wait (ms) | Computed Result | Execution Status |
| 16190.987 | 741112.00 | 2361070.00 | 289.00 | FF?FF?FFFFFFFFFF | normal |
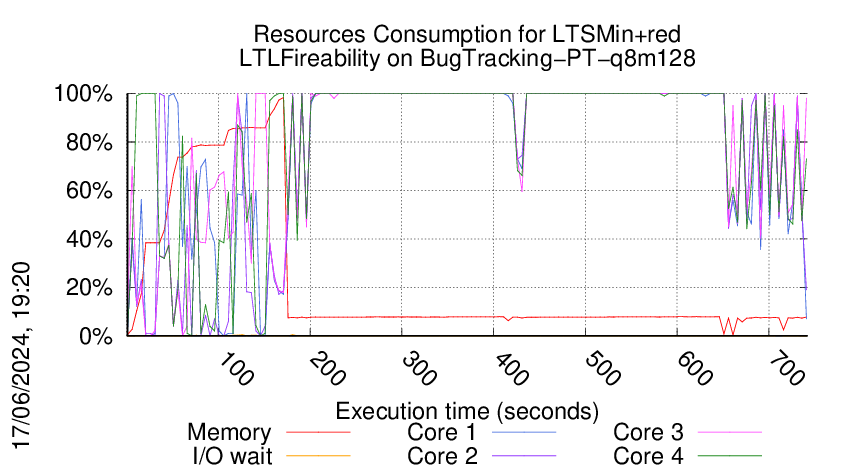
Execution Chart
We display below the execution chart for this examination (boot time has been removed).
Trace from the execution
Formatting '/mnt/tpsp/fkordon/mcc2024-input.r472-tajo-171620399500436.qcow2', fmt=qcow2 size=4294967296 backing_file='/mnt/tpsp/fkordon/mcc2024-input.qcow2' backing_fmt='qcow2' encryption=off cluster_size=65536 lazy_refcounts=off
Waiting for the VM to be ready (probing ssh)
.......................
=====================================================================
Generated by BenchKit 2-5568
Executing tool ltsminxred
Input is BugTracking-PT-q8m128, examination is LTLFireability
Time confinement is 3600 seconds
Memory confinement is 16384 MBytes
Number of cores is 4
Run identifier is r472-tajo-171620399500436
=====================================================================
--------------------
preparation of the directory to be used:
/home/mcc/execution
total 16M
-rw-r--r-- 1 mcc users 7.7K May 14 13:22 CTLCardinality.txt
-rw-r--r-- 1 mcc users 68K May 14 13:22 CTLCardinality.xml
-rw-r--r-- 1 mcc users 5.7K May 14 13:22 CTLFireability.txt
-rw-r--r-- 1 mcc users 50K May 14 13:22 CTLFireability.xml
-rw-r--r-- 1 mcc users 4.1K May 19 07:06 LTLCardinality.txt
-rw-r--r-- 1 mcc users 24K May 19 15:29 LTLCardinality.xml
-rw-r--r-- 1 mcc users 2.4K Apr 22 14:30 LTLFireability.txt
-rw-r--r-- 1 mcc users 18K Apr 22 14:30 LTLFireability.xml
-rw-r--r-- 1 mcc users 14K Apr 12 01:10 ReachabilityCardinality.txt
-rw-r--r-- 1 mcc users 119K Apr 12 01:10 ReachabilityCardinality.xml
-rw-r--r-- 1 mcc users 9.3K May 14 13:22 ReachabilityFireability.txt
-rw-r--r-- 1 mcc users 78K May 14 13:22 ReachabilityFireability.xml
-rw-r--r-- 1 mcc users 1.7K May 19 07:10 UpperBounds.txt
-rw-r--r-- 1 mcc users 3.9K May 19 15:24 UpperBounds.xml
-rw-r--r-- 1 mcc users 6 May 18 16:42 equiv_col
-rw-r--r-- 1 mcc users 7 May 18 16:42 instance
-rw-r--r-- 1 mcc users 6 May 18 16:42 iscolored
-rw-r--r-- 1 mcc users 16M May 18 16:42 model.pnml
--------------------
content from stdout:
=== Data for post analysis generated by BenchKit (invocation template)
The expected result is a vector of booleans
BOOL_VECTOR
here is the order used to build the result vector(from text file)
FORMULA_NAME BugTracking-PT-q8m128-LTLFireability-00
FORMULA_NAME BugTracking-PT-q8m128-LTLFireability-01
FORMULA_NAME BugTracking-PT-q8m128-LTLFireability-02
FORMULA_NAME BugTracking-PT-q8m128-LTLFireability-03
FORMULA_NAME BugTracking-PT-q8m128-LTLFireability-04
FORMULA_NAME BugTracking-PT-q8m128-LTLFireability-05
FORMULA_NAME BugTracking-PT-q8m128-LTLFireability-06
FORMULA_NAME BugTracking-PT-q8m128-LTLFireability-07
FORMULA_NAME BugTracking-PT-q8m128-LTLFireability-08
FORMULA_NAME BugTracking-PT-q8m128-LTLFireability-09
FORMULA_NAME BugTracking-PT-q8m128-LTLFireability-10
FORMULA_NAME BugTracking-PT-q8m128-LTLFireability-11
FORMULA_NAME BugTracking-PT-q8m128-LTLFireability-12
FORMULA_NAME BugTracking-PT-q8m128-LTLFireability-13
FORMULA_NAME BugTracking-PT-q8m128-LTLFireability-14
FORMULA_NAME BugTracking-PT-q8m128-LTLFireability-15
=== Now, execution of the tool begins
BK_START 1717224646689
Invoking MCC driver with
BK_TOOL=ltsminxred
BK_EXAMINATION=LTLFireability
BK_BIN_PATH=/home/mcc/BenchKit/bin/
BK_TIME_CONFINEMENT=3600
BK_INPUT=BugTracking-PT-q8m128
BK_MEMORY_CONFINEMENT=16384
Applying reductions before tool ltsmin
Invoking reducer
Running Version 202405141337
[2024-06-01 06:50:48] [INFO ] Running its-tools with arguments : [-pnfolder, /home/mcc/execution, -examination, LTLFireability, -timeout, 360, -rebuildPNML]
[2024-06-01 06:50:48] [INFO ] Parsing pnml file : /home/mcc/execution/model.pnml
[2024-06-01 06:50:49] [INFO ] Load time of PNML (sax parser for PT used): 872 ms
[2024-06-01 06:50:49] [INFO ] Transformed 754 places.
[2024-06-01 06:50:49] [INFO ] Transformed 27370 transitions.
[2024-06-01 06:50:49] [INFO ] Parsed PT model containing 754 places and 27370 transitions and 136172 arcs in 1107 ms.
Parsed 16 properties from file /home/mcc/execution/LTLFireability.xml in 37 ms.
Working with output stream class java.io.PrintStream
Initial state reduction rules removed 2 formulas.
Deduced a syphon composed of 474 places in 94 ms
Reduce places removed 474 places and 23466 transitions.
Initial state reduction rules removed 1 formulas.
FORMULA BugTracking-PT-q8m128-LTLFireability-00 FALSE TECHNIQUES TOPOLOGICAL INITIAL_STATE
FORMULA BugTracking-PT-q8m128-LTLFireability-01 FALSE TECHNIQUES TOPOLOGICAL INITIAL_STATE
FORMULA BugTracking-PT-q8m128-LTLFireability-03 FALSE TECHNIQUES TOPOLOGICAL INITIAL_STATE
FORMULA BugTracking-PT-q8m128-LTLFireability-04 FALSE TECHNIQUES TOPOLOGICAL INITIAL_STATE
FORMULA BugTracking-PT-q8m128-LTLFireability-06 FALSE TECHNIQUES TOPOLOGICAL INITIAL_STATE
FORMULA BugTracking-PT-q8m128-LTLFireability-07 FALSE TECHNIQUES TOPOLOGICAL INITIAL_STATE
FORMULA BugTracking-PT-q8m128-LTLFireability-08 FALSE TECHNIQUES TOPOLOGICAL INITIAL_STATE
FORMULA BugTracking-PT-q8m128-LTLFireability-10 FALSE TECHNIQUES TOPOLOGICAL INITIAL_STATE
FORMULA BugTracking-PT-q8m128-LTLFireability-11 FALSE TECHNIQUES TOPOLOGICAL INITIAL_STATE
FORMULA BugTracking-PT-q8m128-LTLFireability-12 FALSE TECHNIQUES TOPOLOGICAL INITIAL_STATE
FORMULA BugTracking-PT-q8m128-LTLFireability-14 FALSE TECHNIQUES TOPOLOGICAL INITIAL_STATE
FORMULA BugTracking-PT-q8m128-LTLFireability-09 FALSE TECHNIQUES TOPOLOGICAL INITIAL_STATE
FORMULA BugTracking-PT-q8m128-LTLFireability-13 FALSE TECHNIQUES TOPOLOGICAL INITIAL_STATE
FORMULA BugTracking-PT-q8m128-LTLFireability-15 FALSE TECHNIQUES TOPOLOGICAL INITIAL_STATE
Support contains 5 out of 280 places. Attempting structural reductions.
Starting structural reductions in LTL mode, iteration 0 : 280/280 places, 3904/3904 transitions.
Reduce places removed 2 places and 0 transitions.
Iterating post reduction 0 with 2 rules applied. Total rules applied 2 place count 278 transition count 3904
Discarding 1 places :
Symmetric choice reduction at 1 with 1 rule applications. Total rules 3 place count 277 transition count 3871
Iterating global reduction 1 with 1 rules applied. Total rules applied 4 place count 277 transition count 3871
Applied a total of 4 rules in 109 ms. Remains 277 /280 variables (removed 3) and now considering 3871/3904 (removed 33) transitions.
[2024-06-01 06:50:49] [INFO ] Flow matrix only has 3707 transitions (discarded 164 similar events)
// Phase 1: matrix 3707 rows 277 cols
[2024-06-01 06:50:49] [INFO ] Computed 8 invariants in 58 ms
[2024-06-01 06:50:50] [INFO ] Implicit Places using invariants in 720 ms returned []
[2024-06-01 06:50:50] [INFO ] Flow matrix only has 3707 transitions (discarded 164 similar events)
[2024-06-01 06:50:50] [INFO ] Invariant cache hit.
[2024-06-01 06:50:51] [INFO ] State equation strengthened by 282 read => feed constraints.
[2024-06-01 06:50:52] [INFO ] Implicit Places using invariants and state equation in 1993 ms returned []
Implicit Place search using SMT with State Equation took 2749 ms to find 0 implicit places.
Running 3869 sub problems to find dead transitions.
[2024-06-01 06:50:52] [INFO ] Flow matrix only has 3707 transitions (discarded 164 similar events)
[2024-06-01 06:50:52] [INFO ] Invariant cache hit.
[2024-06-01 06:50:52] [INFO ] State equation strengthened by 282 read => feed constraints.
At refinement iteration 0 (INCLUDED_ONLY) 0/276 variables, 8/8 constraints. Problems are: Problem set: 0 solved, 3869 unsolved
[2024-06-01 06:52:00] [INFO ] Deduced a trap composed of 10 places in 278 ms of which 19 ms to minimize.
[2024-06-01 06:52:01] [INFO ] Deduced a trap composed of 7 places in 224 ms of which 2 ms to minimize.
[2024-06-01 06:52:01] [INFO ] Deduced a trap composed of 23 places in 142 ms of which 1 ms to minimize.
[2024-06-01 06:52:10] [INFO ] Deduced a trap composed of 11 places in 38 ms of which 1 ms to minimize.
Problem TDEAD784 is UNSAT
Problem TDEAD790 is UNSAT
Problem TDEAD796 is UNSAT
Problem TDEAD802 is UNSAT
Problem TDEAD808 is UNSAT
Problem TDEAD809 is UNSAT
Problem TDEAD810 is UNSAT
Problem TDEAD811 is UNSAT
Problem TDEAD812 is UNSAT
Problem TDEAD813 is UNSAT
Problem TDEAD814 is UNSAT
Problem TDEAD817 is UNSAT
Problem TDEAD818 is UNSAT
Problem TDEAD819 is UNSAT
Solver is answering 'unknown', stopping.
After SMT solving in domain Real declared 276/3984 variables, and 12 constraints, problems are : Problem set: 14 solved, 3855 unsolved in 30082 ms.
Refiners :[Positive P Invariants (semi-flows): 8/8 constraints, State Equation: 0/277 constraints, ReadFeed: 0/282 constraints, PredecessorRefiner: 3869/2672 constraints, Known Traps: 4/4 constraints]
Escalating to Integer solving :Problem set: 14 solved, 3855 unsolved
At refinement iteration 0 (INCLUDED_ONLY) 0/276 variables, 8/8 constraints. Problems are: Problem set: 14 solved, 3855 unsolved
Problem TDEAD2706 is UNSAT
Problem TDEAD2715 is UNSAT
Problem TDEAD2727 is UNSAT
Problem TDEAD2731 is UNSAT
Problem TDEAD2740 is UNSAT
Problem TDEAD2752 is UNSAT
Problem TDEAD2756 is UNSAT
Problem TDEAD2765 is UNSAT
Problem TDEAD2777 is UNSAT
Problem TDEAD2781 is UNSAT
Problem TDEAD2782 is UNSAT
Problem TDEAD2783 is UNSAT
Problem TDEAD2784 is UNSAT
Problem TDEAD2785 is UNSAT
Problem TDEAD2786 is UNSAT
Problem TDEAD2787 is UNSAT
Problem TDEAD2788 is UNSAT
Problem TDEAD2789 is UNSAT
Problem TDEAD2790 is UNSAT
Problem TDEAD2794 is UNSAT
Problem TDEAD2795 is UNSAT
Problem TDEAD2796 is UNSAT
Problem TDEAD2797 is UNSAT
Problem TDEAD2798 is UNSAT
Problem TDEAD2799 is UNSAT
Problem TDEAD2800 is UNSAT
Problem TDEAD2801 is UNSAT
Problem TDEAD2802 is UNSAT
Problem TDEAD2803 is UNSAT
Problem TDEAD2804 is UNSAT
Problem TDEAD2805 is UNSAT
At refinement iteration 1 (INCLUDED_ONLY) 0/276 variables, 4/12 constraints. Problems are: Problem set: 45 solved, 3824 unsolved
Solver is answering 'unknown', stopping.
After SMT solving in domain Int declared 276/3984 variables, and 12 constraints, problems are : Problem set: 45 solved, 3824 unsolved in 30066 ms.
Refiners :[Positive P Invariants (semi-flows): 8/8 constraints, State Equation: 0/277 constraints, ReadFeed: 0/282 constraints, PredecessorRefiner: 1197/2672 constraints, Known Traps: 4/4 constraints]
After SMT, in 109000ms problems are : Problem set: 45 solved, 3824 unsolved
Search for dead transitions found 45 dead transitions in 109112ms
Found 45 dead transitions using SMT.
Drop transitions (Dead Transitions using SMT only with invariants) removed 45 transitions
Dead transitions reduction (with SMT) removed 45 transitions
Starting structural reductions in LTL mode, iteration 1 : 277/280 places, 3826/3904 transitions.
Reduce places removed 11 places and 334 transitions.
Iterating post reduction 0 with 11 rules applied. Total rules applied 11 place count 266 transition count 3492
Reduce places removed 5 places and 152 transitions.
Iterating post reduction 1 with 5 rules applied. Total rules applied 16 place count 261 transition count 3340
Reduce places removed 2 places and 56 transitions.
Iterating post reduction 2 with 2 rules applied. Total rules applied 18 place count 259 transition count 3284
Reduce places removed 1 places and 32 transitions.
Iterating post reduction 3 with 1 rules applied. Total rules applied 19 place count 258 transition count 3252
Discarding 1 places :
Symmetric choice reduction at 4 with 1 rule applications. Total rules 20 place count 257 transition count 3227
Iterating global reduction 4 with 1 rules applied. Total rules applied 21 place count 257 transition count 3227
Applied a total of 21 rules in 87 ms. Remains 257 /277 variables (removed 20) and now considering 3227/3826 (removed 599) transitions.
[2024-06-01 06:52:41] [INFO ] Flow matrix only has 3100 transitions (discarded 127 similar events)
// Phase 1: matrix 3100 rows 257 cols
[2024-06-01 06:52:41] [INFO ] Computed 8 invariants in 27 ms
[2024-06-01 06:52:42] [INFO ] Implicit Places using invariants in 944 ms returned []
[2024-06-01 06:52:42] [INFO ] Flow matrix only has 3100 transitions (discarded 127 similar events)
[2024-06-01 06:52:42] [INFO ] Invariant cache hit.
[2024-06-01 06:52:43] [INFO ] State equation strengthened by 251 read => feed constraints.
[2024-06-01 06:52:44] [INFO ] Implicit Places using invariants and state equation in 1882 ms returned []
Implicit Place search using SMT with State Equation took 2855 ms to find 0 implicit places.
Starting structural reductions in LTL mode, iteration 2 : 257/280 places, 3227/3904 transitions.
Finished structural reductions in LTL mode , in 2 iterations and 114965 ms. Remains : 257/280 places, 3227/3904 transitions.
Support contains 5 out of 257 places after structural reductions.
[2024-06-01 06:52:45] [INFO ] Flatten gal took : 449 ms
[2024-06-01 06:52:45] [INFO ] Flatten gal took : 205 ms
[2024-06-01 06:52:46] [INFO ] Input system was already deterministic with 3227 transitions.
RANDOM walk for 40054 steps (26 resets) in 1580 ms. (25 steps per ms) remains 2/2 properties
BEST_FIRST walk for 40004 steps (8 resets) in 205 ms. (194 steps per ms) remains 2/2 properties
BEST_FIRST walk for 40003 steps (8 resets) in 271 ms. (147 steps per ms) remains 2/2 properties
Interrupted probabilistic random walk after 141700 steps, run timeout after 3001 ms. (steps per millisecond=47 ) properties seen :0 out of 2
Probabilistic random walk after 141700 steps, saw 67714 distinct states, run finished after 3005 ms. (steps per millisecond=47 ) properties seen :0
[2024-06-01 06:52:50] [INFO ] Flow matrix only has 3100 transitions (discarded 127 similar events)
[2024-06-01 06:52:50] [INFO ] Invariant cache hit.
[2024-06-01 06:52:50] [INFO ] State equation strengthened by 251 read => feed constraints.
At refinement iteration 0 (INCLUDED_ONLY) 0/5 variables, 0/0 constraints. Problems are: Problem set: 0 solved, 2 unsolved
At refinement iteration 1 (OVERLAPS) 30/35 variables, 1/1 constraints. Problems are: Problem set: 0 solved, 2 unsolved
At refinement iteration 2 (INCLUDED_ONLY) 0/35 variables, 0/1 constraints. Problems are: Problem set: 0 solved, 2 unsolved
At refinement iteration 3 (OVERLAPS) 893/928 variables, 35/36 constraints. Problems are: Problem set: 0 solved, 2 unsolved
At refinement iteration 4 (INCLUDED_ONLY) 0/928 variables, 61/97 constraints. Problems are: Problem set: 0 solved, 2 unsolved
At refinement iteration 5 (INCLUDED_ONLY) 0/928 variables, 0/97 constraints. Problems are: Problem set: 0 solved, 2 unsolved
All remaining problems are real, not stopping.
At refinement iteration 6 (OVERLAPS) 1598/2526 variables, 70/167 constraints. Problems are: Problem set: 0 solved, 2 unsolved
At refinement iteration 7 (INCLUDED_ONLY) 0/2526 variables, 120/287 constraints. Problems are: Problem set: 0 solved, 2 unsolved
At refinement iteration 8 (INCLUDED_ONLY) 0/2526 variables, 0/287 constraints. Problems are: Problem set: 0 solved, 2 unsolved
At refinement iteration 9 (OVERLAPS) 8/2534 variables, 2/289 constraints. Problems are: Problem set: 0 solved, 2 unsolved
At refinement iteration 10 (INCLUDED_ONLY) 0/2534 variables, 0/289 constraints. Problems are: Problem set: 0 solved, 2 unsolved
At refinement iteration 11 (OVERLAPS) 767/3301 variables, 121/410 constraints. Problems are: Problem set: 0 solved, 2 unsolved
At refinement iteration 12 (INCLUDED_ONLY) 0/3301 variables, 3/413 constraints. Problems are: Problem set: 0 solved, 2 unsolved
At refinement iteration 13 (INCLUDED_ONLY) 0/3301 variables, 64/477 constraints. Problems are: Problem set: 0 solved, 2 unsolved
At refinement iteration 14 (INCLUDED_ONLY) 0/3301 variables, 0/477 constraints. Problems are: Problem set: 0 solved, 2 unsolved
At refinement iteration 15 (OVERLAPS) 2/3303 variables, 1/478 constraints. Problems are: Problem set: 0 solved, 2 unsolved
At refinement iteration 16 (INCLUDED_ONLY) 0/3303 variables, 2/480 constraints. Problems are: Problem set: 0 solved, 2 unsolved
At refinement iteration 17 (INCLUDED_ONLY) 0/3303 variables, 0/480 constraints. Problems are: Problem set: 0 solved, 2 unsolved
At refinement iteration 18 (OVERLAPS) 53/3356 variables, 28/508 constraints. Problems are: Problem set: 0 solved, 2 unsolved
At refinement iteration 19 (INCLUDED_ONLY) 0/3356 variables, 1/509 constraints. Problems are: Problem set: 0 solved, 2 unsolved
At refinement iteration 20 (INCLUDED_ONLY) 0/3356 variables, 6/515 constraints. Problems are: Problem set: 0 solved, 2 unsolved
At refinement iteration 21 (INCLUDED_ONLY) 0/3356 variables, 0/515 constraints. Problems are: Problem set: 0 solved, 2 unsolved
At refinement iteration 22 (OVERLAPS) 1/3357 variables, 1/516 constraints. Problems are: Problem set: 0 solved, 2 unsolved
At refinement iteration 23 (INCLUDED_ONLY) 0/3357 variables, 0/516 constraints. Problems are: Problem set: 0 solved, 2 unsolved
At refinement iteration 24 (OVERLAPS) 0/3357 variables, 0/516 constraints. Problems are: Problem set: 0 solved, 2 unsolved
No progress, stopping.
After SMT solving in domain Real declared 3357/3357 variables, and 516 constraints, problems are : Problem set: 0 solved, 2 unsolved in 2024 ms.
Refiners :[Positive P Invariants (semi-flows): 8/8 constraints, State Equation: 257/257 constraints, ReadFeed: 251/251 constraints, PredecessorRefiner: 2/2 constraints, Known Traps: 0/0 constraints]
Escalating to Integer solving :Problem set: 0 solved, 2 unsolved
At refinement iteration 0 (INCLUDED_ONLY) 0/5 variables, 0/0 constraints. Problems are: Problem set: 0 solved, 2 unsolved
At refinement iteration 1 (OVERLAPS) 30/35 variables, 1/1 constraints. Problems are: Problem set: 0 solved, 2 unsolved
At refinement iteration 2 (INCLUDED_ONLY) 0/35 variables, 0/1 constraints. Problems are: Problem set: 0 solved, 2 unsolved
At refinement iteration 3 (OVERLAPS) 893/928 variables, 35/36 constraints. Problems are: Problem set: 0 solved, 2 unsolved
At refinement iteration 4 (INCLUDED_ONLY) 0/928 variables, 61/97 constraints. Problems are: Problem set: 0 solved, 2 unsolved
At refinement iteration 5 (INCLUDED_ONLY) 0/928 variables, 0/97 constraints. Problems are: Problem set: 0 solved, 2 unsolved
At refinement iteration 6 (OVERLAPS) 1598/2526 variables, 70/167 constraints. Problems are: Problem set: 0 solved, 2 unsolved
At refinement iteration 7 (INCLUDED_ONLY) 0/2526 variables, 120/287 constraints. Problems are: Problem set: 0 solved, 2 unsolved
At refinement iteration 8 (INCLUDED_ONLY) 0/2526 variables, 0/287 constraints. Problems are: Problem set: 0 solved, 2 unsolved
At refinement iteration 9 (OVERLAPS) 8/2534 variables, 2/289 constraints. Problems are: Problem set: 0 solved, 2 unsolved
At refinement iteration 10 (INCLUDED_ONLY) 0/2534 variables, 0/289 constraints. Problems are: Problem set: 0 solved, 2 unsolved
At refinement iteration 11 (OVERLAPS) 767/3301 variables, 121/410 constraints. Problems are: Problem set: 0 solved, 2 unsolved
At refinement iteration 12 (INCLUDED_ONLY) 0/3301 variables, 3/413 constraints. Problems are: Problem set: 0 solved, 2 unsolved
At refinement iteration 13 (INCLUDED_ONLY) 0/3301 variables, 64/477 constraints. Problems are: Problem set: 0 solved, 2 unsolved
At refinement iteration 14 (INCLUDED_ONLY) 0/3301 variables, 2/479 constraints. Problems are: Problem set: 0 solved, 2 unsolved
[2024-06-01 06:52:53] [INFO ] Deduced a trap composed of 23 places in 260 ms of which 1 ms to minimize.
Problem AtomicPropp0 is UNSAT
[2024-06-01 06:52:54] [INFO ] Deduced a trap composed of 17 places in 116 ms of which 1 ms to minimize.
At refinement iteration 15 (INCLUDED_ONLY) 0/3301 variables, 2/481 constraints. Problems are: Problem set: 1 solved, 1 unsolved
At refinement iteration 16 (INCLUDED_ONLY) 0/3301 variables, 0/481 constraints. Problems are: Problem set: 1 solved, 1 unsolved
At refinement iteration 17 (OVERLAPS) 2/3303 variables, 1/482 constraints. Problems are: Problem set: 1 solved, 1 unsolved
At refinement iteration 18 (INCLUDED_ONLY) 0/3303 variables, 2/484 constraints. Problems are: Problem set: 1 solved, 1 unsolved
At refinement iteration 19 (INCLUDED_ONLY) 0/3303 variables, 0/484 constraints. Problems are: Problem set: 1 solved, 1 unsolved
At refinement iteration 20 (OVERLAPS) 53/3356 variables, 28/512 constraints. Problems are: Problem set: 1 solved, 1 unsolved
At refinement iteration 21 (INCLUDED_ONLY) 0/3356 variables, 1/513 constraints. Problems are: Problem set: 1 solved, 1 unsolved
At refinement iteration 22 (INCLUDED_ONLY) 0/3356 variables, 6/519 constraints. Problems are: Problem set: 1 solved, 1 unsolved
At refinement iteration 23 (INCLUDED_ONLY) 0/3356 variables, 0/519 constraints. Problems are: Problem set: 1 solved, 1 unsolved
At refinement iteration 24 (OVERLAPS) 1/3357 variables, 1/520 constraints. Problems are: Problem set: 1 solved, 1 unsolved
At refinement iteration 25 (INCLUDED_ONLY) 0/3357 variables, 0/520 constraints. Problems are: Problem set: 1 solved, 1 unsolved
At refinement iteration 26 (OVERLAPS) 0/3357 variables, 0/520 constraints. Problems are: Problem set: 1 solved, 1 unsolved
No progress, stopping.
After SMT solving in domain Int declared 3357/3357 variables, and 520 constraints, problems are : Problem set: 1 solved, 1 unsolved in 2878 ms.
Refiners :[Positive P Invariants (semi-flows): 8/8 constraints, State Equation: 257/257 constraints, ReadFeed: 251/251 constraints, PredecessorRefiner: 2/2 constraints, Known Traps: 2/2 constraints]
After SMT, in 5021ms problems are : Problem set: 1 solved, 1 unsolved
Parikh walk visited 0 properties in 254 ms.
Support contains 3 out of 257 places. Attempting structural reductions.
Starting structural reductions in REACHABILITY mode, iteration 0 : 257/257 places, 3227/3227 transitions.
Performed 2 Post agglomeration using F-continuation condition.Transition count delta: -5
Deduced a syphon composed of 2 places in 16 ms
Reduce places removed 2 places and 0 transitions.
Iterating global reduction 0 with 4 rules applied. Total rules applied 4 place count 255 transition count 3232
Free-agglomeration rule applied 6 times.
Iterating global reduction 0 with 6 rules applied. Total rules applied 10 place count 255 transition count 3226
Reduce places removed 6 places and 0 transitions.
Iterating post reduction 0 with 6 rules applied. Total rules applied 16 place count 249 transition count 3226
Applied a total of 16 rules in 461 ms. Remains 249 /257 variables (removed 8) and now considering 3226/3227 (removed 1) transitions.
Finished structural reductions in REACHABILITY mode , in 1 iterations and 462 ms. Remains : 249/257 places, 3226/3227 transitions.
RANDOM walk for 40199 steps (8 resets) in 56 ms. (705 steps per ms) remains 1/1 properties
BEST_FIRST walk for 40002 steps (8 resets) in 475 ms. (84 steps per ms) remains 1/1 properties
Interrupted probabilistic random walk after 137618 steps, run timeout after 3001 ms. (steps per millisecond=45 ) properties seen :0 out of 1
Probabilistic random walk after 137618 steps, saw 59138 distinct states, run finished after 3001 ms. (steps per millisecond=45 ) properties seen :0
[2024-06-01 06:52:59] [INFO ] Flow matrix only has 3092 transitions (discarded 134 similar events)
// Phase 1: matrix 3092 rows 249 cols
[2024-06-01 06:52:59] [INFO ] Computed 8 invariants in 37 ms
[2024-06-01 06:52:59] [INFO ] State equation strengthened by 252 read => feed constraints.
At refinement iteration 0 (INCLUDED_ONLY) 0/3 variables, 0/0 constraints. Problems are: Problem set: 0 solved, 1 unsolved
At refinement iteration 1 (OVERLAPS) 31/34 variables, 1/1 constraints. Problems are: Problem set: 0 solved, 1 unsolved
At refinement iteration 2 (INCLUDED_ONLY) 0/34 variables, 0/1 constraints. Problems are: Problem set: 0 solved, 1 unsolved
At refinement iteration 3 (OVERLAPS) 891/925 variables, 34/35 constraints. Problems are: Problem set: 0 solved, 1 unsolved
At refinement iteration 4 (INCLUDED_ONLY) 0/925 variables, 61/96 constraints. Problems are: Problem set: 0 solved, 1 unsolved
At refinement iteration 5 (INCLUDED_ONLY) 0/925 variables, 0/96 constraints. Problems are: Problem set: 0 solved, 1 unsolved
All remaining problems are real, not stopping.
At refinement iteration 6 (OVERLAPS) 1485/2410 variables, 69/165 constraints. Problems are: Problem set: 0 solved, 1 unsolved
At refinement iteration 7 (INCLUDED_ONLY) 0/2410 variables, 104/269 constraints. Problems are: Problem set: 0 solved, 1 unsolved
At refinement iteration 8 (INCLUDED_ONLY) 0/2410 variables, 0/269 constraints. Problems are: Problem set: 0 solved, 1 unsolved
At refinement iteration 9 (OVERLAPS) 4/2414 variables, 1/270 constraints. Problems are: Problem set: 0 solved, 1 unsolved
At refinement iteration 10 (INCLUDED_ONLY) 0/2414 variables, 0/270 constraints. Problems are: Problem set: 0 solved, 1 unsolved
At refinement iteration 11 (OVERLAPS) 820/3234 variables, 96/366 constraints. Problems are: Problem set: 0 solved, 1 unsolved
At refinement iteration 12 (INCLUDED_ONLY) 0/3234 variables, 3/369 constraints. Problems are: Problem set: 0 solved, 1 unsolved
At refinement iteration 13 (INCLUDED_ONLY) 0/3234 variables, 72/441 constraints. Problems are: Problem set: 0 solved, 1 unsolved
At refinement iteration 14 (INCLUDED_ONLY) 0/3234 variables, 0/441 constraints. Problems are: Problem set: 0 solved, 1 unsolved
At refinement iteration 15 (OVERLAPS) 1/3235 variables, 1/442 constraints. Problems are: Problem set: 0 solved, 1 unsolved
At refinement iteration 16 (INCLUDED_ONLY) 0/3235 variables, 1/443 constraints. Problems are: Problem set: 0 solved, 1 unsolved
At refinement iteration 17 (INCLUDED_ONLY) 0/3235 variables, 0/443 constraints. Problems are: Problem set: 0 solved, 1 unsolved
At refinement iteration 18 (OVERLAPS) 105/3340 variables, 48/491 constraints. Problems are: Problem set: 0 solved, 1 unsolved
At refinement iteration 19 (INCLUDED_ONLY) 0/3340 variables, 2/493 constraints. Problems are: Problem set: 0 solved, 1 unsolved
At refinement iteration 20 (INCLUDED_ONLY) 0/3340 variables, 15/508 constraints. Problems are: Problem set: 0 solved, 1 unsolved
At refinement iteration 21 (INCLUDED_ONLY) 0/3340 variables, 0/508 constraints. Problems are: Problem set: 0 solved, 1 unsolved
At refinement iteration 22 (OVERLAPS) 1/3341 variables, 1/509 constraints. Problems are: Problem set: 0 solved, 1 unsolved
At refinement iteration 23 (INCLUDED_ONLY) 0/3341 variables, 0/509 constraints. Problems are: Problem set: 0 solved, 1 unsolved
At refinement iteration 24 (OVERLAPS) 0/3341 variables, 0/509 constraints. Problems are: Problem set: 0 solved, 1 unsolved
No progress, stopping.
After SMT solving in domain Real declared 3341/3341 variables, and 509 constraints, problems are : Problem set: 0 solved, 1 unsolved in 979 ms.
Refiners :[Positive P Invariants (semi-flows): 8/8 constraints, State Equation: 249/249 constraints, ReadFeed: 252/252 constraints, PredecessorRefiner: 1/1 constraints, Known Traps: 0/0 constraints]
Escalating to Integer solving :Problem set: 0 solved, 1 unsolved
At refinement iteration 0 (INCLUDED_ONLY) 0/3 variables, 0/0 constraints. Problems are: Problem set: 0 solved, 1 unsolved
At refinement iteration 1 (OVERLAPS) 31/34 variables, 1/1 constraints. Problems are: Problem set: 0 solved, 1 unsolved
At refinement iteration 2 (INCLUDED_ONLY) 0/34 variables, 0/1 constraints. Problems are: Problem set: 0 solved, 1 unsolved
At refinement iteration 3 (OVERLAPS) 891/925 variables, 34/35 constraints. Problems are: Problem set: 0 solved, 1 unsolved
At refinement iteration 4 (INCLUDED_ONLY) 0/925 variables, 61/96 constraints. Problems are: Problem set: 0 solved, 1 unsolved
At refinement iteration 5 (INCLUDED_ONLY) 0/925 variables, 0/96 constraints. Problems are: Problem set: 0 solved, 1 unsolved
At refinement iteration 6 (OVERLAPS) 1485/2410 variables, 69/165 constraints. Problems are: Problem set: 0 solved, 1 unsolved
At refinement iteration 7 (INCLUDED_ONLY) 0/2410 variables, 104/269 constraints. Problems are: Problem set: 0 solved, 1 unsolved
At refinement iteration 8 (INCLUDED_ONLY) 0/2410 variables, 0/269 constraints. Problems are: Problem set: 0 solved, 1 unsolved
At refinement iteration 9 (OVERLAPS) 4/2414 variables, 1/270 constraints. Problems are: Problem set: 0 solved, 1 unsolved
At refinement iteration 10 (INCLUDED_ONLY) 0/2414 variables, 0/270 constraints. Problems are: Problem set: 0 solved, 1 unsolved
At refinement iteration 11 (OVERLAPS) 820/3234 variables, 96/366 constraints. Problems are: Problem set: 0 solved, 1 unsolved
At refinement iteration 12 (INCLUDED_ONLY) 0/3234 variables, 3/369 constraints. Problems are: Problem set: 0 solved, 1 unsolved
At refinement iteration 13 (INCLUDED_ONLY) 0/3234 variables, 72/441 constraints. Problems are: Problem set: 0 solved, 1 unsolved
At refinement iteration 14 (INCLUDED_ONLY) 0/3234 variables, 1/442 constraints. Problems are: Problem set: 0 solved, 1 unsolved
[2024-06-01 06:53:01] [INFO ] Deduced a trap composed of 17 places in 307 ms of which 2 ms to minimize.
At refinement iteration 15 (INCLUDED_ONLY) 0/3234 variables, 1/443 constraints. Problems are: Problem set: 0 solved, 1 unsolved
At refinement iteration 16 (INCLUDED_ONLY) 0/3234 variables, 0/443 constraints. Problems are: Problem set: 0 solved, 1 unsolved
At refinement iteration 17 (OVERLAPS) 1/3235 variables, 1/444 constraints. Problems are: Problem set: 0 solved, 1 unsolved
At refinement iteration 18 (INCLUDED_ONLY) 0/3235 variables, 1/445 constraints. Problems are: Problem set: 0 solved, 1 unsolved
At refinement iteration 19 (INCLUDED_ONLY) 0/3235 variables, 0/445 constraints. Problems are: Problem set: 0 solved, 1 unsolved
At refinement iteration 20 (OVERLAPS) 105/3340 variables, 48/493 constraints. Problems are: Problem set: 0 solved, 1 unsolved
At refinement iteration 21 (INCLUDED_ONLY) 0/3340 variables, 2/495 constraints. Problems are: Problem set: 0 solved, 1 unsolved
At refinement iteration 22 (INCLUDED_ONLY) 0/3340 variables, 15/510 constraints. Problems are: Problem set: 0 solved, 1 unsolved
At refinement iteration 23 (INCLUDED_ONLY) 0/3340 variables, 0/510 constraints. Problems are: Problem set: 0 solved, 1 unsolved
At refinement iteration 24 (OVERLAPS) 1/3341 variables, 1/511 constraints. Problems are: Problem set: 0 solved, 1 unsolved
At refinement iteration 25 (INCLUDED_ONLY) 0/3341 variables, 0/511 constraints. Problems are: Problem set: 0 solved, 1 unsolved
At refinement iteration 26 (OVERLAPS) 0/3341 variables, 0/511 constraints. Problems are: Problem set: 0 solved, 1 unsolved
No progress, stopping.
After SMT solving in domain Int declared 3341/3341 variables, and 511 constraints, problems are : Problem set: 0 solved, 1 unsolved in 2333 ms.
Refiners :[Positive P Invariants (semi-flows): 8/8 constraints, State Equation: 249/249 constraints, ReadFeed: 252/252 constraints, PredecessorRefiner: 1/1 constraints, Known Traps: 1/1 constraints]
After SMT, in 3414ms problems are : Problem set: 0 solved, 1 unsolved
Parikh walk visited 0 properties in 132 ms.
Support contains 3 out of 249 places. Attempting structural reductions.
Starting structural reductions in REACHABILITY mode, iteration 0 : 249/249 places, 3226/3226 transitions.
Applied a total of 0 rules in 55 ms. Remains 249 /249 variables (removed 0) and now considering 3226/3226 (removed 0) transitions.
Finished structural reductions in REACHABILITY mode , in 1 iterations and 56 ms. Remains : 249/249 places, 3226/3226 transitions.
Starting structural reductions in REACHABILITY mode, iteration 0 : 249/249 places, 3226/3226 transitions.
Applied a total of 0 rules in 54 ms. Remains 249 /249 variables (removed 0) and now considering 3226/3226 (removed 0) transitions.
[2024-06-01 06:53:02] [INFO ] Flow matrix only has 3092 transitions (discarded 134 similar events)
[2024-06-01 06:53:02] [INFO ] Invariant cache hit.
[2024-06-01 06:53:03] [INFO ] Implicit Places using invariants in 717 ms returned []
[2024-06-01 06:53:03] [INFO ] Flow matrix only has 3092 transitions (discarded 134 similar events)
[2024-06-01 06:53:03] [INFO ] Invariant cache hit.
[2024-06-01 06:53:03] [INFO ] State equation strengthened by 252 read => feed constraints.
[2024-06-01 06:53:04] [INFO ] Implicit Places using invariants and state equation in 1531 ms returned []
Implicit Place search using SMT with State Equation took 2269 ms to find 0 implicit places.
[2024-06-01 06:53:05] [INFO ] Redundant transitions in 186 ms returned []
Running 3225 sub problems to find dead transitions.
[2024-06-01 06:53:05] [INFO ] Flow matrix only has 3092 transitions (discarded 134 similar events)
[2024-06-01 06:53:05] [INFO ] Invariant cache hit.
[2024-06-01 06:53:05] [INFO ] State equation strengthened by 252 read => feed constraints.
FORMULA BugTracking-PT-q8m128-LTLFireability-00 FALSE TECHNIQUES EXPLICIT PARALLEL_PROCESSING USE_NUPN
FORMULA BugTracking-PT-q8m128-LTLFireability-01 FALSE TECHNIQUES EXPLICIT PARALLEL_PROCESSING USE_NUPN
Could not compute solution for formula : BugTracking-PT-q8m128-LTLFireability-02
FORMULA BugTracking-PT-q8m128-LTLFireability-03 FALSE TECHNIQUES EXPLICIT PARALLEL_PROCESSING USE_NUPN
FORMULA BugTracking-PT-q8m128-LTLFireability-04 FALSE TECHNIQUES EXPLICIT PARALLEL_PROCESSING USE_NUPN
Could not compute solution for formula : BugTracking-PT-q8m128-LTLFireability-05
FORMULA BugTracking-PT-q8m128-LTLFireability-06 FALSE TECHNIQUES EXPLICIT PARALLEL_PROCESSING USE_NUPN
FORMULA BugTracking-PT-q8m128-LTLFireability-07 FALSE TECHNIQUES EXPLICIT PARALLEL_PROCESSING USE_NUPN
FORMULA BugTracking-PT-q8m128-LTLFireability-08 FALSE TECHNIQUES EXPLICIT PARALLEL_PROCESSING USE_NUPN
FORMULA BugTracking-PT-q8m128-LTLFireability-09 FALSE TECHNIQUES EXPLICIT PARALLEL_PROCESSING USE_NUPN
FORMULA BugTracking-PT-q8m128-LTLFireability-10 FALSE TECHNIQUES EXPLICIT PARALLEL_PROCESSING USE_NUPN
FORMULA BugTracking-PT-q8m128-LTLFireability-11 FALSE TECHNIQUES EXPLICIT PARALLEL_PROCESSING USE_NUPN
FORMULA BugTracking-PT-q8m128-LTLFireability-12 FALSE TECHNIQUES EXPLICIT PARALLEL_PROCESSING USE_NUPN
FORMULA BugTracking-PT-q8m128-LTLFireability-13 FALSE TECHNIQUES EXPLICIT PARALLEL_PROCESSING USE_NUPN
FORMULA BugTracking-PT-q8m128-LTLFireability-14 FALSE TECHNIQUES EXPLICIT PARALLEL_PROCESSING USE_NUPN
FORMULA BugTracking-PT-q8m128-LTLFireability-15 FALSE TECHNIQUES EXPLICIT PARALLEL_PROCESSING USE_NUPN
BK_STOP 1717225387801
--------------------
content from stderr:
+ ulimit -s 65536
+ [[ -z '' ]]
+ export LTSMIN_MEM_SIZE=8589934592
+ LTSMIN_MEM_SIZE=8589934592
+ export PYTHONPATH=/home/mcc/BenchKit/itstools/pylibs
+ PYTHONPATH=/home/mcc/BenchKit/itstools/pylibs
+ export LD_LIBRARY_PATH=/home/mcc/BenchKit/itstools/pylibs:
+ LD_LIBRARY_PATH=/home/mcc/BenchKit/itstools/pylibs:
++ sed s/.jar//
++ perl -pe 's/.*\.//g'
++ ls /home/mcc/BenchKit/bin//../reducer/bin//../../itstools//itstools/plugins/fr.lip6.move.gal.application.pnmcc_1.0.0.202405141337.jar
+ VERSION=202405141337
+ echo 'Running Version 202405141337'
+ /home/mcc/BenchKit/bin//../reducer/bin//../../itstools//itstools/its-tools -pnfolder /home/mcc/execution -examination LTLFireability -timeout 360 -rebuildPNML
mcc2024
ltl formula name BugTracking-PT-q8m128-LTLFireability-00
ltl formula formula --ltl=/tmp/602/ltl_0_
pnml2lts-mc( 0/ 4): Loading model from model.pnml
pnml2lts-mc( 0/ 4): Edge label is id
Warning: program compiled against libxml 210 using older 209
Warning: program compiled against libxml 210 using older 209
Warning: program compiled against libxml 210 using older 209
Warning: program compiled against libxml 210 using older 209
pnml2lts-mc( 0/ 4): Petri net has 754 places, 27370 transitions and 136172 arcs
pnml2lts-mc( 0/ 4): Petri net BugTracking-PT-q8 analyzed
pnml2lts-mc( 0/ 4): There are no safe places
pnml2lts-mc( 0/ 4): Loading Petri net took 5.330 real 1.110 user 1.070 sys
pnml2lts-mc( 0/ 4): LTL layer: formula: /tmp/602/ltl_0_
pnml2lts-mc( 2/ 4): LTL layer: formula: /tmp/602/ltl_0_
pnml2lts-mc( 3/ 4): LTL layer: formula: /tmp/602/ltl_0_
pnml2lts-mc( 1/ 4): LTL layer: formula: /tmp/602/ltl_0_
pnml2lts-mc( 0/ 4): buchi has 4 states
pnml2lts-mc( 0/ 4): Weak Buchi automaton detected, adding non-accepting as progress label.
pnml2lts-mc( 0/ 4): There are 754 state labels and 1 edge labels
pnml2lts-mc( 0/ 4): State length is 755, there are 27377 groups
pnml2lts-mc( 0/ 4): Running ufscc using 4 cores
pnml2lts-mc( 0/ 4): Using a tree table with 2^25 elements
pnml2lts-mc( 0/ 4): Successor permutation: dynamic
pnml2lts-mc( 0/ 4): Global bits: 0, count bits: 0, local bits: 0
pnml2lts-mc( 3/ 4):
pnml2lts-mc( 3/ 4): Accepting cycle FOUND at depth ~129!
pnml2lts-mc( 3/ 4):
pnml2lts-mc( 0/ 4):
pnml2lts-mc( 0/ 4): total scc count: 0
pnml2lts-mc( 0/ 4): unique states count: 473
pnml2lts-mc( 0/ 4): unique transitions count: 1289
pnml2lts-mc( 0/ 4): - self-loop count: 1
pnml2lts-mc( 0/ 4): - claim dead count: 0
pnml2lts-mc( 0/ 4): - claim found count: 0
pnml2lts-mc( 0/ 4): - claim success count: 479
pnml2lts-mc( 0/ 4): - cum. max stack depth: 479
pnml2lts-mc( 0/ 4):
pnml2lts-mc( 0/ 4): Explored 479 states 1305 transitions, fanout: 2.724
pnml2lts-mc( 0/ 4): Total exploration time 0.640 sec (0.620 sec minimum, 0.632 sec on average)
pnml2lts-mc( 0/ 4): States per second: 748, Transitions per second: 2039
pnml2lts-mc( 0/ 4):
pnml2lts-mc( 0/ 4): Queue width: 12B, total height: 0, memory: 0.00MB
pnml2lts-mc( 0/ 4): Tree memory: 0.1MB, 69.6 B/state, compr.: 2.3%
pnml2lts-mc( 0/ 4): Tree fill ratio (roots/leafs): 0.0%/0.0%
pnml2lts-mc( 0/ 4): Stored 27880 string chucks using 0MB
pnml2lts-mc( 0/ 4): Total memory used for chunk indexing: 1MB
pnml2lts-mc( 0/ 4): Est. total memory use: 1.1MB (~257.0MB paged-in)
ltl formula name BugTracking-PT-q8m128-LTLFireability-01
ltl formula formula --ltl=/tmp/602/ltl_1_
pnml2lts-mc( 0/ 4): Loading model from model.pnml
pnml2lts-mc( 0/ 4): Edge label is id
Warning: program compiled against libxml 210 using older 209
Warning: program compiled against libxml 210 using older 209
Warning: program compiled against libxml 210 using older 209
Warning: program compiled against libxml 210 using older 209
pnml2lts-mc( 0/ 4): Petri net has 754 places, 27370 transitions and 136172 arcs
pnml2lts-mc( 0/ 4): Petri net BugTracking-PT-q8 analyzed
pnml2lts-mc( 0/ 4): There are no safe places
pnml2lts-mc( 0/ 4): Loading Petri net took 4.620 real 1.140 user 0.940 sys
pnml2lts-mc( 2/ 4): LTL layer: formula: /tmp/602/ltl_1_
pnml2lts-mc( 0/ 4): LTL layer: formula: /tmp/602/ltl_1_
pnml2lts-mc( 1/ 4): LTL layer: formula: /tmp/602/ltl_1_
pnml2lts-mc( 3/ 4): LTL layer: formula: /tmp/602/ltl_1_
pnml2lts-mc( 0/ 4): buchi has 4 states
pnml2lts-mc( 0/ 4): There are 753 state labels and 1 edge labels
pnml2lts-mc( 0/ 4): State length is 755, there are 27377 groups
pnml2lts-mc( 0/ 4): Running ufscc using 4 cores
pnml2lts-mc( 0/ 4): Using a tree table with 2^25 elements
pnml2lts-mc( 0/ 4): Successor permutation: dynamic
pnml2lts-mc( 0/ 4): Global bits: 0, count bits: 0, local bits: 0
pnml2lts-mc( 2/ 4):
pnml2lts-mc( 2/ 4): Accepting cycle FOUND at depth ~129!
pnml2lts-mc( 2/ 4):
pnml2lts-mc( 0/ 4):
pnml2lts-mc( 0/ 4): total scc count: 0
pnml2lts-mc( 0/ 4): unique states count: 470
pnml2lts-mc( 0/ 4): unique transitions count: 1401
pnml2lts-mc( 0/ 4): - self-loop count: 1
pnml2lts-mc( 0/ 4): - claim dead count: 0
pnml2lts-mc( 0/ 4): - claim found count: 0
pnml2lts-mc( 0/ 4): - claim success count: 476
pnml2lts-mc( 0/ 4): - cum. max stack depth: 476
pnml2lts-mc( 0/ 4):
pnml2lts-mc( 0/ 4): Explored 476 states 1419 transitions, fanout: 2.981
pnml2lts-mc( 0/ 4): Total exploration time 0.590 sec (0.580 sec minimum, 0.585 sec on average)
pnml2lts-mc( 0/ 4): States per second: 807, Transitions per second: 2405
pnml2lts-mc( 0/ 4):
pnml2lts-mc( 0/ 4): Queue width: 12B, total height: 0, memory: 0.00MB
pnml2lts-mc( 0/ 4): Tree memory: 0.1MB, 55.7 B/state, compr.: 1.8%
pnml2lts-mc( 0/ 4): Tree fill ratio (roots/leafs): 0.0%/0.0%
pnml2lts-mc( 0/ 4): Stored 27880 string chucks using 0MB
pnml2lts-mc( 0/ 4): Total memory used for chunk indexing: 1MB
pnml2lts-mc( 0/ 4): Est. total memory use: 1.1MB (~257.0MB paged-in)
ltl formula name BugTracking-PT-q8m128-LTLFireability-02
ltl formula formula --ltl=/tmp/602/ltl_2_
pnml2lts-mc( 0/ 4): Loading model from model.pnml
pnml2lts-mc( 0/ 4): Edge label is id
Warning: program compiled against libxml 210 using older 209
Warning: program compiled against libxml 210 using older 209
Warning: program compiled against libxml 210 using older 209
Warning: program compiled against libxml 210 using older 209
pnml2lts-mc( 0/ 4): Petri net has 754 places, 27370 transitions and 136172 arcs
pnml2lts-mc( 0/ 4): Petri net BugTracking-PT-q8 analyzed
pnml2lts-mc( 0/ 4): There are no safe places
pnml2lts-mc( 0/ 4): Loading Petri net took 4.960 real 1.150 user 0.900 sys
pnml2lts-mc( 1/ 4): LTL layer: formula: /tmp/602/ltl_2_
pnml2lts-mc( 2/ 4): LTL layer: formula: /tmp/602/ltl_2_
pnml2lts-mc( 3/ 4): LTL layer: formula: /tmp/602/ltl_2_
pnml2lts-mc( 0/ 4): LTL layer: formula: /tmp/602/ltl_2_
pnml2lts-mc( 0/ 4): buchi has 3 states
pnml2lts-mc( 0/ 4): Weak Buchi automaton detected, adding non-accepting as progress label.
pnml2lts-mc( 0/ 4): There are 754 state labels and 1 edge labels
pnml2lts-mc( 0/ 4): State length is 755, there are 27376 groups
pnml2lts-mc( 0/ 4): Running ufscc using 4 cores
pnml2lts-mc( 0/ 4): Using a tree table with 2^25 elements
pnml2lts-mc( 0/ 4): Successor permutation: dynamic
pnml2lts-mc( 0/ 4): Global bits: 0, count bits: 0, local bits: 0
pnml2lts-mc( 2/ 4): ~2500 levels ~10000 states ~32704 transitions
pnml2lts-mc( 2/ 4): ~5000 levels ~20000 states ~65560 transitions
pnml2lts-mc( 1/ 4): ~8755 levels ~40000 states ~118420 transitions
pnml2lts-mc( 1/ 4): ~16380 levels ~80000 states ~228632 transitions
pnml2lts-mc( 3/ 4): ~40000 levels ~160000 states ~479988 transitions
pnml2lts-mc( 3/ 4): ~80000 levels ~320000 states ~959992 transitions
ltl formula name BugTracking-PT-q8m128-LTLFireability-03
ltl formula formula --ltl=/tmp/602/ltl_3_
pnml2lts-mc( 0/ 4): Loading model from model.pnml
pnml2lts-mc( 0/ 4): Edge label is id
Warning: program compiled against libxml 210 using older 209
Warning: program compiled against libxml 210 using older 209
Warning: program compiled against libxml 210 using older 209
Warning: program compiled against libxml 210 using older 209
pnml2lts-mc( 0/ 4): Petri net has 754 places, 27370 transitions and 136172 arcs
pnml2lts-mc( 0/ 4): Petri net BugTracking-PT-q8 analyzed
pnml2lts-mc( 0/ 4): There are no safe places
pnml2lts-mc( 0/ 4): Loading Petri net took 3.690 real 1.280 user 1.120 sys
pnml2lts-mc( 1/ 4): LTL layer: formula: /tmp/602/ltl_3_
pnml2lts-mc( 3/ 4): LTL layer: formula: /tmp/602/ltl_3_
pnml2lts-mc( 0/ 4): LTL layer: formula: /tmp/602/ltl_3_
pnml2lts-mc( 2/ 4): LTL layer: formula: /tmp/602/ltl_3_
pnml2lts-mc( 0/ 4): buchi has 5 states
pnml2lts-mc( 0/ 4): Weak Buchi automaton detected, adding non-accepting as progress label.
pnml2lts-mc( 0/ 4): There are 754 state labels and 1 edge labels
pnml2lts-mc( 0/ 4): State length is 755, there are 27381 groups
pnml2lts-mc( 0/ 4): Running ufscc using 4 cores
pnml2lts-mc( 0/ 4): Using a tree table with 2^25 elements
pnml2lts-mc( 0/ 4): Successor permutation: dynamic
pnml2lts-mc( 0/ 4): Global bits: 0, count bits: 0, local bits: 0
pnml2lts-mc( 0/ 4):
pnml2lts-mc( 0/ 4): Accepting cycle FOUND at depth ~129!
pnml2lts-mc( 0/ 4):
pnml2lts-mc( 0/ 4):
pnml2lts-mc( 0/ 4): total scc count: 0
pnml2lts-mc( 0/ 4): unique states count: 370
pnml2lts-mc( 0/ 4): unique transitions count: 980
pnml2lts-mc( 0/ 4): - self-loop count: 1
pnml2lts-mc( 0/ 4): - claim dead count: 0
pnml2lts-mc( 0/ 4): - claim found count: 0
pnml2lts-mc( 0/ 4): - claim success count: 409
pnml2lts-mc( 0/ 4): - cum. max stack depth: 409
pnml2lts-mc( 0/ 4):
pnml2lts-mc( 0/ 4): Explored 409 states 1097 transitions, fanout: 2.682
pnml2lts-mc( 0/ 4): Total exploration time 0.300 sec (0.290 sec minimum, 0.295 sec on average)
pnml2lts-mc( 0/ 4): States per second: 1363, Transitions per second: 3657
pnml2lts-mc( 0/ 4):
pnml2lts-mc( 0/ 4): Queue width: 12B, total height: 0, memory: 0.00MB
pnml2lts-mc( 0/ 4): Tree memory: 0.1MB, 70.0 B/state, compr.: 2.3%
pnml2lts-mc( 0/ 4): Tree fill ratio (roots/leafs): 0.0%/0.0%
pnml2lts-mc( 0/ 4): Stored 27880 string chucks using 0MB
pnml2lts-mc( 0/ 4): Total memory used for chunk indexing: 1MB
pnml2lts-mc( 0/ 4): Est. total memory use: 1.1MB (~257.0MB paged-in)
ltl formula name BugTracking-PT-q8m128-LTLFireability-04
ltl formula formula --ltl=/tmp/602/ltl_4_
pnml2lts-mc( 0/ 4): Loading model from model.pnml
pnml2lts-mc( 0/ 4): Edge label is id
Warning: program compiled against libxml 210 using older 209
Warning: program compiled against libxml 210 using older 209
Warning: program compiled against libxml 210 using older 209
Warning: program compiled against libxml 210 using older 209
pnml2lts-mc( 0/ 4): Petri net has 754 places, 27370 transitions and 136172 arcs
pnml2lts-mc( 0/ 4): Petri net BugTracking-PT-q8 analyzed
pnml2lts-mc( 0/ 4): There are no safe places
pnml2lts-mc( 0/ 4): Loading Petri net took 3.740 real 1.310 user 1.100 sys
pnml2lts-mc( 2/ 4): LTL layer: formula: /tmp/602/ltl_4_
pnml2lts-mc( 3/ 4): LTL layer: formula: /tmp/602/ltl_4_
pnml2lts-mc( 0/ 4): LTL layer: formula: /tmp/602/ltl_4_
pnml2lts-mc( 1/ 4): LTL layer: formula: /tmp/602/ltl_4_
pnml2lts-mc( 0/ 4): buchi has 3 states
pnml2lts-mc( 0/ 4): Weak Buchi automaton detected, adding non-accepting as progress label.
pnml2lts-mc( 0/ 4): There are 754 state labels and 1 edge labels
pnml2lts-mc( 0/ 4): State length is 755, there are 27373 groups
pnml2lts-mc( 0/ 4): Running ufscc using 4 cores
pnml2lts-mc( 0/ 4): Using a tree table with 2^25 elements
pnml2lts-mc( 0/ 4): Successor permutation: dynamic
pnml2lts-mc( 0/ 4): Global bits: 0, count bits: 0, local bits: 0
pnml2lts-mc( 0/ 4):
pnml2lts-mc( 0/ 4): Accepting cycle FOUND at depth ~129!
pnml2lts-mc( 0/ 4):
pnml2lts-mc( 0/ 4):
pnml2lts-mc( 0/ 4): total scc count: 0
pnml2lts-mc( 0/ 4): unique states count: 354
pnml2lts-mc( 0/ 4): unique transitions count: 970
pnml2lts-mc( 0/ 4): - self-loop count: 1
pnml2lts-mc( 0/ 4): - claim dead count: 0
pnml2lts-mc( 0/ 4): - claim found count: 0
pnml2lts-mc( 0/ 4): - claim success count: 359
pnml2lts-mc( 0/ 4): - cum. max stack depth: 359
pnml2lts-mc( 0/ 4):
pnml2lts-mc( 0/ 4): Explored 359 states 985 transitions, fanout: 2.744
pnml2lts-mc( 0/ 4): Total exploration time 0.280 sec (0.270 sec minimum, 0.278 sec on average)
pnml2lts-mc( 0/ 4): States per second: 1282, Transitions per second: 3518
pnml2lts-mc( 0/ 4):
pnml2lts-mc( 0/ 4): Queue width: 12B, total height: 0, memory: 0.00MB
pnml2lts-mc( 0/ 4): Tree memory: 0.1MB, 65.2 B/state, compr.: 2.2%
pnml2lts-mc( 0/ 4): Tree fill ratio (roots/leafs): 0.0%/0.0%
pnml2lts-mc( 0/ 4): Stored 27880 string chucks using 0MB
pnml2lts-mc( 0/ 4): Total memory used for chunk indexing: 1MB
pnml2lts-mc( 0/ 4): Est. total memory use: 1.1MB (~257.0MB paged-in)
ltl formula name BugTracking-PT-q8m128-LTLFireability-05
ltl formula formula --ltl=/tmp/602/ltl_5_
Warning: program compiled against libxml 210 using older 209
pnml2lts-mc( 0/ 4): Loading model from model.pnml
pnml2lts-mc( 0/ 4): Edge label is id
Warning: program compiled against libxml 210 using older 209
Warning: program compiled against libxml 210 using older 209
Warning: program compiled against libxml 210 using older 209
pnml2lts-mc( 0/ 4): Petri net has 754 places, 27370 transitions and 136172 arcs
pnml2lts-mc( 0/ 4): Petri net BugTracking-PT-q8 analyzed
pnml2lts-mc( 0/ 4): There are no safe places
pnml2lts-mc( 0/ 4): Loading Petri net took 3.610 real 1.300 user 1.120 sys
pnml2lts-mc( 2/ 4): LTL layer: formula: /tmp/602/ltl_5_
pnml2lts-mc( 1/ 4): LTL layer: formula: /tmp/602/ltl_5_
pnml2lts-mc( 3/ 4): LTL layer: formula: /tmp/602/ltl_5_
pnml2lts-mc( 0/ 4): LTL layer: formula: /tmp/602/ltl_5_
pnml2lts-mc( 0/ 4): buchi has 2 states
pnml2lts-mc( 0/ 4): There are 753 state labels and 1 edge labels
pnml2lts-mc( 0/ 4): State length is 755, there are 27376 groups
pnml2lts-mc( 0/ 4): Running ufscc using 4 cores
pnml2lts-mc( 0/ 4): Using a tree table with 2^25 elements
pnml2lts-mc( 0/ 4): Successor permutation: dynamic
pnml2lts-mc( 0/ 4): Global bits: 0, count bits: 0, local bits: 0
pnml2lts-mc( 0/ 4): ~490 levels ~10000 states ~15200 transitions
pnml2lts-mc( 0/ 4): ~986 levels ~20000 states ~27324 transitions
pnml2lts-mc( 0/ 4): ~1667 levels ~40000 states ~50260 transitions
pnml2lts-mc( 0/ 4): ~2590 levels ~80000 states ~94336 transitions
pnml2lts-mc( 0/ 4): ~3869 levels ~160000 states ~180044 transitions
pnml2lts-mc( 0/ 4): ~13638 levels ~320000 states ~418120 transitions
ltl formula name BugTracking-PT-q8m128-LTLFireability-06
ltl formula formula --ltl=/tmp/602/ltl_6_
pnml2lts-mc( 0/ 4): Loading model from model.pnml
pnml2lts-mc( 0/ 4): Edge label is id
Warning: program compiled against libxml 210 using older 209
Warning: program compiled against libxml 210 using older 209
Warning: program compiled against libxml 210 using older 209
Warning: program compiled against libxml 210 using older 209
pnml2lts-mc( 0/ 4): Petri net has 754 places, 27370 transitions and 136172 arcs
pnml2lts-mc( 0/ 4): Petri net BugTracking-PT-q8 analyzed
pnml2lts-mc( 0/ 4): There are no safe places
pnml2lts-mc( 0/ 4): Loading Petri net took 6.230 real 1.410 user 1.580 sys
pnml2lts-mc( 2/ 4): LTL layer: formula: /tmp/602/ltl_6_
pnml2lts-mc( 1/ 4): LTL layer: formula: /tmp/602/ltl_6_
pnml2lts-mc( 3/ 4): LTL layer: formula: /tmp/602/ltl_6_
pnml2lts-mc( 0/ 4): LTL layer: formula: /tmp/602/ltl_6_
pnml2lts-mc( 0/ 4): buchi has 2 states
pnml2lts-mc( 0/ 4): Weak Buchi automaton detected, adding non-accepting as progress label.
pnml2lts-mc( 0/ 4): There are 754 state labels and 1 edge labels
pnml2lts-mc( 0/ 4): State length is 755, there are 27373 groups
pnml2lts-mc( 0/ 4): Running ufscc using 4 cores
pnml2lts-mc( 0/ 4): Using a tree table with 2^25 elements
pnml2lts-mc( 0/ 4): Successor permutation: dynamic
pnml2lts-mc( 0/ 4): Global bits: 0, count bits: 0, local bits: 0
pnml2lts-mc( 1/ 4):
pnml2lts-mc( 1/ 4): Accepting cycle FOUND at depth ~146!
pnml2lts-mc( 1/ 4):
pnml2lts-mc( 0/ 4):
pnml2lts-mc( 0/ 4): total scc count: 0
pnml2lts-mc( 0/ 4): unique states count: 525
pnml2lts-mc( 0/ 4): unique transitions count: 1535
pnml2lts-mc( 0/ 4): - self-loop count: 1
pnml2lts-mc( 0/ 4): - claim dead count: 0
pnml2lts-mc( 0/ 4): - claim found count: 0
pnml2lts-mc( 0/ 4): - claim success count: 530
pnml2lts-mc( 0/ 4): - cum. max stack depth: 530
pnml2lts-mc( 0/ 4):
pnml2lts-mc( 0/ 4): Explored 530 states 1550 transitions, fanout: 2.925
pnml2lts-mc( 0/ 4): Total exploration time 0.500 sec (0.490 sec minimum, 0.498 sec on average)
pnml2lts-mc( 0/ 4): States per second: 1060, Transitions per second: 3100
pnml2lts-mc( 0/ 4):
pnml2lts-mc( 0/ 4): Queue width: 12B, total height: 0, memory: 0.00MB
pnml2lts-mc( 0/ 4): Tree memory: 0.1MB, 52.6 B/state, compr.: 1.7%
pnml2lts-mc( 0/ 4): Tree fill ratio (roots/leafs): 0.0%/0.0%
pnml2lts-mc( 0/ 4): Stored 27880 string chucks using 0MB
pnml2lts-mc( 0/ 4): Total memory used for chunk indexing: 1MB
pnml2lts-mc( 0/ 4): Est. total memory use: 1.1MB (~257.0MB paged-in)
ltl formula name BugTracking-PT-q8m128-LTLFireability-07
ltl formula formula --ltl=/tmp/602/ltl_7_
pnml2lts-mc( 0/ 4): Loading model from model.pnml
pnml2lts-mc( 0/ 4): Edge label is id
Warning: program compiled against libxml 210 using older 209
Warning: program compiled against libxml 210 using older 209
Warning: program compiled against libxml 210 using older 209
Warning: program compiled against libxml 210 using older 209
pnml2lts-mc( 0/ 4): Petri net has 754 places, 27370 transitions and 136172 arcs
pnml2lts-mc( 0/ 4): Petri net BugTracking-PT-q8 analyzed
pnml2lts-mc( 0/ 4): There are no safe places
pnml2lts-mc( 0/ 4): Loading Petri net took 6.030 real 1.220 user 1.230 sys
pnml2lts-mc( 0/ 4): LTL layer: formula: /tmp/602/ltl_7_
pnml2lts-mc( 3/ 4): LTL layer: formula: /tmp/602/ltl_7_
pnml2lts-mc( 2/ 4): LTL layer: formula: /tmp/602/ltl_7_
pnml2lts-mc( 1/ 4): LTL layer: formula: /tmp/602/ltl_7_
pnml2lts-mc( 0/ 4): buchi has 2 states
pnml2lts-mc( 0/ 4): Weak Buchi automaton detected, adding non-accepting as progress label.
pnml2lts-mc( 0/ 4): There are 754 state labels and 1 edge labels
pnml2lts-mc( 0/ 4): State length is 755, there are 27373 groups
pnml2lts-mc( 0/ 4): Running ufscc using 4 cores
pnml2lts-mc( 0/ 4): Using a tree table with 2^25 elements
pnml2lts-mc( 0/ 4): Successor permutation: dynamic
pnml2lts-mc( 0/ 4): Global bits: 0, count bits: 0, local bits: 0
pnml2lts-mc( 1/ 4):
pnml2lts-mc( 1/ 4): Accepting cycle FOUND at depth ~129!
pnml2lts-mc( 1/ 4):
pnml2lts-mc( 0/ 4):
pnml2lts-mc( 0/ 4): total scc count: 0
pnml2lts-mc( 0/ 4): unique states count: 316
pnml2lts-mc( 0/ 4): unique transitions count: 826
pnml2lts-mc( 0/ 4): - self-loop count: 1
pnml2lts-mc( 0/ 4): - claim dead count: 0
pnml2lts-mc( 0/ 4): - claim found count: 0
pnml2lts-mc( 0/ 4): - claim success count: 322
pnml2lts-mc( 0/ 4): - cum. max stack depth: 322
pnml2lts-mc( 0/ 4):
pnml2lts-mc( 0/ 4): Explored 322 states 850 transitions, fanout: 2.640
pnml2lts-mc( 0/ 4): Total exploration time 0.290 sec (0.280 sec minimum, 0.287 sec on average)
pnml2lts-mc( 0/ 4): States per second: 1110, Transitions per second: 2931
pnml2lts-mc( 0/ 4):
pnml2lts-mc( 0/ 4): Queue width: 12B, total height: 0, memory: 0.00MB
pnml2lts-mc( 0/ 4): Tree memory: 0.0MB, 70.0 B/state, compr.: 2.3%
pnml2lts-mc( 0/ 4): Tree fill ratio (roots/leafs): 0.0%/0.0%
pnml2lts-mc( 0/ 4): Stored 27880 string chucks using 0MB
pnml2lts-mc( 0/ 4): Total memory used for chunk indexing: 1MB
pnml2lts-mc( 0/ 4): Est. total memory use: 1.0MB (~257.0MB paged-in)
ltl formula name BugTracking-PT-q8m128-LTLFireability-08
ltl formula formula --ltl=/tmp/602/ltl_8_
pnml2lts-mc( 0/ 4): Loading model from model.pnml
pnml2lts-mc( 0/ 4): Edge label is id
Warning: program compiled against libxml 210 using older 209
Warning: program compiled against libxml 210 using older 209
Warning: program compiled against libxml 210 using older 209
Warning: program compiled against libxml 210 using older 209
pnml2lts-mc( 0/ 4): Petri net has 754 places, 27370 transitions and 136172 arcs
pnml2lts-mc( 0/ 4): Petri net BugTracking-PT-q8 analyzed
pnml2lts-mc( 0/ 4): There are no safe places
pnml2lts-mc( 0/ 4): Loading Petri net took 5.580 real 1.160 user 1.200 sys
pnml2lts-mc( 0/ 4): LTL layer: formula: /tmp/602/ltl_8_
pnml2lts-mc( 3/ 4): LTL layer: formula: /tmp/602/ltl_8_
pnml2lts-mc( 2/ 4): LTL layer: formula: /tmp/602/ltl_8_
pnml2lts-mc( 1/ 4): LTL layer: formula: /tmp/602/ltl_8_
pnml2lts-mc( 0/ 4): buchi has 5 states
pnml2lts-mc( 0/ 4): There are 753 state labels and 1 edge labels
pnml2lts-mc( 0/ 4): State length is 755, there are 27385 groups
pnml2lts-mc( 0/ 4): Running ufscc using 4 cores
pnml2lts-mc( 0/ 4): Using a tree table with 2^25 elements
pnml2lts-mc( 0/ 4): Successor permutation: dynamic
pnml2lts-mc( 0/ 4): Global bits: 0, count bits: 0, local bits: 0
pnml2lts-mc( 0/ 4):
pnml2lts-mc( 0/ 4): Accepting cycle FOUND at depth ~129!
pnml2lts-mc( 0/ 4):
pnml2lts-mc( 0/ 4):
pnml2lts-mc( 0/ 4): total scc count: 0
pnml2lts-mc( 0/ 4): unique states count: 702
pnml2lts-mc( 0/ 4): unique transitions count: 1850
pnml2lts-mc( 0/ 4): - self-loop count: 1
pnml2lts-mc( 0/ 4): - claim dead count: 0
pnml2lts-mc( 0/ 4): - claim found count: 0
pnml2lts-mc( 0/ 4): - claim success count: 711
pnml2lts-mc( 0/ 4): - cum. max stack depth: 711
pnml2lts-mc( 0/ 4):
pnml2lts-mc( 0/ 4): Explored 711 states 1890 transitions, fanout: 2.658
pnml2lts-mc( 0/ 4): Total exploration time 0.690 sec (0.660 sec minimum, 0.678 sec on average)
pnml2lts-mc( 0/ 4): States per second: 1030, Transitions per second: 2739
pnml2lts-mc( 0/ 4):
pnml2lts-mc( 0/ 4): Queue width: 12B, total height: 0, memory: 0.00MB
pnml2lts-mc( 0/ 4): Tree memory: 0.1MB, 64.5 B/state, compr.: 2.1%
pnml2lts-mc( 0/ 4): Tree fill ratio (roots/leafs): 0.0%/0.0%
pnml2lts-mc( 0/ 4): Stored 27880 string chucks using 0MB
pnml2lts-mc( 0/ 4): Total memory used for chunk indexing: 1MB
pnml2lts-mc( 0/ 4): Est. total memory use: 1.1MB (~257.0MB paged-in)
ltl formula name BugTracking-PT-q8m128-LTLFireability-09
ltl formula formula --ltl=/tmp/602/ltl_9_
pnml2lts-mc( 0/ 4): Loading model from model.pnml
pnml2lts-mc( 0/ 4): Edge label is id
Warning: program compiled against libxml 210 using older 209
Warning: program compiled against libxml 210 using older 209
Warning: program compiled against libxml 210 using older 209
Warning: program compiled against libxml 210 using older 209
pnml2lts-mc( 0/ 4): Petri net has 754 places, 27370 transitions and 136172 arcs
pnml2lts-mc( 0/ 4): Petri net BugTracking-PT-q8 analyzed
pnml2lts-mc( 0/ 4): There are no safe places
pnml2lts-mc( 0/ 4): Loading Petri net took 4.080 real 1.000 user 0.720 sys
pnml2lts-mc( 0/ 4): LTL layer: formula: /tmp/602/ltl_9_
pnml2lts-mc( 2/ 4): LTL layer: formula: /tmp/602/ltl_9_
pnml2lts-mc( 3/ 4): LTL layer: formula: /tmp/602/ltl_9_
pnml2lts-mc( 1/ 4): LTL layer: formula: /tmp/602/ltl_9_
pnml2lts-mc( 0/ 4): buchi has 4 states
pnml2lts-mc( 0/ 4): Weak Buchi automaton detected, adding non-accepting as progress label.
pnml2lts-mc( 0/ 4): There are 754 state labels and 1 edge labels
pnml2lts-mc( 0/ 4): State length is 755, there are 27377 groups
pnml2lts-mc( 0/ 4): Running ufscc using 4 cores
pnml2lts-mc( 0/ 4): Using a tree table with 2^25 elements
pnml2lts-mc( 0/ 4): Successor permutation: dynamic
pnml2lts-mc( 0/ 4): Global bits: 0, count bits: 0, local bits: 0
pnml2lts-mc( 0/ 4):
pnml2lts-mc( 0/ 4): Accepting cycle FOUND at depth ~129!
pnml2lts-mc( 0/ 4):
pnml2lts-mc( 0/ 4):
pnml2lts-mc( 0/ 4): total scc count: 0
pnml2lts-mc( 0/ 4): unique states count: 438
pnml2lts-mc( 0/ 4): unique transitions count: 1227
pnml2lts-mc( 0/ 4): - self-loop count: 1
pnml2lts-mc( 0/ 4): - claim dead count: 0
pnml2lts-mc( 0/ 4): - claim found count: 0
pnml2lts-mc( 0/ 4): - claim success count: 443
pnml2lts-mc( 0/ 4): - cum. max stack depth: 443
pnml2lts-mc( 0/ 4):
pnml2lts-mc( 0/ 4): Explored 443 states 1242 transitions, fanout: 2.804
pnml2lts-mc( 0/ 4): Total exploration time 0.620 sec (0.600 sec minimum, 0.608 sec on average)
pnml2lts-mc( 0/ 4): States per second: 715, Transitions per second: 2003
pnml2lts-mc( 0/ 4):
pnml2lts-mc( 0/ 4): Queue width: 12B, total height: 0, memory: 0.00MB
pnml2lts-mc( 0/ 4): Tree memory: 0.1MB, 65.2 B/state, compr.: 2.2%
pnml2lts-mc( 0/ 4): Tree fill ratio (roots/leafs): 0.0%/0.0%
pnml2lts-mc( 0/ 4): Stored 27880 string chucks using 0MB
pnml2lts-mc( 0/ 4): Total memory used for chunk indexing: 1MB
pnml2lts-mc( 0/ 4): Est. total memory use: 1.1MB (~257.0MB paged-in)
ltl formula name BugTracking-PT-q8m128-LTLFireability-10
ltl formula formula --ltl=/tmp/602/ltl_10_
pnml2lts-mc( 0/ 4): Loading model from model.pnml
pnml2lts-mc( 0/ 4): Edge label is id
Warning: program compiled against libxml 210 using older 209
Warning: program compiled against libxml 210 using older 209
Warning: program compiled against libxml 210 using older 209
Warning: program compiled against libxml 210 using older 209
pnml2lts-mc( 0/ 4): Petri net has 754 places, 27370 transitions and 136172 arcs
pnml2lts-mc( 0/ 4): Petri net BugTracking-PT-q8 analyzed
pnml2lts-mc( 0/ 4): There are no safe places
pnml2lts-mc( 0/ 4): Loading Petri net took 5.180 real 1.030 user 0.730 sys
pnml2lts-mc( 3/ 4): LTL layer: formula: /tmp/602/ltl_10_
pnml2lts-mc( 2/ 4): LTL layer: formula: /tmp/602/ltl_10_
pnml2lts-mc( 1/ 4): LTL layer: formula: /tmp/602/ltl_10_
pnml2lts-mc( 0/ 4): LTL layer: formula: /tmp/602/ltl_10_
pnml2lts-mc( 0/ 4): buchi has 4 states
pnml2lts-mc( 0/ 4): Weak Buchi automaton detected, adding non-accepting as progress label.
pnml2lts-mc( 0/ 4): There are 754 state labels and 1 edge labels
pnml2lts-mc( 0/ 4): State length is 755, there are 27375 groups
pnml2lts-mc( 0/ 4): Running ufscc using 4 cores
pnml2lts-mc( 0/ 4): Using a tree table with 2^25 elements
pnml2lts-mc( 0/ 4): Successor permutation: dynamic
pnml2lts-mc( 0/ 4): Global bits: 0, count bits: 0, local bits: 0
pnml2lts-mc( 3/ 4):
pnml2lts-mc( 3/ 4): Accepting cycle FOUND at depth ~129!
pnml2lts-mc( 3/ 4):
pnml2lts-mc( 0/ 4):
pnml2lts-mc( 0/ 4): total scc count: 0
pnml2lts-mc( 0/ 4): unique states count: 479
pnml2lts-mc( 0/ 4): unique transitions count: 1372
pnml2lts-mc( 0/ 4): - self-loop count: 1
pnml2lts-mc( 0/ 4): - claim dead count: 0
pnml2lts-mc( 0/ 4): - claim found count: 0
pnml2lts-mc( 0/ 4): - claim success count: 484
pnml2lts-mc( 0/ 4): - cum. max stack depth: 484
pnml2lts-mc( 0/ 4):
pnml2lts-mc( 0/ 4): Explored 484 states 1387 transitions, fanout: 2.866
pnml2lts-mc( 0/ 4): Total exploration time 0.670 sec (0.660 sec minimum, 0.665 sec on average)
pnml2lts-mc( 0/ 4): States per second: 722, Transitions per second: 2070
pnml2lts-mc( 0/ 4):
pnml2lts-mc( 0/ 4): Queue width: 12B, total height: 0, memory: 0.00MB
pnml2lts-mc( 0/ 4): Tree memory: 0.1MB, 64.6 B/state, compr.: 2.1%
pnml2lts-mc( 0/ 4): Tree fill ratio (roots/leafs): 0.0%/0.0%
pnml2lts-mc( 0/ 4): Stored 27880 string chucks using 0MB
pnml2lts-mc( 0/ 4): Total memory used for chunk indexing: 1MB
pnml2lts-mc( 0/ 4): Est. total memory use: 1.1MB (~257.0MB paged-in)
ltl formula name BugTracking-PT-q8m128-LTLFireability-11
ltl formula formula --ltl=/tmp/602/ltl_11_
pnml2lts-mc( 0/ 4): Loading model from model.pnml
pnml2lts-mc( 0/ 4): Edge label is id
Warning: program compiled against libxml 210 using older 209
Warning: program compiled against libxml 210 using older 209
Warning: program compiled against libxml 210 using older 209
Warning: program compiled against libxml 210 using older 209
pnml2lts-mc( 0/ 4): Petri net has 754 places, 27370 transitions and 136172 arcs
pnml2lts-mc( 0/ 4): Petri net BugTracking-PT-q8 analyzed
pnml2lts-mc( 0/ 4): There are no safe places
pnml2lts-mc( 0/ 4): Loading Petri net took 5.950 real 1.210 user 1.190 sys
pnml2lts-mc( 1/ 4): LTL layer: formula: /tmp/602/ltl_11_
pnml2lts-mc( 2/ 4): LTL layer: formula: /tmp/602/ltl_11_
pnml2lts-mc( 0/ 4): LTL layer: formula: /tmp/602/ltl_11_
pnml2lts-mc( 3/ 4): LTL layer: formula: /tmp/602/ltl_11_
pnml2lts-mc( 0/ 4): buchi has 3 states
pnml2lts-mc( 0/ 4): There are 753 state labels and 1 edge labels
pnml2lts-mc( 0/ 4): State length is 755, there are 27382 groups
pnml2lts-mc( 0/ 4): Running ufscc using 4 cores
pnml2lts-mc( 0/ 4): Using a tree table with 2^25 elements
pnml2lts-mc( 0/ 4): Successor permutation: dynamic
pnml2lts-mc( 0/ 4): Global bits: 0, count bits: 0, local bits: 0
pnml2lts-mc( 1/ 4):
pnml2lts-mc( 1/ 4): Accepting cycle FOUND at depth ~139!
pnml2lts-mc( 1/ 4):
pnml2lts-mc( 0/ 4):
pnml2lts-mc( 0/ 4): total scc count: 0
pnml2lts-mc( 0/ 4): unique states count: 384
pnml2lts-mc( 0/ 4): unique transitions count: 1042
pnml2lts-mc( 0/ 4): - self-loop count: 1
pnml2lts-mc( 0/ 4): - claim dead count: 0
pnml2lts-mc( 0/ 4): - claim found count: 0
pnml2lts-mc( 0/ 4): - claim success count: 440
pnml2lts-mc( 0/ 4): - cum. max stack depth: 440
pnml2lts-mc( 0/ 4):
pnml2lts-mc( 0/ 4): Explored 440 states 1209 transitions, fanout: 2.748
pnml2lts-mc( 0/ 4): Total exploration time 0.390 sec (0.380 sec minimum, 0.387 sec on average)
pnml2lts-mc( 0/ 4): States per second: 1128, Transitions per second: 3100
pnml2lts-mc( 0/ 4):
pnml2lts-mc( 0/ 4): Queue width: 12B, total height: 0, memory: 0.00MB
pnml2lts-mc( 0/ 4): Tree memory: 0.0MB, 63.0 B/state, compr.: 2.1%
pnml2lts-mc( 0/ 4): Tree fill ratio (roots/leafs): 0.0%/0.0%
pnml2lts-mc( 0/ 4): Stored 27880 string chucks using 0MB
pnml2lts-mc( 0/ 4): Total memory used for chunk indexing: 1MB
pnml2lts-mc( 0/ 4): Est. total memory use: 1.0MB (~257.0MB paged-in)
ltl formula name BugTracking-PT-q8m128-LTLFireability-12
ltl formula formula --ltl=/tmp/602/ltl_12_
pnml2lts-mc( 0/ 4): Loading model from model.pnml
pnml2lts-mc( 0/ 4): Edge label is id
Warning: program compiled against libxml 210 using older 209
Warning: program compiled against libxml 210 using older 209
Warning: program compiled against libxml 210 using older 209
Warning: program compiled against libxml 210 using older 209
pnml2lts-mc( 0/ 4): Petri net has 754 places, 27370 transitions and 136172 arcs
pnml2lts-mc( 0/ 4): Petri net BugTracking-PT-q8 analyzed
pnml2lts-mc( 0/ 4): There are no safe places
pnml2lts-mc( 0/ 4): Loading Petri net took 4.640 real 0.960 user 0.760 sys
pnml2lts-mc( 0/ 4): LTL layer: formula: /tmp/602/ltl_12_
pnml2lts-mc( 3/ 4): LTL layer: formula: /tmp/602/ltl_12_
pnml2lts-mc( 1/ 4): LTL layer: formula: /tmp/602/ltl_12_
pnml2lts-mc( 2/ 4): LTL layer: formula: /tmp/602/ltl_12_
pnml2lts-mc( 0/ 4): buchi has 2 states
pnml2lts-mc( 0/ 4): Weak Buchi automaton detected, adding non-accepting as progress label.
pnml2lts-mc( 0/ 4): There are 754 state labels and 1 edge labels
pnml2lts-mc( 0/ 4): State length is 755, there are 27375 groups
pnml2lts-mc( 0/ 4): Running ufscc using 4 cores
pnml2lts-mc( 0/ 4): Using a tree table with 2^25 elements
pnml2lts-mc( 0/ 4): Successor permutation: dynamic
pnml2lts-mc( 0/ 4): Global bits: 0, count bits: 0, local bits: 0
pnml2lts-mc( 0/ 4):
pnml2lts-mc( 0/ 4): Accepting cycle FOUND at depth ~129!
pnml2lts-mc( 0/ 4):
pnml2lts-mc( 0/ 4):
pnml2lts-mc( 0/ 4): total scc count: 0
pnml2lts-mc( 0/ 4): unique states count: 473
pnml2lts-mc( 0/ 4): unique transitions count: 1596
pnml2lts-mc( 0/ 4): - self-loop count: 1
pnml2lts-mc( 0/ 4): - claim dead count: 0
pnml2lts-mc( 0/ 4): - claim found count: 0
pnml2lts-mc( 0/ 4): - claim success count: 476
pnml2lts-mc( 0/ 4): - cum. max stack depth: 476
pnml2lts-mc( 0/ 4):
pnml2lts-mc( 0/ 4): Explored 476 states 1612 transitions, fanout: 3.387
pnml2lts-mc( 0/ 4): Total exploration time 0.520 sec (0.500 sec minimum, 0.510 sec on average)
pnml2lts-mc( 0/ 4): States per second: 915, Transitions per second: 3100
pnml2lts-mc( 0/ 4):
pnml2lts-mc( 0/ 4): Queue width: 12B, total height: 0, memory: 0.00MB
pnml2lts-mc( 0/ 4): Tree memory: 0.1MB, 65.9 B/state, compr.: 2.2%
pnml2lts-mc( 0/ 4): Tree fill ratio (roots/leafs): 0.0%/0.0%
pnml2lts-mc( 0/ 4): Stored 27880 string chucks using 0MB
pnml2lts-mc( 0/ 4): Total memory used for chunk indexing: 1MB
pnml2lts-mc( 0/ 4): Est. total memory use: 1.1MB (~257.0MB paged-in)
ltl formula name BugTracking-PT-q8m128-LTLFireability-13
ltl formula formula --ltl=/tmp/602/ltl_13_
pnml2lts-mc( 0/ 4): Loading model from model.pnml
pnml2lts-mc( 0/ 4): Edge label is id
Warning: program compiled against libxml 210 using older 209
Warning: program compiled against libxml 210 using older 209
Warning: program compiled against libxml 210 using older 209
Warning: program compiled against libxml 210 using older 209
pnml2lts-mc( 0/ 4): Petri net has 754 places, 27370 transitions and 136172 arcs
pnml2lts-mc( 0/ 4): Petri net BugTracking-PT-q8 analyzed
pnml2lts-mc( 0/ 4): There are no safe places
pnml2lts-mc( 0/ 4): Loading Petri net took 5.260 real 1.110 user 1.150 sys
pnml2lts-mc( 0/ 4): LTL layer: formula: /tmp/602/ltl_13_
pnml2lts-mc( 1/ 4): LTL layer: formula: /tmp/602/ltl_13_
pnml2lts-mc( 2/ 4): LTL layer: formula: /tmp/602/ltl_13_
pnml2lts-mc( 3/ 4): LTL layer: formula: /tmp/602/ltl_13_
pnml2lts-mc( 0/ 4): buchi has 6 states
pnml2lts-mc( 0/ 4): Weak Buchi automaton detected, adding non-accepting as progress label.
pnml2lts-mc( 0/ 4): There are 754 state labels and 1 edge labels
pnml2lts-mc( 0/ 4): State length is 755, there are 27391 groups
pnml2lts-mc( 0/ 4): Running ufscc using 4 cores
pnml2lts-mc( 0/ 4): Using a tree table with 2^25 elements
pnml2lts-mc( 0/ 4): Successor permutation: dynamic
pnml2lts-mc( 0/ 4): Global bits: 0, count bits: 0, local bits: 0
pnml2lts-mc( 0/ 4):
pnml2lts-mc( 0/ 4): Accepting cycle FOUND at depth ~129!
pnml2lts-mc( 0/ 4):
pnml2lts-mc( 0/ 4):
pnml2lts-mc( 0/ 4): total scc count: 0
pnml2lts-mc( 0/ 4): unique states count: 367
pnml2lts-mc( 0/ 4): unique transitions count: 1092
pnml2lts-mc( 0/ 4): - self-loop count: 1
pnml2lts-mc( 0/ 4): - claim dead count: 0
pnml2lts-mc( 0/ 4): - claim found count: 0
pnml2lts-mc( 0/ 4): - claim success count: 374
pnml2lts-mc( 0/ 4): - cum. max stack depth: 374
pnml2lts-mc( 0/ 4):
pnml2lts-mc( 0/ 4): Explored 374 states 1113 transitions, fanout: 2.976
pnml2lts-mc( 0/ 4): Total exploration time 0.260 sec (0.240 sec minimum, 0.255 sec on average)
pnml2lts-mc( 0/ 4): States per second: 1438, Transitions per second: 4281
pnml2lts-mc( 0/ 4):
pnml2lts-mc( 0/ 4): Queue width: 12B, total height: 0, memory: 0.00MB
pnml2lts-mc( 0/ 4): Tree memory: 0.0MB, 39.1 B/state, compr.: 1.3%
pnml2lts-mc( 0/ 4): Tree fill ratio (roots/leafs): 0.0%/0.0%
pnml2lts-mc( 0/ 4): Stored 27880 string chucks using 0MB
pnml2lts-mc( 0/ 4): Total memory used for chunk indexing: 1MB
pnml2lts-mc( 0/ 4): Est. total memory use: 1.0MB (~257.0MB paged-in)
ltl formula name BugTracking-PT-q8m128-LTLFireability-14
ltl formula formula --ltl=/tmp/602/ltl_14_
pnml2lts-mc( 0/ 4): Loading model from model.pnml
pnml2lts-mc( 0/ 4): Edge label is id
Warning: program compiled against libxml 210 using older 209
Warning: program compiled against libxml 210 using older 209
Warning: program compiled against libxml 210 using older 209
Warning: program compiled against libxml 210 using older 209
pnml2lts-mc( 0/ 4): Petri net has 754 places, 27370 transitions and 136172 arcs
pnml2lts-mc( 0/ 4): Petri net BugTracking-PT-q8 analyzed
pnml2lts-mc( 0/ 4): There are no safe places
pnml2lts-mc( 0/ 4): Loading Petri net took 5.570 real 1.180 user 1.070 sys
pnml2lts-mc( 3/ 4): LTL layer: formula: /tmp/602/ltl_14_
pnml2lts-mc( 0/ 4): LTL layer: formula: /tmp/602/ltl_14_
pnml2lts-mc( 1/ 4): LTL layer: formula: /tmp/602/ltl_14_
pnml2lts-mc( 2/ 4): LTL layer: formula: /tmp/602/ltl_14_
pnml2lts-mc( 0/ 4): buchi has 5 states
pnml2lts-mc( 0/ 4): Weak Buchi automaton detected, adding non-accepting as progress label.
pnml2lts-mc( 0/ 4): There are 754 state labels and 1 edge labels
pnml2lts-mc( 0/ 4): State length is 755, there are 27375 groups
pnml2lts-mc( 0/ 4): Running ufscc using 4 cores
pnml2lts-mc( 0/ 4): Using a tree table with 2^25 elements
pnml2lts-mc( 0/ 4): Successor permutation: dynamic
pnml2lts-mc( 0/ 4): Global bits: 0, count bits: 0, local bits: 0
pnml2lts-mc( 2/ 4):
pnml2lts-mc( 2/ 4): Accepting cycle FOUND at depth ~129!
pnml2lts-mc( 2/ 4):
pnml2lts-mc( 0/ 4):
pnml2lts-mc( 0/ 4): total scc count: 0
pnml2lts-mc( 0/ 4): unique states count: 335
pnml2lts-mc( 0/ 4): unique transitions count: 948
pnml2lts-mc( 0/ 4): - self-loop count: 1
pnml2lts-mc( 0/ 4): - claim dead count: 0
pnml2lts-mc( 0/ 4): - claim found count: 0
pnml2lts-mc( 0/ 4): - claim success count: 346
pnml2lts-mc( 0/ 4): - cum. max stack depth: 346
pnml2lts-mc( 0/ 4):
pnml2lts-mc( 0/ 4): Explored 346 states 977 transitions, fanout: 2.824
pnml2lts-mc( 0/ 4): Total exploration time 0.280 sec (0.260 sec minimum, 0.275 sec on average)
pnml2lts-mc( 0/ 4): States per second: 1236, Transitions per second: 3489
pnml2lts-mc( 0/ 4):
pnml2lts-mc( 0/ 4): Queue width: 12B, total height: 0, memory: 0.00MB
pnml2lts-mc( 0/ 4): Tree memory: 0.0MB, 57.4 B/state, compr.: 1.9%
pnml2lts-mc( 0/ 4): Tree fill ratio (roots/leafs): 0.0%/0.0%
pnml2lts-mc( 0/ 4): Stored 27880 string chucks using 0MB
pnml2lts-mc( 0/ 4): Total memory used for chunk indexing: 1MB
pnml2lts-mc( 0/ 4): Est. total memory use: 1.0MB (~257.0MB paged-in)
ltl formula name BugTracking-PT-q8m128-LTLFireability-15
ltl formula formula --ltl=/tmp/602/ltl_15_
pnml2lts-mc( 0/ 4): Loading model from model.pnml
pnml2lts-mc( 0/ 4): Edge label is id
Warning: program compiled against libxml 210 using older 209
Warning: program compiled against libxml 210 using older 209
Warning: program compiled against libxml 210 using older 209
Warning: program compiled against libxml 210 using older 209
pnml2lts-mc( 0/ 4): Petri net has 754 places, 27370 transitions and 136172 arcs
pnml2lts-mc( 0/ 4): Petri net BugTracking-PT-q8 analyzed
pnml2lts-mc( 0/ 4): There are no safe places
pnml2lts-mc( 0/ 4): Loading Petri net took 5.780 real 1.400 user 1.410 sys
pnml2lts-mc( 3/ 4): LTL layer: formula: /tmp/602/ltl_15_
pnml2lts-mc( 2/ 4): LTL layer: formula: /tmp/602/ltl_15_
pnml2lts-mc( 1/ 4): LTL layer: formula: /tmp/602/ltl_15_
pnml2lts-mc( 0/ 4): LTL layer: formula: /tmp/602/ltl_15_
pnml2lts-mc( 0/ 4): buchi has 9 states
pnml2lts-mc( 0/ 4): Weak Buchi automaton detected, adding non-accepting as progress label.
pnml2lts-mc( 0/ 4): There are 754 state labels and 1 edge labels
pnml2lts-mc( 0/ 4): State length is 755, there are 27387 groups
pnml2lts-mc( 0/ 4): Running ufscc using 4 cores
pnml2lts-mc( 0/ 4): Using a tree table with 2^25 elements
pnml2lts-mc( 0/ 4): Successor permutation: dynamic
pnml2lts-mc( 0/ 4): Global bits: 0, count bits: 0, local bits: 0
pnml2lts-mc( 2/ 4):
pnml2lts-mc( 2/ 4): Accepting cycle FOUND at depth ~129!
pnml2lts-mc( 2/ 4):
pnml2lts-mc( 0/ 4):
pnml2lts-mc( 0/ 4): total scc count: 0
pnml2lts-mc( 0/ 4): unique states count: 448
pnml2lts-mc( 0/ 4): unique transitions count: 1224
pnml2lts-mc( 0/ 4): - self-loop count: 1
pnml2lts-mc( 0/ 4): - claim dead count: 0
pnml2lts-mc( 0/ 4): - claim found count: 0
pnml2lts-mc( 0/ 4): - claim success count: 453
pnml2lts-mc( 0/ 4): - cum. max stack depth: 453
pnml2lts-mc( 0/ 4):
pnml2lts-mc( 0/ 4): Explored 453 states 1240 transitions, fanout: 2.737
pnml2lts-mc( 0/ 4): Total exploration time 0.390 sec (0.380 sec minimum, 0.387 sec on average)
pnml2lts-mc( 0/ 4): States per second: 1162, Transitions per second: 3179
pnml2lts-mc( 0/ 4):
pnml2lts-mc( 0/ 4): Queue width: 12B, total height: 0, memory: 0.00MB
pnml2lts-mc( 0/ 4): Tree memory: 0.1MB, 60.2 B/state, compr.: 2.0%
pnml2lts-mc( 0/ 4): Tree fill ratio (roots/leafs): 0.0%/0.0%
pnml2lts-mc( 0/ 4): Stored 27880 string chucks using 0MB
pnml2lts-mc( 0/ 4): Total memory used for chunk indexing: 1MB
pnml2lts-mc( 0/ 4): Est. total memory use: 1.1MB (~257.0MB paged-in)
Sequence of Actions to be Executed by the VM
This is useful if one wants to reexecute the tool in the VM from the submitted image disk.
set -x
# this is for BenchKit: configuration of major elements for the test
export BK_INPUT="BugTracking-PT-q8m128"
export BK_EXAMINATION="LTLFireability"
export BK_TOOL="ltsminxred"
export BK_RESULT_DIR="/tmp/BK_RESULTS/OUTPUTS"
export BK_TIME_CONFINEMENT="3600"
export BK_MEMORY_CONFINEMENT="16384"
export BK_BIN_PATH="/home/mcc/BenchKit/bin/"
# this is specific to your benchmark or test
export BIN_DIR="$HOME/BenchKit/bin"
# remove the execution directoty if it exists (to avoid increse of .vmdk images)
if [ -d execution ] ; then
rm -rf execution
fi
# this is for BenchKit: explicit launching of the test
echo "====================================================================="
echo " Generated by BenchKit 2-5568"
echo " Executing tool ltsminxred"
echo " Input is BugTracking-PT-q8m128, examination is LTLFireability"
echo " Time confinement is $BK_TIME_CONFINEMENT seconds"
echo " Memory confinement is 16384 MBytes"
echo " Number of cores is 4"
echo " Run identifier is r472-tajo-171620399500436"
echo "====================================================================="
echo
echo "--------------------"
echo "preparation of the directory to be used:"
tar xzf /home/mcc/BenchKit/INPUTS/BugTracking-PT-q8m128.tgz
mv BugTracking-PT-q8m128 execution
cd execution
if [ "LTLFireability" = "ReachabilityDeadlock" ] || [ "LTLFireability" = "UpperBounds" ] || [ "LTLFireability" = "QuasiLiveness" ] || [ "LTLFireability" = "StableMarking" ] || [ "LTLFireability" = "Liveness" ] || [ "LTLFireability" = "OneSafe" ] || [ "LTLFireability" = "StateSpace" ]; then
rm -f GenericPropertiesVerdict.xml
fi
pwd
ls -lh
echo
echo "--------------------"
echo "content from stdout:"
echo
echo "=== Data for post analysis generated by BenchKit (invocation template)"
echo
if [ "LTLFireability" = "UpperBounds" ] ; then
echo "The expected result is a vector of positive values"
echo NUM_VECTOR
elif [ "LTLFireability" != "StateSpace" ] ; then
echo "The expected result is a vector of booleans"
echo BOOL_VECTOR
else
echo "no data necessary for post analysis"
fi
echo
if [ -f "LTLFireability.txt" ] ; then
echo "here is the order used to build the result vector(from text file)"
for x in $(grep Property LTLFireability.txt | cut -d ' ' -f 2 | sort -u) ; do
echo "FORMULA_NAME $x"
done
elif [ -f "LTLFireability.xml" ] ; then # for cunf (txt files deleted;-)
echo echo "here is the order used to build the result vector(from xml file)"
for x in $(grep '
echo "FORMULA_NAME $x"
done
elif [ "LTLFireability" = "ReachabilityDeadlock" ] || [ "LTLFireability" = "QuasiLiveness" ] || [ "LTLFireability" = "StableMarking" ] || [ "LTLFireability" = "Liveness" ] || [ "LTLFireability" = "OneSafe" ] ; then
echo "FORMULA_NAME LTLFireability"
fi
echo
echo "=== Now, execution of the tool begins"
echo
echo -n "BK_START "
date -u +%s%3N
echo
timeout -s 9 $BK_TIME_CONFINEMENT bash -c "/home/mcc/BenchKit/BenchKit_head.sh 2> STDERR ; echo ; echo -n \"BK_STOP \" ; date -u +%s%3N"
if [ $? -eq 137 ] ; then
echo
echo "BK_TIME_CONFINEMENT_REACHED"
fi
echo
echo "--------------------"
echo "content from stderr:"
echo
cat STDERR ;