

About the Execution of LTSMin+red for BugTracking-PT-q8m128
| Execution Summary | |||||
| Max Memory Used (MB) |
Time wait (ms) | CPU Usage (ms) | I/O Wait (ms) | Computed Result | Execution Status |
| 16184.407 | 1587662.00 | 5757274.00 | 290.80 | TFFFFT?TT?TFFFTF | normal |
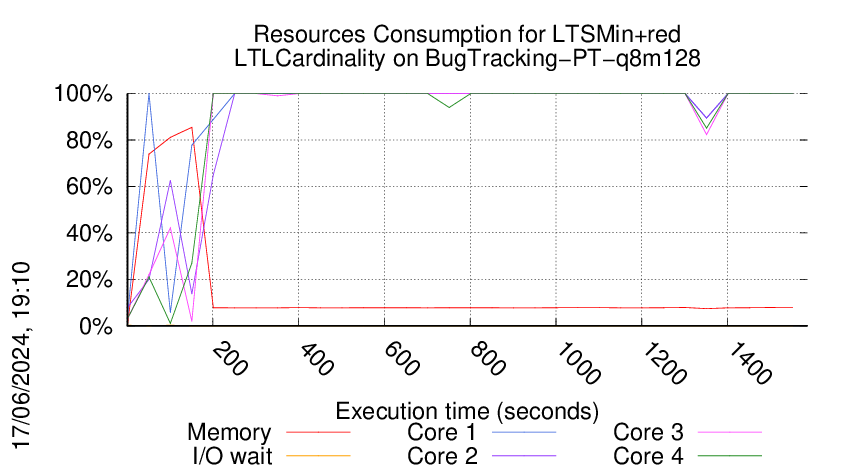
Execution Chart
We display below the execution chart for this examination (boot time has been removed).
Trace from the execution
Formatting '/mnt/tpsp/fkordon/mcc2024-input.r472-tajo-171620399500435.qcow2', fmt=qcow2 size=4294967296 backing_file='/mnt/tpsp/fkordon/mcc2024-input.qcow2' backing_fmt='qcow2' encryption=off cluster_size=65536 lazy_refcounts=off
Waiting for the VM to be ready (probing ssh)
..................................................................................................................................................................................................................................................................................................................................................................................................................................................................................................................................................................................................................................................................................................................................................................................................................................................................................................................................................................................................................................................................................................................................................................................................................................................................................................................................................................................................................................................................................................................................................................................................................................................................................................................................................................................................................................................................................................................................................................................................................................................................................................................................................................................................................................................................................................................................................................................................................................................................................................................................................................................................................................................................................................................................................................................................................................................................................................................................................................................................................................................................................................................................................................................................................................................................................................................................................................................................................................
=====================================================================
Generated by BenchKit 2-5568
Executing tool ltsminxred
Input is BugTracking-PT-q8m128, examination is LTLCardinality
Time confinement is 3600 seconds
Memory confinement is 16384 MBytes
Number of cores is 4
Run identifier is r472-tajo-171620399500435
=====================================================================
--------------------
preparation of the directory to be used:
/home/mcc/execution
total 16M
-rw-r--r-- 1 mcc users 7.7K May 14 13:22 CTLCardinality.txt
-rw-r--r-- 1 mcc users 68K May 14 13:22 CTLCardinality.xml
-rw-r--r-- 1 mcc users 5.7K May 14 13:22 CTLFireability.txt
-rw-r--r-- 1 mcc users 50K May 14 13:22 CTLFireability.xml
-rw-r--r-- 1 mcc users 4.1K May 19 07:06 LTLCardinality.txt
-rw-r--r-- 1 mcc users 24K May 19 15:29 LTLCardinality.xml
-rw-r--r-- 1 mcc users 2.4K Apr 22 14:30 LTLFireability.txt
-rw-r--r-- 1 mcc users 18K Apr 22 14:30 LTLFireability.xml
-rw-r--r-- 1 mcc users 14K Apr 12 01:10 ReachabilityCardinality.txt
-rw-r--r-- 1 mcc users 119K Apr 12 01:10 ReachabilityCardinality.xml
-rw-r--r-- 1 mcc users 9.3K May 14 13:22 ReachabilityFireability.txt
-rw-r--r-- 1 mcc users 78K May 14 13:22 ReachabilityFireability.xml
-rw-r--r-- 1 mcc users 1.7K May 19 07:10 UpperBounds.txt
-rw-r--r-- 1 mcc users 3.9K May 19 15:24 UpperBounds.xml
-rw-r--r-- 1 mcc users 6 May 18 16:42 equiv_col
-rw-r--r-- 1 mcc users 7 May 18 16:42 instance
-rw-r--r-- 1 mcc users 6 May 18 16:42 iscolored
-rw-r--r-- 1 mcc users 16M May 18 16:42 model.pnml
--------------------
content from stdout:
=== Data for post analysis generated by BenchKit (invocation template)
The expected result is a vector of booleans
BOOL_VECTOR
here is the order used to build the result vector(from text file)
FORMULA_NAME BugTracking-PT-q8m128-LTLCardinality-00
FORMULA_NAME BugTracking-PT-q8m128-LTLCardinality-01
FORMULA_NAME BugTracking-PT-q8m128-LTLCardinality-02
FORMULA_NAME BugTracking-PT-q8m128-LTLCardinality-03
FORMULA_NAME BugTracking-PT-q8m128-LTLCardinality-04
FORMULA_NAME BugTracking-PT-q8m128-LTLCardinality-05
FORMULA_NAME BugTracking-PT-q8m128-LTLCardinality-06
FORMULA_NAME BugTracking-PT-q8m128-LTLCardinality-07
FORMULA_NAME BugTracking-PT-q8m128-LTLCardinality-08
FORMULA_NAME BugTracking-PT-q8m128-LTLCardinality-09
FORMULA_NAME BugTracking-PT-q8m128-LTLCardinality-10
FORMULA_NAME BugTracking-PT-q8m128-LTLCardinality-11
FORMULA_NAME BugTracking-PT-q8m128-LTLCardinality-12
FORMULA_NAME BugTracking-PT-q8m128-LTLCardinality-13
FORMULA_NAME BugTracking-PT-q8m128-LTLCardinality-14
FORMULA_NAME BugTracking-PT-q8m128-LTLCardinality-15
=== Now, execution of the tool begins
BK_START 1717224631260
Invoking MCC driver with
BK_TOOL=ltsminxred
BK_EXAMINATION=LTLCardinality
BK_BIN_PATH=/home/mcc/BenchKit/bin/
BK_TIME_CONFINEMENT=3600
BK_INPUT=BugTracking-PT-q8m128
BK_MEMORY_CONFINEMENT=16384
Applying reductions before tool ltsmin
Invoking reducer
Running Version 202405141337
[2024-06-01 06:50:32] [INFO ] Running its-tools with arguments : [-pnfolder, /home/mcc/execution, -examination, LTLCardinality, -timeout, 360, -rebuildPNML]
[2024-06-01 06:50:32] [INFO ] Parsing pnml file : /home/mcc/execution/model.pnml
[2024-06-01 06:50:33] [INFO ] Load time of PNML (sax parser for PT used): 861 ms
[2024-06-01 06:50:33] [INFO ] Transformed 754 places.
[2024-06-01 06:50:33] [INFO ] Transformed 27370 transitions.
[2024-06-01 06:50:33] [INFO ] Parsed PT model containing 754 places and 27370 transitions and 136172 arcs in 1103 ms.
Parsed 16 properties from file /home/mcc/execution/LTLCardinality.xml in 14 ms.
Working with output stream class java.io.PrintStream
Initial state reduction rules removed 2 formulas.
Deduced a syphon composed of 474 places in 115 ms
Reduce places removed 474 places and 23466 transitions.
Initial state reduction rules removed 3 formulas.
FORMULA BugTracking-PT-q8m128-LTLCardinality-00 TRUE TECHNIQUES TOPOLOGICAL INITIAL_STATE
FORMULA BugTracking-PT-q8m128-LTLCardinality-01 FALSE TECHNIQUES TOPOLOGICAL INITIAL_STATE
FORMULA BugTracking-PT-q8m128-LTLCardinality-03 FALSE TECHNIQUES TOPOLOGICAL INITIAL_STATE
FORMULA BugTracking-PT-q8m128-LTLCardinality-05 TRUE TECHNIQUES TOPOLOGICAL INITIAL_STATE
FORMULA BugTracking-PT-q8m128-LTLCardinality-08 TRUE TECHNIQUES TOPOLOGICAL INITIAL_STATE
FORMULA BugTracking-PT-q8m128-LTLCardinality-10 TRUE TECHNIQUES TOPOLOGICAL INITIAL_STATE
FORMULA BugTracking-PT-q8m128-LTLCardinality-11 FALSE TECHNIQUES TOPOLOGICAL INITIAL_STATE
FORMULA BugTracking-PT-q8m128-LTLCardinality-12 FALSE TECHNIQUES TOPOLOGICAL INITIAL_STATE
FORMULA BugTracking-PT-q8m128-LTLCardinality-14 TRUE TECHNIQUES TOPOLOGICAL INITIAL_STATE
FORMULA BugTracking-PT-q8m128-LTLCardinality-15 FALSE TECHNIQUES TOPOLOGICAL INITIAL_STATE
FORMULA BugTracking-PT-q8m128-LTLCardinality-07 TRUE TECHNIQUES TOPOLOGICAL INITIAL_STATE
Support contains 8 out of 280 places. Attempting structural reductions.
Starting structural reductions in LTL mode, iteration 0 : 280/280 places, 3904/3904 transitions.
Reduce places removed 2 places and 0 transitions.
Iterating post reduction 0 with 2 rules applied. Total rules applied 2 place count 278 transition count 3904
Discarding 1 places :
Symmetric choice reduction at 1 with 1 rule applications. Total rules 3 place count 277 transition count 3871
Iterating global reduction 1 with 1 rules applied. Total rules applied 4 place count 277 transition count 3871
Applied a total of 4 rules in 114 ms. Remains 277 /280 variables (removed 3) and now considering 3871/3904 (removed 33) transitions.
[2024-06-01 06:50:34] [INFO ] Flow matrix only has 3707 transitions (discarded 164 similar events)
// Phase 1: matrix 3707 rows 277 cols
[2024-06-01 06:50:34] [INFO ] Computed 8 invariants in 54 ms
[2024-06-01 06:50:34] [INFO ] Implicit Places using invariants in 744 ms returned []
[2024-06-01 06:50:35] [INFO ] Flow matrix only has 3707 transitions (discarded 164 similar events)
[2024-06-01 06:50:35] [INFO ] Invariant cache hit.
[2024-06-01 06:50:35] [INFO ] State equation strengthened by 282 read => feed constraints.
[2024-06-01 06:50:37] [INFO ] Implicit Places using invariants and state equation in 2197 ms returned []
Implicit Place search using SMT with State Equation took 2977 ms to find 0 implicit places.
Running 3869 sub problems to find dead transitions.
[2024-06-01 06:50:37] [INFO ] Flow matrix only has 3707 transitions (discarded 164 similar events)
[2024-06-01 06:50:37] [INFO ] Invariant cache hit.
[2024-06-01 06:50:37] [INFO ] State equation strengthened by 282 read => feed constraints.
At refinement iteration 0 (INCLUDED_ONLY) 0/276 variables, 8/8 constraints. Problems are: Problem set: 0 solved, 3869 unsolved
[2024-06-01 06:51:40] [INFO ] Deduced a trap composed of 10 places in 296 ms of which 22 ms to minimize.
[2024-06-01 06:51:41] [INFO ] Deduced a trap composed of 7 places in 248 ms of which 29 ms to minimize.
[2024-06-01 06:51:41] [INFO ] Deduced a trap composed of 23 places in 128 ms of which 1 ms to minimize.
[2024-06-01 06:51:50] [INFO ] Deduced a trap composed of 11 places in 44 ms of which 1 ms to minimize.
Problem TDEAD784 is UNSAT
Problem TDEAD790 is UNSAT
Problem TDEAD796 is UNSAT
Problem TDEAD802 is UNSAT
Problem TDEAD808 is UNSAT
Problem TDEAD809 is UNSAT
Problem TDEAD810 is UNSAT
Problem TDEAD811 is UNSAT
Problem TDEAD812 is UNSAT
Problem TDEAD813 is UNSAT
Problem TDEAD814 is UNSAT
Problem TDEAD817 is UNSAT
Problem TDEAD818 is UNSAT
Problem TDEAD819 is UNSAT
Solver is answering 'unknown', stopping.
After SMT solving in domain Real declared 276/3984 variables, and 12 constraints, problems are : Problem set: 14 solved, 3855 unsolved in 30085 ms.
Refiners :[Positive P Invariants (semi-flows): 8/8 constraints, State Equation: 0/277 constraints, ReadFeed: 0/282 constraints, PredecessorRefiner: 3869/2672 constraints, Known Traps: 4/4 constraints]
Escalating to Integer solving :Problem set: 14 solved, 3855 unsolved
At refinement iteration 0 (INCLUDED_ONLY) 0/276 variables, 8/8 constraints. Problems are: Problem set: 14 solved, 3855 unsolved
Problem TDEAD2706 is UNSAT
Problem TDEAD2715 is UNSAT
Problem TDEAD2727 is UNSAT
Problem TDEAD2731 is UNSAT
Problem TDEAD2740 is UNSAT
Problem TDEAD2752 is UNSAT
Problem TDEAD2756 is UNSAT
Problem TDEAD2765 is UNSAT
Problem TDEAD2777 is UNSAT
Problem TDEAD2781 is UNSAT
Problem TDEAD2782 is UNSAT
Problem TDEAD2783 is UNSAT
Problem TDEAD2784 is UNSAT
Problem TDEAD2785 is UNSAT
Problem TDEAD2786 is UNSAT
Problem TDEAD2787 is UNSAT
Problem TDEAD2788 is UNSAT
Problem TDEAD2789 is UNSAT
Problem TDEAD2790 is UNSAT
Problem TDEAD2794 is UNSAT
Problem TDEAD2795 is UNSAT
Problem TDEAD2796 is UNSAT
Problem TDEAD2797 is UNSAT
Problem TDEAD2798 is UNSAT
Problem TDEAD2799 is UNSAT
Problem TDEAD2800 is UNSAT
Problem TDEAD2801 is UNSAT
Problem TDEAD2802 is UNSAT
Problem TDEAD2803 is UNSAT
Problem TDEAD2804 is UNSAT
Problem TDEAD2805 is UNSAT
At refinement iteration 1 (INCLUDED_ONLY) 0/276 variables, 4/12 constraints. Problems are: Problem set: 45 solved, 3824 unsolved
Solver is answering 'unknown', stopping.
After SMT solving in domain Int declared 276/3984 variables, and 12 constraints, problems are : Problem set: 45 solved, 3824 unsolved in 30072 ms.
Refiners :[Positive P Invariants (semi-flows): 8/8 constraints, State Equation: 0/277 constraints, ReadFeed: 0/282 constraints, PredecessorRefiner: 1197/2672 constraints, Known Traps: 4/4 constraints]
After SMT, in 106088ms problems are : Problem set: 45 solved, 3824 unsolved
Search for dead transitions found 45 dead transitions in 106164ms
Found 45 dead transitions using SMT.
Drop transitions (Dead Transitions using SMT only with invariants) removed 45 transitions
Dead transitions reduction (with SMT) removed 45 transitions
Starting structural reductions in LTL mode, iteration 1 : 277/280 places, 3826/3904 transitions.
Reduce places removed 11 places and 334 transitions.
Iterating post reduction 0 with 11 rules applied. Total rules applied 11 place count 266 transition count 3492
Reduce places removed 5 places and 152 transitions.
Iterating post reduction 1 with 5 rules applied. Total rules applied 16 place count 261 transition count 3340
Reduce places removed 2 places and 56 transitions.
Iterating post reduction 2 with 2 rules applied. Total rules applied 18 place count 259 transition count 3284
Reduce places removed 1 places and 32 transitions.
Iterating post reduction 3 with 1 rules applied. Total rules applied 19 place count 258 transition count 3252
Discarding 1 places :
Symmetric choice reduction at 4 with 1 rule applications. Total rules 20 place count 257 transition count 3227
Iterating global reduction 4 with 1 rules applied. Total rules applied 21 place count 257 transition count 3227
Applied a total of 21 rules in 184 ms. Remains 257 /277 variables (removed 20) and now considering 3227/3826 (removed 599) transitions.
[2024-06-01 06:52:23] [INFO ] Flow matrix only has 3100 transitions (discarded 127 similar events)
// Phase 1: matrix 3100 rows 257 cols
[2024-06-01 06:52:23] [INFO ] Computed 8 invariants in 24 ms
[2024-06-01 06:52:32] [INFO ] Implicit Places using invariants in 9219 ms returned []
[2024-06-01 06:52:32] [INFO ] Flow matrix only has 3100 transitions (discarded 127 similar events)
[2024-06-01 06:52:32] [INFO ] Invariant cache hit.
[2024-06-01 06:52:33] [INFO ] State equation strengthened by 251 read => feed constraints.
[2024-06-01 06:52:34] [INFO ] Implicit Places using invariants and state equation in 1830 ms returned []
Implicit Place search using SMT with State Equation took 11055 ms to find 0 implicit places.
Starting structural reductions in LTL mode, iteration 2 : 257/280 places, 3227/3904 transitions.
Finished structural reductions in LTL mode , in 2 iterations and 120566 ms. Remains : 257/280 places, 3227/3904 transitions.
Support contains 8 out of 257 places after structural reductions.
[2024-06-01 06:52:35] [INFO ] Flatten gal took : 280 ms
[2024-06-01 06:52:35] [INFO ] Flatten gal took : 150 ms
[2024-06-01 06:52:35] [INFO ] Input system was already deterministic with 3227 transitions.
RANDOM walk for 40000 steps (25 resets) in 1352 ms. (29 steps per ms) remains 4/6 properties
BEST_FIRST walk for 40004 steps (8 resets) in 278 ms. (143 steps per ms) remains 4/4 properties
BEST_FIRST walk for 40003 steps (8 resets) in 202 ms. (197 steps per ms) remains 4/4 properties
BEST_FIRST walk for 40004 steps (8 resets) in 95 ms. (416 steps per ms) remains 4/4 properties
BEST_FIRST walk for 40004 steps (8 resets) in 170 ms. (233 steps per ms) remains 4/4 properties
[2024-06-01 06:52:36] [INFO ] Flow matrix only has 3100 transitions (discarded 127 similar events)
[2024-06-01 06:52:36] [INFO ] Invariant cache hit.
[2024-06-01 06:52:36] [INFO ] State equation strengthened by 251 read => feed constraints.
All remaining problems are real, not stopping.
At refinement iteration 0 (INCLUDED_ONLY) 0/5 variables, 0/0 constraints. Problems are: Problem set: 0 solved, 4 unsolved
Problem AtomicPropp0 is UNSAT
Problem AtomicPropp5 is UNSAT
At refinement iteration 1 (OVERLAPS) 64/69 variables, 3/3 constraints. Problems are: Problem set: 2 solved, 2 unsolved
At refinement iteration 2 (INCLUDED_ONLY) 0/69 variables, 0/3 constraints. Problems are: Problem set: 2 solved, 2 unsolved
At refinement iteration 3 (OVERLAPS) 1519/1588 variables, 69/72 constraints. Problems are: Problem set: 2 solved, 2 unsolved
At refinement iteration 4 (INCLUDED_ONLY) 0/1588 variables, 3/75 constraints. Problems are: Problem set: 2 solved, 2 unsolved
At refinement iteration 5 (INCLUDED_ONLY) 0/1588 variables, 0/75 constraints. Problems are: Problem set: 2 solved, 2 unsolved
At refinement iteration 6 (OVERLAPS) 1169/2757 variables, 106/181 constraints. Problems are: Problem set: 2 solved, 2 unsolved
At refinement iteration 7 (INCLUDED_ONLY) 0/2757 variables, 1/182 constraints. Problems are: Problem set: 2 solved, 2 unsolved
At refinement iteration 8 (INCLUDED_ONLY) 0/2757 variables, 189/371 constraints. Problems are: Problem set: 2 solved, 2 unsolved
At refinement iteration 9 (INCLUDED_ONLY) 0/2757 variables, 0/371 constraints. Problems are: Problem set: 2 solved, 2 unsolved
At refinement iteration 10 (OVERLAPS) 6/2763 variables, 2/373 constraints. Problems are: Problem set: 2 solved, 2 unsolved
At refinement iteration 11 (INCLUDED_ONLY) 0/2763 variables, 1/374 constraints. Problems are: Problem set: 2 solved, 2 unsolved
At refinement iteration 12 (INCLUDED_ONLY) 0/2763 variables, 0/374 constraints. Problems are: Problem set: 2 solved, 2 unsolved
At refinement iteration 13 (OVERLAPS) 545/3308 variables, 54/428 constraints. Problems are: Problem set: 2 solved, 2 unsolved
At refinement iteration 14 (INCLUDED_ONLY) 0/3308 variables, 55/483 constraints. Problems are: Problem set: 2 solved, 2 unsolved
At refinement iteration 15 (INCLUDED_ONLY) 0/3308 variables, 0/483 constraints. Problems are: Problem set: 2 solved, 2 unsolved
At refinement iteration 16 (OVERLAPS) 4/3312 variables, 1/484 constraints. Problems are: Problem set: 2 solved, 2 unsolved
At refinement iteration 17 (INCLUDED_ONLY) 0/3312 variables, 0/484 constraints. Problems are: Problem set: 2 solved, 2 unsolved
At refinement iteration 18 (OVERLAPS) 45/3357 variables, 27/511 constraints. Problems are: Problem set: 2 solved, 2 unsolved
At refinement iteration 19 (INCLUDED_ONLY) 0/3357 variables, 1/512 constraints. Problems are: Problem set: 2 solved, 2 unsolved
At refinement iteration 20 (INCLUDED_ONLY) 0/3357 variables, 4/516 constraints. Problems are: Problem set: 2 solved, 2 unsolved
At refinement iteration 21 (INCLUDED_ONLY) 0/3357 variables, 0/516 constraints. Problems are: Problem set: 2 solved, 2 unsolved
At refinement iteration 22 (OVERLAPS) 0/3357 variables, 0/516 constraints. Problems are: Problem set: 2 solved, 2 unsolved
No progress, stopping.
After SMT solving in domain Real declared 3357/3357 variables, and 516 constraints, problems are : Problem set: 2 solved, 2 unsolved in 1204 ms.
Refiners :[Positive P Invariants (semi-flows): 8/8 constraints, State Equation: 257/257 constraints, ReadFeed: 251/251 constraints, PredecessorRefiner: 4/4 constraints, Known Traps: 0/0 constraints]
Escalating to Integer solving :Problem set: 2 solved, 2 unsolved
At refinement iteration 0 (INCLUDED_ONLY) 0/3 variables, 0/0 constraints. Problems are: Problem set: 2 solved, 2 unsolved
At refinement iteration 1 (OVERLAPS) 23/26 variables, 1/1 constraints. Problems are: Problem set: 2 solved, 2 unsolved
At refinement iteration 2 (INCLUDED_ONLY) 0/26 variables, 0/1 constraints. Problems are: Problem set: 2 solved, 2 unsolved
At refinement iteration 3 (OVERLAPS) 594/620 variables, 26/27 constraints. Problems are: Problem set: 2 solved, 2 unsolved
At refinement iteration 4 (INCLUDED_ONLY) 0/620 variables, 2/29 constraints. Problems are: Problem set: 2 solved, 2 unsolved
At refinement iteration 5 (INCLUDED_ONLY) 0/620 variables, 0/29 constraints. Problems are: Problem set: 2 solved, 2 unsolved
At refinement iteration 6 (OVERLAPS) 2031/2651 variables, 77/106 constraints. Problems are: Problem set: 2 solved, 2 unsolved
At refinement iteration 7 (INCLUDED_ONLY) 0/2651 variables, 2/108 constraints. Problems are: Problem set: 2 solved, 2 unsolved
At refinement iteration 8 (INCLUDED_ONLY) 0/2651 variables, 178/286 constraints. Problems are: Problem set: 2 solved, 2 unsolved
At refinement iteration 9 (INCLUDED_ONLY) 0/2651 variables, 1/287 constraints. Problems are: Problem set: 2 solved, 2 unsolved
At refinement iteration 10 (INCLUDED_ONLY) 0/2651 variables, 0/287 constraints. Problems are: Problem set: 2 solved, 2 unsolved
At refinement iteration 11 (OVERLAPS) 8/2659 variables, 2/289 constraints. Problems are: Problem set: 2 solved, 2 unsolved
At refinement iteration 12 (INCLUDED_ONLY) 0/2659 variables, 1/290 constraints. Problems are: Problem set: 2 solved, 2 unsolved
At refinement iteration 13 (INCLUDED_ONLY) 0/2659 variables, 0/290 constraints. Problems are: Problem set: 2 solved, 2 unsolved
At refinement iteration 14 (OVERLAPS) 623/3282 variables, 121/411 constraints. Problems are: Problem set: 2 solved, 2 unsolved
At refinement iteration 15 (INCLUDED_ONLY) 0/3282 variables, 1/412 constraints. Problems are: Problem set: 2 solved, 2 unsolved
At refinement iteration 16 (INCLUDED_ONLY) 0/3282 variables, 60/472 constraints. Problems are: Problem set: 2 solved, 2 unsolved
At refinement iteration 17 (INCLUDED_ONLY) 0/3282 variables, 1/473 constraints. Problems are: Problem set: 2 solved, 2 unsolved
At refinement iteration 18 (INCLUDED_ONLY) 0/3282 variables, 0/473 constraints. Problems are: Problem set: 2 solved, 2 unsolved
At refinement iteration 19 (OVERLAPS) 73/3355 variables, 30/503 constraints. Problems are: Problem set: 2 solved, 2 unsolved
At refinement iteration 20 (INCLUDED_ONLY) 0/3355 variables, 1/504 constraints. Problems are: Problem set: 2 solved, 2 unsolved
At refinement iteration 21 (INCLUDED_ONLY) 0/3355 variables, 11/515 constraints. Problems are: Problem set: 2 solved, 2 unsolved
At refinement iteration 22 (INCLUDED_ONLY) 0/3355 variables, 0/515 constraints. Problems are: Problem set: 2 solved, 2 unsolved
At refinement iteration 23 (OVERLAPS) 2/3357 variables, 1/516 constraints. Problems are: Problem set: 2 solved, 2 unsolved
At refinement iteration 24 (INCLUDED_ONLY) 0/3357 variables, 2/518 constraints. Problems are: Problem set: 2 solved, 2 unsolved
[2024-06-01 06:52:39] [INFO ] Deduced a trap composed of 40 places in 286 ms of which 2 ms to minimize.
[2024-06-01 06:52:39] [INFO ] Deduced a trap composed of 37 places in 256 ms of which 2 ms to minimize.
[2024-06-01 06:52:39] [INFO ] Deduced a trap composed of 27 places in 183 ms of which 1 ms to minimize.
[2024-06-01 06:52:40] [INFO ] Deduced a trap composed of 23 places in 165 ms of which 2 ms to minimize.
[2024-06-01 06:52:40] [INFO ] Deduced a trap composed of 19 places in 160 ms of which 1 ms to minimize.
[2024-06-01 06:52:40] [INFO ] Deduced a trap composed of 30 places in 204 ms of which 1 ms to minimize.
At refinement iteration 25 (INCLUDED_ONLY) 0/3357 variables, 6/524 constraints. Problems are: Problem set: 2 solved, 2 unsolved
At refinement iteration 26 (INCLUDED_ONLY) 0/3357 variables, 0/524 constraints. Problems are: Problem set: 2 solved, 2 unsolved
At refinement iteration 27 (OVERLAPS) 0/3357 variables, 0/524 constraints. Problems are: Problem set: 2 solved, 2 unsolved
No progress, stopping.
After SMT solving in domain Int declared 3357/3357 variables, and 524 constraints, problems are : Problem set: 2 solved, 2 unsolved in 3089 ms.
Refiners :[Positive P Invariants (semi-flows): 8/8 constraints, State Equation: 257/257 constraints, ReadFeed: 251/251 constraints, PredecessorRefiner: 2/4 constraints, Known Traps: 6/6 constraints]
After SMT, in 4320ms problems are : Problem set: 2 solved, 2 unsolved
Parikh walk visited 0 properties in 5179 ms.
Support contains 3 out of 257 places. Attempting structural reductions.
Starting structural reductions in REACHABILITY mode, iteration 0 : 257/257 places, 3227/3227 transitions.
Performed 2 Post agglomeration using F-continuation condition.Transition count delta: -5
Deduced a syphon composed of 2 places in 2 ms
Reduce places removed 2 places and 0 transitions.
Iterating global reduction 0 with 4 rules applied. Total rules applied 4 place count 255 transition count 3232
Free-agglomeration rule applied 6 times.
Iterating global reduction 0 with 6 rules applied. Total rules applied 10 place count 255 transition count 3226
Reduce places removed 6 places and 0 transitions.
Iterating post reduction 0 with 6 rules applied. Total rules applied 16 place count 249 transition count 3226
Applied a total of 16 rules in 202 ms. Remains 249 /257 variables (removed 8) and now considering 3226/3227 (removed 1) transitions.
Finished structural reductions in REACHABILITY mode , in 1 iterations and 203 ms. Remains : 249/257 places, 3226/3227 transitions.
RANDOM walk for 40380 steps (8 resets) in 53 ms. (747 steps per ms) remains 2/2 properties
BEST_FIRST walk for 40004 steps (8 resets) in 182 ms. (218 steps per ms) remains 2/2 properties
BEST_FIRST walk for 40002 steps (8 resets) in 156 ms. (254 steps per ms) remains 2/2 properties
Interrupted probabilistic random walk after 137075 steps, run timeout after 3001 ms. (steps per millisecond=45 ) properties seen :0 out of 2
Probabilistic random walk after 137075 steps, saw 58783 distinct states, run finished after 3007 ms. (steps per millisecond=45 ) properties seen :0
[2024-06-01 06:52:49] [INFO ] Flow matrix only has 3092 transitions (discarded 134 similar events)
// Phase 1: matrix 3092 rows 249 cols
[2024-06-01 06:52:49] [INFO ] Computed 8 invariants in 13 ms
[2024-06-01 06:52:49] [INFO ] State equation strengthened by 252 read => feed constraints.
All remaining problems are real, not stopping.
At refinement iteration 0 (INCLUDED_ONLY) 0/3 variables, 0/0 constraints. Problems are: Problem set: 0 solved, 2 unsolved
At refinement iteration 1 (OVERLAPS) 23/26 variables, 1/1 constraints. Problems are: Problem set: 0 solved, 2 unsolved
At refinement iteration 2 (INCLUDED_ONLY) 0/26 variables, 0/1 constraints. Problems are: Problem set: 0 solved, 2 unsolved
At refinement iteration 3 (OVERLAPS) 594/620 variables, 26/27 constraints. Problems are: Problem set: 0 solved, 2 unsolved
At refinement iteration 4 (INCLUDED_ONLY) 0/620 variables, 2/29 constraints. Problems are: Problem set: 0 solved, 2 unsolved
At refinement iteration 5 (INCLUDED_ONLY) 0/620 variables, 0/29 constraints. Problems are: Problem set: 0 solved, 2 unsolved
At refinement iteration 6 (OVERLAPS) 2027/2647 variables, 75/104 constraints. Problems are: Problem set: 0 solved, 2 unsolved
At refinement iteration 7 (INCLUDED_ONLY) 0/2647 variables, 2/106 constraints. Problems are: Problem set: 0 solved, 2 unsolved
At refinement iteration 8 (INCLUDED_ONLY) 0/2647 variables, 180/286 constraints. Problems are: Problem set: 0 solved, 2 unsolved
At refinement iteration 9 (INCLUDED_ONLY) 0/2647 variables, 0/286 constraints. Problems are: Problem set: 0 solved, 2 unsolved
At refinement iteration 10 (OVERLAPS) 5/2652 variables, 2/288 constraints. Problems are: Problem set: 0 solved, 2 unsolved
At refinement iteration 11 (INCLUDED_ONLY) 0/2652 variables, 1/289 constraints. Problems are: Problem set: 0 solved, 2 unsolved
At refinement iteration 12 (INCLUDED_ONLY) 0/2652 variables, 0/289 constraints. Problems are: Problem set: 0 solved, 2 unsolved
At refinement iteration 13 (OVERLAPS) 620/3272 variables, 118/407 constraints. Problems are: Problem set: 0 solved, 2 unsolved
At refinement iteration 14 (INCLUDED_ONLY) 0/3272 variables, 1/408 constraints. Problems are: Problem set: 0 solved, 2 unsolved
At refinement iteration 15 (INCLUDED_ONLY) 0/3272 variables, 59/467 constraints. Problems are: Problem set: 0 solved, 2 unsolved
At refinement iteration 16 (INCLUDED_ONLY) 0/3272 variables, 0/467 constraints. Problems are: Problem set: 0 solved, 2 unsolved
At refinement iteration 17 (OVERLAPS) 69/3341 variables, 29/496 constraints. Problems are: Problem set: 0 solved, 2 unsolved
At refinement iteration 18 (INCLUDED_ONLY) 0/3341 variables, 2/498 constraints. Problems are: Problem set: 0 solved, 2 unsolved
At refinement iteration 19 (INCLUDED_ONLY) 0/3341 variables, 11/509 constraints. Problems are: Problem set: 0 solved, 2 unsolved
At refinement iteration 20 (INCLUDED_ONLY) 0/3341 variables, 0/509 constraints. Problems are: Problem set: 0 solved, 2 unsolved
At refinement iteration 21 (OVERLAPS) 0/3341 variables, 0/509 constraints. Problems are: Problem set: 0 solved, 2 unsolved
No progress, stopping.
After SMT solving in domain Real declared 3341/3341 variables, and 509 constraints, problems are : Problem set: 0 solved, 2 unsolved in 1187 ms.
Refiners :[Positive P Invariants (semi-flows): 8/8 constraints, State Equation: 249/249 constraints, ReadFeed: 252/252 constraints, PredecessorRefiner: 2/2 constraints, Known Traps: 0/0 constraints]
Escalating to Integer solving :Problem set: 0 solved, 2 unsolved
At refinement iteration 0 (INCLUDED_ONLY) 0/3 variables, 0/0 constraints. Problems are: Problem set: 0 solved, 2 unsolved
At refinement iteration 1 (OVERLAPS) 23/26 variables, 1/1 constraints. Problems are: Problem set: 0 solved, 2 unsolved
At refinement iteration 2 (INCLUDED_ONLY) 0/26 variables, 0/1 constraints. Problems are: Problem set: 0 solved, 2 unsolved
At refinement iteration 3 (OVERLAPS) 594/620 variables, 26/27 constraints. Problems are: Problem set: 0 solved, 2 unsolved
At refinement iteration 4 (INCLUDED_ONLY) 0/620 variables, 2/29 constraints. Problems are: Problem set: 0 solved, 2 unsolved
At refinement iteration 5 (INCLUDED_ONLY) 0/620 variables, 0/29 constraints. Problems are: Problem set: 0 solved, 2 unsolved
At refinement iteration 6 (OVERLAPS) 2027/2647 variables, 75/104 constraints. Problems are: Problem set: 0 solved, 2 unsolved
At refinement iteration 7 (INCLUDED_ONLY) 0/2647 variables, 2/106 constraints. Problems are: Problem set: 0 solved, 2 unsolved
At refinement iteration 8 (INCLUDED_ONLY) 0/2647 variables, 180/286 constraints. Problems are: Problem set: 0 solved, 2 unsolved
At refinement iteration 9 (INCLUDED_ONLY) 0/2647 variables, 1/287 constraints. Problems are: Problem set: 0 solved, 2 unsolved
At refinement iteration 10 (INCLUDED_ONLY) 0/2647 variables, 0/287 constraints. Problems are: Problem set: 0 solved, 2 unsolved
At refinement iteration 11 (OVERLAPS) 5/2652 variables, 2/289 constraints. Problems are: Problem set: 0 solved, 2 unsolved
At refinement iteration 12 (INCLUDED_ONLY) 0/2652 variables, 1/290 constraints. Problems are: Problem set: 0 solved, 2 unsolved
At refinement iteration 13 (INCLUDED_ONLY) 0/2652 variables, 0/290 constraints. Problems are: Problem set: 0 solved, 2 unsolved
At refinement iteration 14 (OVERLAPS) 620/3272 variables, 118/408 constraints. Problems are: Problem set: 0 solved, 2 unsolved
At refinement iteration 15 (INCLUDED_ONLY) 0/3272 variables, 1/409 constraints. Problems are: Problem set: 0 solved, 2 unsolved
At refinement iteration 16 (INCLUDED_ONLY) 0/3272 variables, 59/468 constraints. Problems are: Problem set: 0 solved, 2 unsolved
At refinement iteration 17 (INCLUDED_ONLY) 0/3272 variables, 1/469 constraints. Problems are: Problem set: 0 solved, 2 unsolved
[2024-06-01 06:52:51] [INFO ] Deduced a trap composed of 18 places in 174 ms of which 1 ms to minimize.
[2024-06-01 06:52:52] [INFO ] Deduced a trap composed of 17 places in 141 ms of which 2 ms to minimize.
At refinement iteration 18 (INCLUDED_ONLY) 0/3272 variables, 2/471 constraints. Problems are: Problem set: 0 solved, 2 unsolved
At refinement iteration 19 (INCLUDED_ONLY) 0/3272 variables, 0/471 constraints. Problems are: Problem set: 0 solved, 2 unsolved
At refinement iteration 20 (OVERLAPS) 69/3341 variables, 29/500 constraints. Problems are: Problem set: 0 solved, 2 unsolved
At refinement iteration 21 (INCLUDED_ONLY) 0/3341 variables, 2/502 constraints. Problems are: Problem set: 0 solved, 2 unsolved
At refinement iteration 22 (INCLUDED_ONLY) 0/3341 variables, 11/513 constraints. Problems are: Problem set: 0 solved, 2 unsolved
[2024-06-01 06:52:52] [INFO ] Deduced a trap composed of 31 places in 348 ms of which 2 ms to minimize.
[2024-06-01 06:52:53] [INFO ] Deduced a trap composed of 8 places in 325 ms of which 9 ms to minimize.
[2024-06-01 06:52:53] [INFO ] Deduced a trap composed of 18 places in 347 ms of which 2 ms to minimize.
[2024-06-01 06:52:54] [INFO ] Deduced a trap composed of 34 places in 399 ms of which 2 ms to minimize.
[2024-06-01 06:52:54] [INFO ] Deduced a trap composed of 34 places in 452 ms of which 2 ms to minimize.
[2024-06-01 06:52:54] [INFO ] Deduced a trap composed of 18 places in 368 ms of which 1 ms to minimize.
[2024-06-01 06:52:55] [INFO ] Deduced a trap composed of 6 places in 137 ms of which 1 ms to minimize.
At refinement iteration 23 (INCLUDED_ONLY) 0/3341 variables, 7/520 constraints. Problems are: Problem set: 0 solved, 2 unsolved
At refinement iteration 24 (INCLUDED_ONLY) 0/3341 variables, 0/520 constraints. Problems are: Problem set: 0 solved, 2 unsolved
At refinement iteration 25 (OVERLAPS) 0/3341 variables, 0/520 constraints. Problems are: Problem set: 0 solved, 2 unsolved
No progress, stopping.
After SMT solving in domain Int declared 3341/3341 variables, and 520 constraints, problems are : Problem set: 0 solved, 2 unsolved in 5103 ms.
Refiners :[Positive P Invariants (semi-flows): 8/8 constraints, State Equation: 249/249 constraints, ReadFeed: 252/252 constraints, PredecessorRefiner: 2/2 constraints, Known Traps: 9/9 constraints]
After SMT, in 6339ms problems are : Problem set: 0 solved, 2 unsolved
Parikh walk visited 0 properties in 3478 ms.
Support contains 3 out of 249 places. Attempting structural reductions.
Starting structural reductions in REACHABILITY mode, iteration 0 : 249/249 places, 3226/3226 transitions.
Applied a total of 0 rules in 45 ms. Remains 249 /249 variables (removed 0) and now considering 3226/3226 (removed 0) transitions.
Finished structural reductions in REACHABILITY mode , in 1 iterations and 45 ms. Remains : 249/249 places, 3226/3226 transitions.
Starting structural reductions in REACHABILITY mode, iteration 0 : 249/249 places, 3226/3226 transitions.
Applied a total of 0 rules in 43 ms. Remains 249 /249 variables (removed 0) and now considering 3226/3226 (removed 0) transitions.
[2024-06-01 06:52:59] [INFO ] Flow matrix only has 3092 transitions (discarded 134 similar events)
[2024-06-01 06:52:59] [INFO ] Invariant cache hit.
[2024-06-01 06:53:00] [INFO ] Implicit Places using invariants in 751 ms returned []
[2024-06-01 06:53:00] [INFO ] Flow matrix only has 3092 transitions (discarded 134 similar events)
[2024-06-01 06:53:00] [INFO ] Invariant cache hit.
[2024-06-01 06:53:00] [INFO ] State equation strengthened by 252 read => feed constraints.
[2024-06-01 06:53:01] [INFO ] Implicit Places using invariants and state equation in 1342 ms returned []
Implicit Place search using SMT with State Equation took 2097 ms to find 0 implicit places.
[2024-06-01 06:53:01] [INFO ] Redundant transitions in 190 ms returned []
Running 3225 sub problems to find dead transitions.
[2024-06-01 06:53:01] [INFO ] Flow matrix only has 3092 transitions (discarded 134 similar events)
[2024-06-01 06:53:01] [INFO ] Invariant cache hit.
[2024-06-01 06:53:01] [INFO ] State equation strengthened by 252 read => feed constraints.
FORMULA BugTracking-PT-q8m128-LTLCardinality-00 TRUE TECHNIQUES EXPLICIT PARALLEL_PROCESSING USE_NUPN
FORMULA BugTracking-PT-q8m128-LTLCardinality-01 FALSE TECHNIQUES EXPLICIT PARALLEL_PROCESSING USE_NUPN
FORMULA BugTracking-PT-q8m128-LTLCardinality-02 FALSE TECHNIQUES EXPLICIT PARALLEL_PROCESSING USE_NUPN
FORMULA BugTracking-PT-q8m128-LTLCardinality-03 FALSE TECHNIQUES EXPLICIT PARALLEL_PROCESSING USE_NUPN
FORMULA BugTracking-PT-q8m128-LTLCardinality-04 FALSE TECHNIQUES EXPLICIT PARALLEL_PROCESSING USE_NUPN
Could not compute solution for formula : BugTracking-PT-q8m128-LTLCardinality-05
Could not compute solution for formula : BugTracking-PT-q8m128-LTLCardinality-06
Could not compute solution for formula : BugTracking-PT-q8m128-LTLCardinality-07
Could not compute solution for formula : BugTracking-PT-q8m128-LTLCardinality-08
Could not compute solution for formula : BugTracking-PT-q8m128-LTLCardinality-09
FORMULA BugTracking-PT-q8m128-LTLCardinality-10 TRUE TECHNIQUES EXPLICIT PARALLEL_PROCESSING USE_NUPN
FORMULA BugTracking-PT-q8m128-LTLCardinality-11 FALSE TECHNIQUES EXPLICIT PARALLEL_PROCESSING USE_NUPN
FORMULA BugTracking-PT-q8m128-LTLCardinality-12 FALSE TECHNIQUES EXPLICIT PARALLEL_PROCESSING USE_NUPN
FORMULA BugTracking-PT-q8m128-LTLCardinality-13 FALSE TECHNIQUES EXPLICIT PARALLEL_PROCESSING USE_NUPN
Could not compute solution for formula : BugTracking-PT-q8m128-LTLCardinality-14
FORMULA BugTracking-PT-q8m128-LTLCardinality-15 FALSE TECHNIQUES EXPLICIT PARALLEL_PROCESSING USE_NUPN
BK_STOP 1717226218922
--------------------
content from stderr:
+ ulimit -s 65536
+ [[ -z '' ]]
+ export LTSMIN_MEM_SIZE=8589934592
+ LTSMIN_MEM_SIZE=8589934592
+ export PYTHONPATH=/home/mcc/BenchKit/itstools/pylibs
+ PYTHONPATH=/home/mcc/BenchKit/itstools/pylibs
+ export LD_LIBRARY_PATH=/home/mcc/BenchKit/itstools/pylibs:
+ LD_LIBRARY_PATH=/home/mcc/BenchKit/itstools/pylibs:
++ sed s/.jar//
++ perl -pe 's/.*\.//g'
++ ls /home/mcc/BenchKit/bin//../reducer/bin//../../itstools//itstools/plugins/fr.lip6.move.gal.application.pnmcc_1.0.0.202405141337.jar
+ VERSION=202405141337
+ echo 'Running Version 202405141337'
+ /home/mcc/BenchKit/bin//../reducer/bin//../../itstools//itstools/its-tools -pnfolder /home/mcc/execution -examination LTLCardinality -timeout 360 -rebuildPNML
mcc2024
ltl formula name BugTracking-PT-q8m128-LTLCardinality-00
ltl formula formula --ltl=/tmp/637/ltl_0_
pnml2lts-mc( 0/ 4): Loading model from model.pnml
pnml2lts-mc( 0/ 4): Edge label is id
Warning: program compiled against libxml 210 using older 209
Warning: program compiled against libxml 210 using older 209
Warning: program compiled against libxml 210 using older 209
Warning: program compiled against libxml 210 using older 209
pnml2lts-mc( 0/ 4): Petri net has 754 places, 27370 transitions and 136172 arcs
pnml2lts-mc( 0/ 4): Petri net BugTracking-PT-q8 analyzed
pnml2lts-mc( 0/ 4): There are no safe places
pnml2lts-mc( 0/ 4): Loading Petri net took 5.590 real 1.150 user 1.200 sys
pnml2lts-mc( 2/ 4): LTL layer: formula: /tmp/637/ltl_0_
pnml2lts-mc( 1/ 4): LTL layer: formula: /tmp/637/ltl_0_
pnml2lts-mc( 3/ 4): LTL layer: formula: /tmp/637/ltl_0_
pnml2lts-mc( 0/ 4): LTL layer: formula: /tmp/637/ltl_0_
pnml2lts-mc( 0/ 4): buchi has 5 states
pnml2lts-mc( 0/ 4): There are 753 state labels and 1 edge labels
pnml2lts-mc( 0/ 4): State length is 755, there are 27378 groups
pnml2lts-mc( 0/ 4): Running ufscc using 4 cores
pnml2lts-mc( 0/ 4): Using a tree table with 2^25 elements
pnml2lts-mc( 0/ 4): Successor permutation: dynamic
pnml2lts-mc( 0/ 4): Global bits: 0, count bits: 0, local bits: 0
pnml2lts-mc( 0/ 4):
pnml2lts-mc( 0/ 4): Empty product with LTL!
pnml2lts-mc( 0/ 4):
pnml2lts-mc( 0/ 4):
pnml2lts-mc( 0/ 4): total scc count: 7
pnml2lts-mc( 0/ 4): unique states count: 7
pnml2lts-mc( 0/ 4): unique transitions count: 7
pnml2lts-mc( 0/ 4): - self-loop count: 0
pnml2lts-mc( 0/ 4): - claim dead count: 1
pnml2lts-mc( 0/ 4): - claim found count: 0
pnml2lts-mc( 0/ 4): - claim success count: 15
pnml2lts-mc( 0/ 4): - cum. max stack depth: 10
pnml2lts-mc( 0/ 4):
pnml2lts-mc( 0/ 4): Explored 15 states 25 transitions, fanout: 1.667
pnml2lts-mc( 0/ 4): Total exploration time 0.010 sec (0.000 sec minimum, 0.007 sec on average)
pnml2lts-mc( 0/ 4): States per second: 1500, Transitions per second: 2500
pnml2lts-mc( 0/ 4):
pnml2lts-mc( 0/ 4): Queue width: 12B, total height: 0, memory: 0.00MB
pnml2lts-mc( 0/ 4): Tree memory: 0.0MB, 105.1 B/state, compr.: 3.5%
pnml2lts-mc( 0/ 4): Tree fill ratio (roots/leafs): 0.0%/0.0%
pnml2lts-mc( 0/ 4): Stored 27880 string chucks using 0MB
pnml2lts-mc( 0/ 4): Total memory used for chunk indexing: 1MB
pnml2lts-mc( 0/ 4): Est. total memory use: 1.0MB (~257.0MB paged-in)
ltl formula name BugTracking-PT-q8m128-LTLCardinality-01
ltl formula formula --ltl=/tmp/637/ltl_1_
pnml2lts-mc( 0/ 4): Loading model from model.pnml
pnml2lts-mc( 0/ 4): Edge label is id
Warning: program compiled against libxml 210 using older 209
Warning: program compiled against libxml 210 using older 209
Warning: program compiled against libxml 210 using older 209
Warning: program compiled against libxml 210 using older 209
pnml2lts-mc( 0/ 4): Petri net has 754 places, 27370 transitions and 136172 arcs
pnml2lts-mc( 0/ 4): Petri net BugTracking-PT-q8 analyzed
pnml2lts-mc( 0/ 4): There are no safe places
pnml2lts-mc( 0/ 4): Loading Petri net took 5.690 real 1.430 user 1.740 sys
pnml2lts-mc( 2/ 4): LTL layer: formula: /tmp/637/ltl_1_
pnml2lts-mc( 0/ 4): LTL layer: formula: /tmp/637/ltl_1_
pnml2lts-mc( 1/ 4): LTL layer: formula: /tmp/637/ltl_1_
pnml2lts-mc( 3/ 4): LTL layer: formula: /tmp/637/ltl_1_
pnml2lts-mc( 0/ 4): buchi has 4 states
pnml2lts-mc( 0/ 4): Weak Buchi automaton detected, adding non-accepting as progress label.
pnml2lts-mc( 0/ 4): There are 754 state labels and 1 edge labels
pnml2lts-mc( 0/ 4): State length is 755, there are 27380 groups
pnml2lts-mc( 0/ 4): Running ufscc using 4 cores
pnml2lts-mc( 0/ 4): Using a tree table with 2^25 elements
pnml2lts-mc( 0/ 4): Successor permutation: dynamic
pnml2lts-mc( 0/ 4): Global bits: 0, count bits: 0, local bits: 0
pnml2lts-mc( 2/ 4):
pnml2lts-mc( 2/ 4): Accepting cycle FOUND at depth ~129!
pnml2lts-mc( 2/ 4):
pnml2lts-mc( 0/ 4):
pnml2lts-mc( 0/ 4): total scc count: 0
pnml2lts-mc( 0/ 4): unique states count: 394
pnml2lts-mc( 0/ 4): unique transitions count: 1115
pnml2lts-mc( 0/ 4): - self-loop count: 1
pnml2lts-mc( 0/ 4): - claim dead count: 0
pnml2lts-mc( 0/ 4): - claim found count: 0
pnml2lts-mc( 0/ 4): - claim success count: 399
pnml2lts-mc( 0/ 4): - cum. max stack depth: 399
pnml2lts-mc( 0/ 4):
pnml2lts-mc( 0/ 4): Explored 399 states 1130 transitions, fanout: 2.832
pnml2lts-mc( 0/ 4): Total exploration time 0.270 sec (0.260 sec minimum, 0.267 sec on average)
pnml2lts-mc( 0/ 4): States per second: 1478, Transitions per second: 4185
pnml2lts-mc( 0/ 4):
pnml2lts-mc( 0/ 4): Queue width: 12B, total height: 0, memory: 0.00MB
pnml2lts-mc( 0/ 4): Tree memory: 0.1MB, 59.8 B/state, compr.: 2.0%
pnml2lts-mc( 0/ 4): Tree fill ratio (roots/leafs): 0.0%/0.0%
pnml2lts-mc( 0/ 4): Stored 27880 string chucks using 0MB
pnml2lts-mc( 0/ 4): Total memory used for chunk indexing: 1MB
pnml2lts-mc( 0/ 4): Est. total memory use: 1.1MB (~257.0MB paged-in)
ltl formula name BugTracking-PT-q8m128-LTLCardinality-02
ltl formula formula --ltl=/tmp/637/ltl_2_
pnml2lts-mc( 0/ 4): Loading model from model.pnml
pnml2lts-mc( 0/ 4): Edge label is id
Warning: program compiled against libxml 210 using older 209
Warning: program compiled against libxml 210 using older 209
Warning: program compiled against libxml 210 using older 209
Warning: program compiled against libxml 210 using older 209
pnml2lts-mc( 0/ 4): Petri net has 754 places, 27370 transitions and 136172 arcs
pnml2lts-mc( 0/ 4): Petri net BugTracking-PT-q8 analyzed
pnml2lts-mc( 0/ 4): There are no safe places
pnml2lts-mc( 0/ 4): Loading Petri net took 5.520 real 1.160 user 1.120 sys
pnml2lts-mc( 0/ 4): LTL layer: formula: /tmp/637/ltl_2_
pnml2lts-mc( 2/ 4): LTL layer: formula: /tmp/637/ltl_2_
pnml2lts-mc( 3/ 4): LTL layer: formula: /tmp/637/ltl_2_
pnml2lts-mc( 1/ 4): LTL layer: formula: /tmp/637/ltl_2_
pnml2lts-mc( 0/ 4): buchi has 9 states
pnml2lts-mc( 0/ 4): There are 753 state labels and 1 edge labels
pnml2lts-mc( 0/ 4): State length is 755, there are 27396 groups
pnml2lts-mc( 0/ 4): Running ufscc using 4 cores
pnml2lts-mc( 0/ 4): Using a tree table with 2^25 elements
pnml2lts-mc( 0/ 4): Successor permutation: dynamic
pnml2lts-mc( 0/ 4): Global bits: 0, count bits: 0, local bits: 0
pnml2lts-mc( 0/ 4):
pnml2lts-mc( 0/ 4): Accepting cycle FOUND at depth ~129!
pnml2lts-mc( 0/ 4):
pnml2lts-mc( 0/ 4):
pnml2lts-mc( 0/ 4): total scc count: 0
pnml2lts-mc( 0/ 4): unique states count: 319
pnml2lts-mc( 0/ 4): unique transitions count: 827
pnml2lts-mc( 0/ 4): - self-loop count: 1
pnml2lts-mc( 0/ 4): - claim dead count: 0
pnml2lts-mc( 0/ 4): - claim found count: 0
pnml2lts-mc( 0/ 4): - claim success count: 325
pnml2lts-mc( 0/ 4): - cum. max stack depth: 325
pnml2lts-mc( 0/ 4):
pnml2lts-mc( 0/ 4): Explored 325 states 844 transitions, fanout: 2.597
pnml2lts-mc( 0/ 4): Total exploration time 0.250 sec (0.240 sec minimum, 0.245 sec on average)
pnml2lts-mc( 0/ 4): States per second: 1300, Transitions per second: 3376
pnml2lts-mc( 0/ 4):
pnml2lts-mc( 0/ 4): Queue width: 12B, total height: 0, memory: 0.00MB
pnml2lts-mc( 0/ 4): Tree memory: 0.0MB, 70.1 B/state, compr.: 2.3%
pnml2lts-mc( 0/ 4): Tree fill ratio (roots/leafs): 0.0%/0.0%
pnml2lts-mc( 0/ 4): Stored 27880 string chucks using 0MB
pnml2lts-mc( 0/ 4): Total memory used for chunk indexing: 1MB
pnml2lts-mc( 0/ 4): Est. total memory use: 1.0MB (~257.0MB paged-in)
ltl formula name BugTracking-PT-q8m128-LTLCardinality-03
ltl formula formula --ltl=/tmp/637/ltl_3_
pnml2lts-mc( 0/ 4): Loading model from model.pnml
pnml2lts-mc( 0/ 4): Edge label is id
Warning: program compiled against libxml 210 using older 209
Warning: program compiled against libxml 210 using older 209
Warning: program compiled against libxml 210 using older 209
Warning: program compiled against libxml 210 using older 209
pnml2lts-mc( 0/ 4): Petri net has 754 places, 27370 transitions and 136172 arcs
pnml2lts-mc( 0/ 4): Petri net BugTracking-PT-q8 analyzed
pnml2lts-mc( 0/ 4): There are no safe places
pnml2lts-mc( 0/ 4): Loading Petri net took 5.330 real 1.470 user 1.600 sys
pnml2lts-mc( 2/ 4): LTL layer: formula: /tmp/637/ltl_3_
pnml2lts-mc( 0/ 4): LTL layer: formula: /tmp/637/ltl_3_
pnml2lts-mc( 1/ 4): LTL layer: formula: /tmp/637/ltl_3_
pnml2lts-mc( 3/ 4): LTL layer: formula: /tmp/637/ltl_3_
pnml2lts-mc( 0/ 4): buchi has 17 states
pnml2lts-mc( 0/ 4): There are 753 state labels and 1 edge labels
pnml2lts-mc( 0/ 4): State length is 755, there are 27437 groups
pnml2lts-mc( 0/ 4): Running ufscc using 4 cores
pnml2lts-mc( 0/ 4): Using a tree table with 2^25 elements
pnml2lts-mc( 0/ 4): Successor permutation: dynamic
pnml2lts-mc( 0/ 4): Global bits: 0, count bits: 0, local bits: 0
pnml2lts-mc( 3/ 4):
pnml2lts-mc( 3/ 4): Accepting cycle FOUND at depth ~129!
pnml2lts-mc( 3/ 4):
pnml2lts-mc( 0/ 4):
pnml2lts-mc( 0/ 4): total scc count: 0
pnml2lts-mc( 0/ 4): unique states count: 793
pnml2lts-mc( 0/ 4): unique transitions count: 2614
pnml2lts-mc( 0/ 4): - self-loop count: 1
pnml2lts-mc( 0/ 4): - claim dead count: 0
pnml2lts-mc( 0/ 4): - claim found count: 0
pnml2lts-mc( 0/ 4): - claim success count: 798
pnml2lts-mc( 0/ 4): - cum. max stack depth: 798
pnml2lts-mc( 0/ 4):
pnml2lts-mc( 0/ 4): Explored 798 states 2629 transitions, fanout: 3.294
pnml2lts-mc( 0/ 4): Total exploration time 0.650 sec (0.630 sec minimum, 0.642 sec on average)
pnml2lts-mc( 0/ 4): States per second: 1228, Transitions per second: 4045
pnml2lts-mc( 0/ 4):
pnml2lts-mc( 0/ 4): Queue width: 12B, total height: 0, memory: 0.00MB
pnml2lts-mc( 0/ 4): Tree memory: 0.1MB, 32.1 B/state, compr.: 1.1%
pnml2lts-mc( 0/ 4): Tree fill ratio (roots/leafs): 0.0%/0.0%
pnml2lts-mc( 0/ 4): Stored 27880 string chucks using 0MB
pnml2lts-mc( 0/ 4): Total memory used for chunk indexing: 1MB
pnml2lts-mc( 0/ 4): Est. total memory use: 1.1MB (~257.0MB paged-in)
ltl formula name BugTracking-PT-q8m128-LTLCardinality-04
ltl formula formula --ltl=/tmp/637/ltl_4_
pnml2lts-mc( 0/ 4): Loading model from model.pnml
pnml2lts-mc( 0/ 4): Edge label is id
Warning: program compiled against libxml 210 using older 209
Warning: program compiled against libxml 210 using older 209
Warning: program compiled against libxml 210 using older 209
Warning: program compiled against libxml 210 using older 209
pnml2lts-mc( 0/ 4): Petri net has 754 places, 27370 transitions and 136172 arcs
pnml2lts-mc( 0/ 4): Petri net BugTracking-PT-q8 analyzed
pnml2lts-mc( 0/ 4): There are no safe places
pnml2lts-mc( 0/ 4): Loading Petri net took 5.510 real 1.200 user 1.270 sys
pnml2lts-mc( 0/ 4): LTL layer: formula: /tmp/637/ltl_4_
pnml2lts-mc( 2/ 4): LTL layer: formula: /tmp/637/ltl_4_
pnml2lts-mc( 1/ 4): LTL layer: formula: /tmp/637/ltl_4_
pnml2lts-mc( 3/ 4): LTL layer: formula: /tmp/637/ltl_4_
pnml2lts-mc( 0/ 4): buchi has 3 states
pnml2lts-mc( 0/ 4): Weak Buchi automaton detected, adding non-accepting as progress label.
pnml2lts-mc( 0/ 4): There are 754 state labels and 1 edge labels
pnml2lts-mc( 0/ 4): State length is 755, there are 27374 groups
pnml2lts-mc( 0/ 4): Running ufscc using 4 cores
pnml2lts-mc( 0/ 4): Using a tree table with 2^25 elements
pnml2lts-mc( 0/ 4): Successor permutation: dynamic
pnml2lts-mc( 0/ 4): Global bits: 0, count bits: 0, local bits: 0
pnml2lts-mc( 2/ 4):
pnml2lts-mc( 2/ 4): Accepting cycle FOUND at depth ~152!
pnml2lts-mc( 2/ 4):
pnml2lts-mc( 0/ 4):
pnml2lts-mc( 0/ 4): total scc count: 4
pnml2lts-mc( 0/ 4): unique states count: 606
pnml2lts-mc( 0/ 4): unique transitions count: 1652
pnml2lts-mc( 0/ 4): - self-loop count: 1
pnml2lts-mc( 0/ 4): - claim dead count: 0
pnml2lts-mc( 0/ 4): - claim found count: 0
pnml2lts-mc( 0/ 4): - claim success count: 611
pnml2lts-mc( 0/ 4): - cum. max stack depth: 607
pnml2lts-mc( 0/ 4):
pnml2lts-mc( 0/ 4): Explored 611 states 1667 transitions, fanout: 2.728
pnml2lts-mc( 0/ 4): Total exploration time 0.520 sec (0.500 sec minimum, 0.507 sec on average)
pnml2lts-mc( 0/ 4): States per second: 1175, Transitions per second: 3206
pnml2lts-mc( 0/ 4):
pnml2lts-mc( 0/ 4): Queue width: 12B, total height: 0, memory: 0.00MB
pnml2lts-mc( 0/ 4): Tree memory: 0.1MB, 66.0 B/state, compr.: 2.2%
pnml2lts-mc( 0/ 4): Tree fill ratio (roots/leafs): 0.0%/0.0%
pnml2lts-mc( 0/ 4): Stored 27880 string chucks using 0MB
pnml2lts-mc( 0/ 4): Total memory used for chunk indexing: 1MB
pnml2lts-mc( 0/ 4): Est. total memory use: 1.1MB (~257.0MB paged-in)
ltl formula name BugTracking-PT-q8m128-LTLCardinality-05
ltl formula formula --ltl=/tmp/637/ltl_5_
pnml2lts-mc( 0/ 4): Loading model from model.pnml
pnml2lts-mc( 0/ 4): Edge label is id
Warning: program compiled against libxml 210 using older 209
Warning: program compiled against libxml 210 using older 209
Warning: program compiled against libxml 210 using older 209
Warning: program compiled against libxml 210 using older 209
pnml2lts-mc( 0/ 4): Petri net has 754 places, 27370 transitions and 136172 arcs
pnml2lts-mc( 0/ 4): Petri net BugTracking-PT-q8 analyzed
pnml2lts-mc( 0/ 4): There are no safe places
pnml2lts-mc( 0/ 4): Loading Petri net took 4.400 real 1.060 user 0.880 sys
pnml2lts-mc( 1/ 4): LTL layer: formula: /tmp/637/ltl_5_
pnml2lts-mc( 3/ 4): LTL layer: formula: /tmp/637/ltl_5_
pnml2lts-mc( 2/ 4): LTL layer: formula: /tmp/637/ltl_5_
pnml2lts-mc( 0/ 4): LTL layer: formula: /tmp/637/ltl_5_
pnml2lts-mc( 0/ 4): buchi has 2 states
pnml2lts-mc( 0/ 4): Weak Buchi automaton detected, adding non-accepting as progress label.
pnml2lts-mc( 0/ 4): There are 754 state labels and 1 edge labels
pnml2lts-mc( 0/ 4): State length is 755, there are 27373 groups
pnml2lts-mc( 0/ 4): Running ufscc using 4 cores
pnml2lts-mc( 0/ 4): Using a tree table with 2^25 elements
pnml2lts-mc( 0/ 4): Successor permutation: dynamic
pnml2lts-mc( 0/ 4): Global bits: 0, count bits: 0, local bits: 0
pnml2lts-mc( 2/ 4): ~2055 levels ~10000 states ~21064 transitions
pnml2lts-mc( 2/ 4): ~4199 levels ~20000 states ~42812 transitions
pnml2lts-mc( 2/ 4): ~8497 levels ~40000 states ~86328 transitions
pnml2lts-mc( 2/ 4): ~17071 levels ~80000 states ~173200 transitions
pnml2lts-mc( 2/ 4): ~34235 levels ~160000 states ~347128 transitions
ltl formula name BugTracking-PT-q8m128-LTLCardinality-06
ltl formula formula --ltl=/tmp/637/ltl_6_
pnml2lts-mc( 0/ 4): Loading model from model.pnml
pnml2lts-mc( 0/ 4): Edge label is id
Warning: program compiled against libxml 210 using older 209
Warning: program compiled against libxml 210 using older 209
Warning: program compiled against libxml 210 using older 209
Warning: program compiled against libxml 210 using older 209
pnml2lts-mc( 0/ 4): Petri net has 754 places, 27370 transitions and 136172 arcs
pnml2lts-mc( 0/ 4): Petri net BugTracking-PT-q8 analyzed
pnml2lts-mc( 0/ 4): There are no safe places
pnml2lts-mc( 0/ 4): Loading Petri net took 4.080 real 1.020 user 0.820 sys
pnml2lts-mc( 1/ 4): LTL layer: formula: /tmp/637/ltl_6_
pnml2lts-mc( 2/ 4): LTL layer: formula: /tmp/637/ltl_6_
pnml2lts-mc( 3/ 4): LTL layer: formula: /tmp/637/ltl_6_
pnml2lts-mc( 0/ 4): LTL layer: formula: /tmp/637/ltl_6_
pnml2lts-mc( 0/ 4): buchi has 4 states
pnml2lts-mc( 0/ 4): There are 753 state labels and 1 edge labels
pnml2lts-mc( 0/ 4): State length is 755, there are 27378 groups
pnml2lts-mc( 0/ 4): Running ufscc using 4 cores
pnml2lts-mc( 0/ 4): Using a tree table with 2^25 elements
pnml2lts-mc( 0/ 4): Successor permutation: dynamic
pnml2lts-mc( 0/ 4): Global bits: 0, count bits: 0, local bits: 0
pnml2lts-mc( 1/ 4): ~2500 levels ~10000 states ~29988 transitions
pnml2lts-mc( 1/ 4): ~5000 levels ~20000 states ~59984 transitions
pnml2lts-mc( 1/ 4): ~10000 levels ~40000 states ~119988 transitions
pnml2lts-mc( 1/ 4): ~20000 levels ~80000 states ~239984 transitions
pnml2lts-mc( 3/ 4): ~40000 levels ~160000 states ~480000 transitions
ltl formula name BugTracking-PT-q8m128-LTLCardinality-07
ltl formula formula --ltl=/tmp/637/ltl_7_
pnml2lts-mc( 0/ 4): Loading model from model.pnml
pnml2lts-mc( 0/ 4): Edge label is id
Warning: program compiled against libxml 210 using older 209
Warning: program compiled against libxml 210 using older 209
Warning: program compiled against libxml 210 using older 209
Warning: program compiled against libxml 210 using older 209
pnml2lts-mc( 0/ 4): Petri net has 754 places, 27370 transitions and 136172 arcs
pnml2lts-mc( 0/ 4): Petri net BugTracking-PT-q8 analyzed
pnml2lts-mc( 0/ 4): There are no safe places
pnml2lts-mc( 0/ 4): Loading Petri net took 4.370 real 1.010 user 0.800 sys
pnml2lts-mc( 0/ 4): LTL layer: formula: /tmp/637/ltl_7_
pnml2lts-mc( 3/ 4): LTL layer: formula: /tmp/637/ltl_7_
pnml2lts-mc( 1/ 4): LTL layer: formula: /tmp/637/ltl_7_
pnml2lts-mc( 2/ 4): LTL layer: formula: /tmp/637/ltl_7_
pnml2lts-mc( 0/ 4): buchi has 2 states
pnml2lts-mc( 0/ 4): Weak Buchi automaton detected, adding non-accepting as progress label.
pnml2lts-mc( 0/ 4): There are 754 state labels and 1 edge labels
pnml2lts-mc( 0/ 4): State length is 755, there are 27373 groups
pnml2lts-mc( 0/ 4): Running ufscc using 4 cores
pnml2lts-mc( 0/ 4): Using a tree table with 2^25 elements
pnml2lts-mc( 0/ 4): Successor permutation: dynamic
pnml2lts-mc( 0/ 4): Global bits: 0, count bits: 0, local bits: 0
pnml2lts-mc( 1/ 4): ~240 levels ~10000 states ~17152 transitions
pnml2lts-mc( 1/ 4): ~281 levels ~20000 states ~34504 transitions
pnml2lts-mc( 1/ 4): ~404 levels ~40000 states ~68876 transitions
pnml2lts-mc( 1/ 4): ~650 levels ~80000 states ~137620 transitions
pnml2lts-mc( 1/ 4): ~1142 levels ~160000 states ~274932 transitions
ltl formula name BugTracking-PT-q8m128-LTLCardinality-08
ltl formula formula --ltl=/tmp/637/ltl_8_
pnml2lts-mc( 0/ 4): Loading model from model.pnml
pnml2lts-mc( 0/ 4): Edge label is id
Warning: program compiled against libxml 210 using older 209
Warning: program compiled against libxml 210 using older 209
Warning: program compiled against libxml 210 using older 209
Warning: program compiled against libxml 210 using older 209
pnml2lts-mc( 0/ 4): Petri net has 754 places, 27370 transitions and 136172 arcs
pnml2lts-mc( 0/ 4): Petri net BugTracking-PT-q8 analyzed
pnml2lts-mc( 0/ 4): There are no safe places
pnml2lts-mc( 0/ 4): Loading Petri net took 4.150 real 0.990 user 0.870 sys
pnml2lts-mc( 0/ 4): LTL layer: formula: /tmp/637/ltl_8_
pnml2lts-mc( 3/ 4): LTL layer: formula: /tmp/637/ltl_8_
pnml2lts-mc( 2/ 4): LTL layer: formula: /tmp/637/ltl_8_
pnml2lts-mc( 1/ 4): LTL layer: formula: /tmp/637/ltl_8_
pnml2lts-mc( 0/ 4): buchi has 2 states
pnml2lts-mc( 0/ 4): There are 753 state labels and 1 edge labels
pnml2lts-mc( 0/ 4): State length is 755, there are 27374 groups
pnml2lts-mc( 0/ 4): Running ufscc using 4 cores
pnml2lts-mc( 0/ 4): Using a tree table with 2^25 elements
pnml2lts-mc( 0/ 4): Successor permutation: dynamic
pnml2lts-mc( 0/ 4): Global bits: 0, count bits: 0, local bits: 0
pnml2lts-mc( 2/ 4): ~1914 levels ~10000 states ~16204 transitions
pnml2lts-mc( 2/ 4): ~3914 levels ~20000 states ~32204 transitions
pnml2lts-mc( 2/ 4): ~7914 levels ~40000 states ~64204 transitions
pnml2lts-mc( 1/ 4): ~15423 levels ~80000 states ~143896 transitions
pnml2lts-mc( 2/ 4): ~31914 levels ~160000 states ~256204 transitions
ltl formula name BugTracking-PT-q8m128-LTLCardinality-09
ltl formula formula --ltl=/tmp/637/ltl_9_
Warning: program compiled against libxml 210 using older 209
Warning: program compiled against libxml 210 using older 209
Warning: program compiled against libxml 210 using older 209
pnml2lts-mc( 0/ 4): Loading model from model.pnml
pnml2lts-mc( 0/ 4): Edge label is id
Warning: program compiled against libxml 210 using older 209
pnml2lts-mc( 0/ 4): Petri net has 754 places, 27370 transitions and 136172 arcs
pnml2lts-mc( 0/ 4): Petri net BugTracking-PT-q8 analyzed
pnml2lts-mc( 0/ 4): There are no safe places
pnml2lts-mc( 0/ 4): Loading Petri net took 5.590 real 1.220 user 1.230 sys
pnml2lts-mc( 2/ 4): LTL layer: formula: /tmp/637/ltl_9_
pnml2lts-mc( 3/ 4): LTL layer: formula: /tmp/637/ltl_9_
pnml2lts-mc( 1/ 4): LTL layer: formula: /tmp/637/ltl_9_
pnml2lts-mc( 0/ 4): LTL layer: formula: /tmp/637/ltl_9_
pnml2lts-mc( 0/ 4): buchi has 2 states
pnml2lts-mc( 0/ 4): There are 753 state labels and 1 edge labels
pnml2lts-mc( 0/ 4): State length is 755, there are 27374 groups
pnml2lts-mc( 0/ 4): Running ufscc using 4 cores
pnml2lts-mc( 0/ 4): Using a tree table with 2^25 elements
pnml2lts-mc( 0/ 4): Successor permutation: dynamic
pnml2lts-mc( 0/ 4): Global bits: 0, count bits: 0, local bits: 0
pnml2lts-mc( 1/ 4): ~2491 levels ~10000 states ~30828 transitions
pnml2lts-mc( 1/ 4): ~4979 levels ~20000 states ~62692 transitions
pnml2lts-mc( 0/ 4): ~10000 levels ~40000 states ~165968 transitions
pnml2lts-mc( 0/ 4): ~20000 levels ~80000 states ~332632 transitions
pnml2lts-mc( 0/ 4): ~40000 levels ~160000 states ~665968 transitions
pnml2lts-mc( 0/ 4): ~80000 levels ~320000 states ~1332632 transitions
ltl formula name BugTracking-PT-q8m128-LTLCardinality-10
ltl formula formula --ltl=/tmp/637/ltl_10_
pnml2lts-mc( 0/ 4): Loading model from model.pnml
pnml2lts-mc( 0/ 4): Edge label is id
Warning: program compiled against libxml 210 using older 209
Warning: program compiled against libxml 210 using older 209
Warning: program compiled against libxml 210 using older 209
Warning: program compiled against libxml 210 using older 209
pnml2lts-mc( 0/ 4): Petri net has 754 places, 27370 transitions and 136172 arcs
pnml2lts-mc( 0/ 4): Petri net BugTracking-PT-q8 analyzed
pnml2lts-mc( 0/ 4): There are no safe places
pnml2lts-mc( 0/ 4): Loading Petri net took 3.600 real 1.310 user 1.150 sys
pnml2lts-mc( 1/ 4): LTL layer: formula: /tmp/637/ltl_10_
pnml2lts-mc( 2/ 4): LTL layer: formula: /tmp/637/ltl_10_
pnml2lts-mc( 3/ 4): LTL layer: formula: /tmp/637/ltl_10_
pnml2lts-mc( 0/ 4): LTL layer: formula: /tmp/637/ltl_10_
pnml2lts-mc( 0/ 4): buchi has 3 states
pnml2lts-mc( 0/ 4): Weak Buchi automaton detected, adding non-accepting as progress label.
pnml2lts-mc( 0/ 4): There are 754 state labels and 1 edge labels
pnml2lts-mc( 0/ 4): State length is 755, there are 27374 groups
pnml2lts-mc( 0/ 4): Running ufscc using 4 cores
pnml2lts-mc( 0/ 4): Using a tree table with 2^25 elements
pnml2lts-mc( 0/ 4): Successor permutation: dynamic
pnml2lts-mc( 0/ 4): Global bits: 0, count bits: 0, local bits: 0
pnml2lts-mc( 0/ 4):
pnml2lts-mc( 0/ 4): Empty product with LTL!
pnml2lts-mc( 0/ 4):
pnml2lts-mc( 0/ 4):
pnml2lts-mc( 0/ 4): total scc count: 1
pnml2lts-mc( 0/ 4): unique states count: 1
pnml2lts-mc( 0/ 4): unique transitions count: 0
pnml2lts-mc( 0/ 4): - self-loop count: 0
pnml2lts-mc( 0/ 4): - claim dead count: 0
pnml2lts-mc( 0/ 4): - claim found count: 0
pnml2lts-mc( 0/ 4): - claim success count: 4
pnml2lts-mc( 0/ 4): - cum. max stack depth: 4
pnml2lts-mc( 0/ 4):
pnml2lts-mc( 0/ 4): Explored 4 states 4 transitions, fanout: 1.000
pnml2lts-mc( 0/ 4): Total exploration time 0.000 sec (0.000 sec minimum, 0.000 sec on average)
pnml2lts-mc( 0/ 4): States per second: inf, Transitions per second: inf
pnml2lts-mc( 0/ 4):
pnml2lts-mc( 0/ 4): Queue width: 12B, total height: 0, memory: 0.00MB
pnml2lts-mc( 0/ 4): Tree memory: 0.0MB, 288.0 B/state, compr.: 9.5%
pnml2lts-mc( 0/ 4): Tree fill ratio (roots/leafs): 0.0%/0.0%
pnml2lts-mc( 0/ 4): Stored 27880 string chucks using 0MB
pnml2lts-mc( 0/ 4): Total memory used for chunk indexing: 1MB
pnml2lts-mc( 0/ 4): Est. total memory use: 1.0MB (~257.0MB paged-in)
ltl formula name BugTracking-PT-q8m128-LTLCardinality-11
ltl formula formula --ltl=/tmp/637/ltl_11_
pnml2lts-mc( 0/ 4): Loading model from model.pnml
pnml2lts-mc( 0/ 4): Edge label is id
Warning: program compiled against libxml 210 using older 209
Warning: program compiled against libxml 210 using older 209
Warning: program compiled against libxml 210 using older 209
Warning: program compiled against libxml 210 using older 209
pnml2lts-mc( 0/ 4): Petri net has 754 places, 27370 transitions and 136172 arcs
pnml2lts-mc( 0/ 4): Petri net BugTracking-PT-q8 analyzed
pnml2lts-mc( 0/ 4): There are no safe places
pnml2lts-mc( 0/ 4): Loading Petri net took 3.570 real 1.140 user 1.180 sys
pnml2lts-mc( 3/ 4): LTL layer: formula: /tmp/637/ltl_11_
pnml2lts-mc( 0/ 4): LTL layer: formula: /tmp/637/ltl_11_
pnml2lts-mc( 2/ 4): LTL layer: formula: /tmp/637/ltl_11_
pnml2lts-mc( 1/ 4): LTL layer: formula: /tmp/637/ltl_11_
pnml2lts-mc( 0/ 4): buchi has 6 states
pnml2lts-mc( 0/ 4): Weak Buchi automaton detected, adding non-accepting as progress label.
pnml2lts-mc( 0/ 4): There are 754 state labels and 1 edge labels
pnml2lts-mc( 0/ 4): State length is 755, there are 27381 groups
pnml2lts-mc( 0/ 4): Running ufscc using 4 cores
pnml2lts-mc( 0/ 4): Using a tree table with 2^25 elements
pnml2lts-mc( 0/ 4): Successor permutation: dynamic
pnml2lts-mc( 0/ 4): Global bits: 0, count bits: 0, local bits: 0
pnml2lts-mc( 0/ 4):
pnml2lts-mc( 0/ 4): Accepting cycle FOUND at depth ~129!
pnml2lts-mc( 0/ 4):
pnml2lts-mc( 0/ 4):
pnml2lts-mc( 0/ 4): total scc count: 0
pnml2lts-mc( 0/ 4): unique states count: 438
pnml2lts-mc( 0/ 4): unique transitions count: 1239
pnml2lts-mc( 0/ 4): - self-loop count: 1
pnml2lts-mc( 0/ 4): - claim dead count: 0
pnml2lts-mc( 0/ 4): - claim found count: 0
pnml2lts-mc( 0/ 4): - claim success count: 443
pnml2lts-mc( 0/ 4): - cum. max stack depth: 443
pnml2lts-mc( 0/ 4):
pnml2lts-mc( 0/ 4): Explored 443 states 1254 transitions, fanout: 2.831
pnml2lts-mc( 0/ 4): Total exploration time 0.360 sec (0.360 sec minimum, 0.360 sec on average)
pnml2lts-mc( 0/ 4): States per second: 1231, Transitions per second: 3483
pnml2lts-mc( 0/ 4):
pnml2lts-mc( 0/ 4): Queue width: 12B, total height: 0, memory: 0.00MB
pnml2lts-mc( 0/ 4): Tree memory: 0.1MB, 64.4 B/state, compr.: 2.1%
pnml2lts-mc( 0/ 4): Tree fill ratio (roots/leafs): 0.0%/0.0%
pnml2lts-mc( 0/ 4): Stored 27880 string chucks using 0MB
pnml2lts-mc( 0/ 4): Total memory used for chunk indexing: 1MB
pnml2lts-mc( 0/ 4): Est. total memory use: 1.1MB (~257.0MB paged-in)
ltl formula name BugTracking-PT-q8m128-LTLCardinality-12
ltl formula formula --ltl=/tmp/637/ltl_12_
Warning: program compiled against libxml 210 using older 209
Warning: program compiled against libxml 210 using older 209
Warning: program compiled against libxml 210 using older 209
pnml2lts-mc( 0/ 4): Loading model from model.pnml
pnml2lts-mc( 0/ 4): Edge label is id
Warning: program compiled against libxml 210 using older 209
pnml2lts-mc( 0/ 4): Petri net has 754 places, 27370 transitions and 136172 arcs
pnml2lts-mc( 0/ 4): Petri net BugTracking-PT-q8 analyzed
pnml2lts-mc( 0/ 4): There are no safe places
pnml2lts-mc( 0/ 4): Loading Petri net took 3.550 real 1.310 user 1.140 sys
pnml2lts-mc( 2/ 4): LTL layer: formula: /tmp/637/ltl_12_
pnml2lts-mc( 3/ 4): LTL layer: formula: /tmp/637/ltl_12_
pnml2lts-mc( 0/ 4): LTL layer: formula: /tmp/637/ltl_12_
pnml2lts-mc( 1/ 4): LTL layer: formula: /tmp/637/ltl_12_
pnml2lts-mc( 0/ 4): buchi has 1 states
pnml2lts-mc( 0/ 4): Weak Buchi automaton detected, adding non-accepting as progress label.
pnml2lts-mc( 0/ 4): There are 754 state labels and 1 edge labels
pnml2lts-mc( 0/ 4): State length is 755, there are 27372 groups
pnml2lts-mc( 0/ 4): Running ufscc using 4 cores
pnml2lts-mc( 0/ 4): Using a tree table with 2^25 elements
pnml2lts-mc( 0/ 4): Successor permutation: dynamic
pnml2lts-mc( 0/ 4): Global bits: 0, count bits: 0, local bits: 0
pnml2lts-mc( 0/ 4):
pnml2lts-mc( 0/ 4): Accepting cycle FOUND at depth ~129!
pnml2lts-mc( 0/ 4):
pnml2lts-mc( 0/ 4):
pnml2lts-mc( 0/ 4): total scc count: 0
pnml2lts-mc( 0/ 4): unique states count: 332
pnml2lts-mc( 0/ 4): unique transitions count: 866
pnml2lts-mc( 0/ 4): - self-loop count: 1
pnml2lts-mc( 0/ 4): - claim dead count: 0
pnml2lts-mc( 0/ 4): - claim found count: 0
pnml2lts-mc( 0/ 4): - claim success count: 421
pnml2lts-mc( 0/ 4): - cum. max stack depth: 421
pnml2lts-mc( 0/ 4):
pnml2lts-mc( 0/ 4): Explored 421 states 1132 transitions, fanout: 2.689
pnml2lts-mc( 0/ 4): Total exploration time 0.270 sec (0.270 sec minimum, 0.270 sec on average)
pnml2lts-mc( 0/ 4): States per second: 1559, Transitions per second: 4193
pnml2lts-mc( 0/ 4):
pnml2lts-mc( 0/ 4): Queue width: 12B, total height: 0, memory: 0.00MB
pnml2lts-mc( 0/ 4): Tree memory: 0.1MB, 70.2 B/state, compr.: 2.3%
pnml2lts-mc( 0/ 4): Tree fill ratio (roots/leafs): 0.0%/0.0%
pnml2lts-mc( 0/ 4): Stored 27880 string chucks using 0MB
pnml2lts-mc( 0/ 4): Total memory used for chunk indexing: 1MB
pnml2lts-mc( 0/ 4): Est. total memory use: 1.1MB (~257.0MB paged-in)
ltl formula name BugTracking-PT-q8m128-LTLCardinality-13
ltl formula formula --ltl=/tmp/637/ltl_13_
pnml2lts-mc( 0/ 4): Loading model from model.pnml
pnml2lts-mc( 0/ 4): Edge label is id
Warning: program compiled against libxml 210 using older 209
Warning: program compiled against libxml 210 using older 209
Warning: program compiled against libxml 210 using older 209
Warning: program compiled against libxml 210 using older 209
pnml2lts-mc( 0/ 4): Petri net has 754 places, 27370 transitions and 136172 arcs
pnml2lts-mc( 0/ 4): Petri net BugTracking-PT-q8 analyzed
pnml2lts-mc( 0/ 4): There are no safe places
pnml2lts-mc( 0/ 4): Loading Petri net took 3.660 real 1.280 user 0.960 sys
pnml2lts-mc( 2/ 4): LTL layer: formula: /tmp/637/ltl_13_
pnml2lts-mc( 0/ 4): LTL layer: formula: /tmp/637/ltl_13_
pnml2lts-mc( 3/ 4): LTL layer: formula: /tmp/637/ltl_13_
pnml2lts-mc( 1/ 4): LTL layer: formula: /tmp/637/ltl_13_
pnml2lts-mc( 0/ 4): buchi has 3 states
pnml2lts-mc( 0/ 4): Weak Buchi automaton detected, adding non-accepting as progress label.
pnml2lts-mc( 0/ 4): There are 754 state labels and 1 edge labels
pnml2lts-mc( 0/ 4): State length is 755, there are 27374 groups
pnml2lts-mc( 0/ 4): Running ufscc using 4 cores
pnml2lts-mc( 0/ 4): Using a tree table with 2^25 elements
pnml2lts-mc( 0/ 4): Successor permutation: dynamic
pnml2lts-mc( 0/ 4): Global bits: 0, count bits: 0, local bits: 0
pnml2lts-mc( 3/ 4):
pnml2lts-mc( 3/ 4): Accepting cycle FOUND at depth ~129!
pnml2lts-mc( 3/ 4):
pnml2lts-mc( 0/ 4):
pnml2lts-mc( 0/ 4): total scc count: 0
pnml2lts-mc( 0/ 4): unique states count: 430
pnml2lts-mc( 0/ 4): unique transitions count: 1160
pnml2lts-mc( 0/ 4): - self-loop count: 1
pnml2lts-mc( 0/ 4): - claim dead count: 0
pnml2lts-mc( 0/ 4): - claim found count: 0
pnml2lts-mc( 0/ 4): - claim success count: 436
pnml2lts-mc( 0/ 4): - cum. max stack depth: 436
pnml2lts-mc( 0/ 4):
pnml2lts-mc( 0/ 4): Explored 436 states 1177 transitions, fanout: 2.700
pnml2lts-mc( 0/ 4): Total exploration time 0.290 sec (0.290 sec minimum, 0.290 sec on average)
pnml2lts-mc( 0/ 4): States per second: 1503, Transitions per second: 4059
pnml2lts-mc( 0/ 4):
pnml2lts-mc( 0/ 4): Queue width: 12B, total height: 0, memory: 0.00MB
pnml2lts-mc( 0/ 4): Tree memory: 0.1MB, 69.8 B/state, compr.: 2.3%
pnml2lts-mc( 0/ 4): Tree fill ratio (roots/leafs): 0.0%/0.0%
pnml2lts-mc( 0/ 4): Stored 27880 string chucks using 0MB
pnml2lts-mc( 0/ 4): Total memory used for chunk indexing: 1MB
pnml2lts-mc( 0/ 4): Est. total memory use: 1.1MB (~257.0MB paged-in)
ltl formula name BugTracking-PT-q8m128-LTLCardinality-14
ltl formula formula --ltl=/tmp/637/ltl_14_
pnml2lts-mc( 0/ 4): Loading model from model.pnml
pnml2lts-mc( 0/ 4): Edge label is id
Warning: program compiled against libxml 210 using older 209
Warning: program compiled against libxml 210 using older 209
Warning: program compiled against libxml 210 using older 209
Warning: program compiled against libxml 210 using older 209
pnml2lts-mc( 0/ 4): Petri net has 754 places, 27370 transitions and 136172 arcs
pnml2lts-mc( 0/ 4): Petri net BugTracking-PT-q8 analyzed
pnml2lts-mc( 0/ 4): There are no safe places
pnml2lts-mc( 0/ 4): Loading Petri net took 3.790 real 1.300 user 1.190 sys
pnml2lts-mc( 3/ 4): LTL layer: formula: /tmp/637/ltl_14_
pnml2lts-mc( 2/ 4): LTL layer: formula: /tmp/637/ltl_14_
pnml2lts-mc( 1/ 4): LTL layer: formula: /tmp/637/ltl_14_
pnml2lts-mc( 0/ 4): LTL layer: formula: /tmp/637/ltl_14_
pnml2lts-mc( 0/ 4): buchi has 3 states
pnml2lts-mc( 0/ 4): Weak Buchi automaton detected, adding non-accepting as progress label.
pnml2lts-mc( 0/ 4): There are 754 state labels and 1 edge labels
pnml2lts-mc( 0/ 4): State length is 755, there are 27376 groups
pnml2lts-mc( 0/ 4): Running ufscc using 4 cores
pnml2lts-mc( 0/ 4): Using a tree table with 2^25 elements
pnml2lts-mc( 0/ 4): Successor permutation: dynamic
pnml2lts-mc( 0/ 4): Global bits: 0, count bits: 0, local bits: 0
pnml2lts-mc( 0/ 4): ~2495 levels ~10000 states ~25212 transitions
pnml2lts-mc( 1/ 4): ~5000 levels ~20000 states ~60000 transitions
pnml2lts-mc( 1/ 4): ~10000 levels ~40000 states ~120004 transitions
pnml2lts-mc( 1/ 4): ~20000 levels ~80000 states ~240000 transitions
pnml2lts-mc( 1/ 4): ~40000 levels ~160000 states ~480004 transitions
pnml2lts-mc( 1/ 4): ~80000 levels ~320000 states ~960000 transitions
ltl formula name BugTracking-PT-q8m128-LTLCardinality-15
ltl formula formula --ltl=/tmp/637/ltl_15_
pnml2lts-mc( 0/ 4): Loading model from model.pnml
pnml2lts-mc( 0/ 4): Edge label is id
Warning: program compiled against libxml 210 using older 209
Warning: program compiled against libxml 210 using older 209
Warning: program compiled against libxml 210 using older 209
Warning: program compiled against libxml 210 using older 209
pnml2lts-mc( 0/ 4): Petri net has 754 places, 27370 transitions and 136172 arcs
pnml2lts-mc( 0/ 4): Petri net BugTracking-PT-q8 analyzed
pnml2lts-mc( 0/ 4): There are no safe places
pnml2lts-mc( 0/ 4): Loading Petri net took 3.490 real 1.320 user 1.100 sys
pnml2lts-mc( 3/ 4): LTL layer: formula: /tmp/637/ltl_15_
pnml2lts-mc( 1/ 4): LTL layer: formula: /tmp/637/ltl_15_
pnml2lts-mc( 2/ 4): LTL layer: formula: /tmp/637/ltl_15_
pnml2lts-mc( 0/ 4): LTL layer: formula: /tmp/637/ltl_15_
pnml2lts-mc( 0/ 4): buchi has 2 states
pnml2lts-mc( 0/ 4): Weak Buchi automaton detected, adding non-accepting as progress label.
pnml2lts-mc( 0/ 4): There are 754 state labels and 1 edge labels
pnml2lts-mc( 0/ 4): State length is 755, there are 27373 groups
pnml2lts-mc( 0/ 4): Running ufscc using 4 cores
pnml2lts-mc( 0/ 4): Using a tree table with 2^25 elements
pnml2lts-mc( 0/ 4): Successor permutation: dynamic
pnml2lts-mc( 0/ 4): Global bits: 0, count bits: 0, local bits: 0
pnml2lts-mc( 2/ 4):
pnml2lts-mc( 2/ 4): Accepting cycle FOUND at depth ~129!
pnml2lts-mc( 2/ 4):
pnml2lts-mc( 0/ 4):
pnml2lts-mc( 0/ 4): total scc count: 0
pnml2lts-mc( 0/ 4): unique states count: 583
pnml2lts-mc( 0/ 4): unique transitions count: 1814
pnml2lts-mc( 0/ 4): - self-loop count: 1
pnml2lts-mc( 0/ 4): - claim dead count: 0
pnml2lts-mc( 0/ 4): - claim found count: 0
pnml2lts-mc( 0/ 4): - claim success count: 589
pnml2lts-mc( 0/ 4): - cum. max stack depth: 589
pnml2lts-mc( 0/ 4):
pnml2lts-mc( 0/ 4): Explored 589 states 1833 transitions, fanout: 3.112
pnml2lts-mc( 0/ 4): Total exploration time 0.370 sec (0.370 sec minimum, 0.370 sec on average)
pnml2lts-mc( 0/ 4): States per second: 1592, Transitions per second: 4954
pnml2lts-mc( 0/ 4):
pnml2lts-mc( 0/ 4): Queue width: 12B, total height: 0, memory: 0.00MB
pnml2lts-mc( 0/ 4): Tree memory: 0.1MB, 49.8 B/state, compr.: 1.6%
pnml2lts-mc( 0/ 4): Tree fill ratio (roots/leafs): 0.0%/0.0%
pnml2lts-mc( 0/ 4): Stored 27880 string chucks using 0MB
pnml2lts-mc( 0/ 4): Total memory used for chunk indexing: 1MB
pnml2lts-mc( 0/ 4): Est. total memory use: 1.1MB (~257.0MB paged-in)
Sequence of Actions to be Executed by the VM
This is useful if one wants to reexecute the tool in the VM from the submitted image disk.
set -x
# this is for BenchKit: configuration of major elements for the test
export BK_INPUT="BugTracking-PT-q8m128"
export BK_EXAMINATION="LTLCardinality"
export BK_TOOL="ltsminxred"
export BK_RESULT_DIR="/tmp/BK_RESULTS/OUTPUTS"
export BK_TIME_CONFINEMENT="3600"
export BK_MEMORY_CONFINEMENT="16384"
export BK_BIN_PATH="/home/mcc/BenchKit/bin/"
# this is specific to your benchmark or test
export BIN_DIR="$HOME/BenchKit/bin"
# remove the execution directoty if it exists (to avoid increse of .vmdk images)
if [ -d execution ] ; then
rm -rf execution
fi
# this is for BenchKit: explicit launching of the test
echo "====================================================================="
echo " Generated by BenchKit 2-5568"
echo " Executing tool ltsminxred"
echo " Input is BugTracking-PT-q8m128, examination is LTLCardinality"
echo " Time confinement is $BK_TIME_CONFINEMENT seconds"
echo " Memory confinement is 16384 MBytes"
echo " Number of cores is 4"
echo " Run identifier is r472-tajo-171620399500435"
echo "====================================================================="
echo
echo "--------------------"
echo "preparation of the directory to be used:"
tar xzf /home/mcc/BenchKit/INPUTS/BugTracking-PT-q8m128.tgz
mv BugTracking-PT-q8m128 execution
cd execution
if [ "LTLCardinality" = "ReachabilityDeadlock" ] || [ "LTLCardinality" = "UpperBounds" ] || [ "LTLCardinality" = "QuasiLiveness" ] || [ "LTLCardinality" = "StableMarking" ] || [ "LTLCardinality" = "Liveness" ] || [ "LTLCardinality" = "OneSafe" ] || [ "LTLCardinality" = "StateSpace" ]; then
rm -f GenericPropertiesVerdict.xml
fi
pwd
ls -lh
echo
echo "--------------------"
echo "content from stdout:"
echo
echo "=== Data for post analysis generated by BenchKit (invocation template)"
echo
if [ "LTLCardinality" = "UpperBounds" ] ; then
echo "The expected result is a vector of positive values"
echo NUM_VECTOR
elif [ "LTLCardinality" != "StateSpace" ] ; then
echo "The expected result is a vector of booleans"
echo BOOL_VECTOR
else
echo "no data necessary for post analysis"
fi
echo
if [ -f "LTLCardinality.txt" ] ; then
echo "here is the order used to build the result vector(from text file)"
for x in $(grep Property LTLCardinality.txt | cut -d ' ' -f 2 | sort -u) ; do
echo "FORMULA_NAME $x"
done
elif [ -f "LTLCardinality.xml" ] ; then # for cunf (txt files deleted;-)
echo echo "here is the order used to build the result vector(from xml file)"
for x in $(grep '
echo "FORMULA_NAME $x"
done
elif [ "LTLCardinality" = "ReachabilityDeadlock" ] || [ "LTLCardinality" = "QuasiLiveness" ] || [ "LTLCardinality" = "StableMarking" ] || [ "LTLCardinality" = "Liveness" ] || [ "LTLCardinality" = "OneSafe" ] ; then
echo "FORMULA_NAME LTLCardinality"
fi
echo
echo "=== Now, execution of the tool begins"
echo
echo -n "BK_START "
date -u +%s%3N
echo
timeout -s 9 $BK_TIME_CONFINEMENT bash -c "/home/mcc/BenchKit/BenchKit_head.sh 2> STDERR ; echo ; echo -n \"BK_STOP \" ; date -u +%s%3N"
if [ $? -eq 137 ] ; then
echo
echo "BK_TIME_CONFINEMENT_REACHED"
fi
echo
echo "--------------------"
echo "content from stderr:"
echo
cat STDERR ;