

About the Execution of Tapaal for PolyORBNT-COL-S10J80
| Execution Summary | |||||
| Max Memory Used (MB) |
Time wait (ms) | CPU Usage (ms) | I/O Wait (ms) | Computed Result | Execution Status |
| 8115.575 | 3592658.00 | 6367844.00 | 372.40 | FTF?TFTFFF?TFFT? | normal |
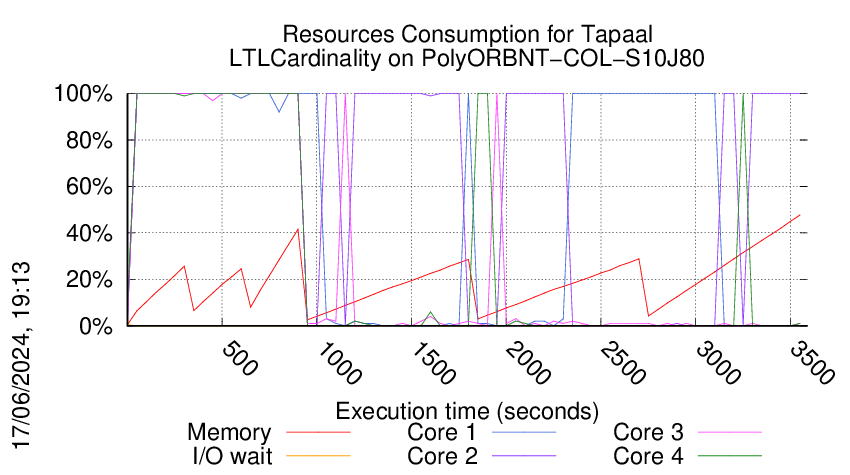
Execution Chart
We display below the execution chart for this examination (boot time has been removed).
Trace from the execution
Formatting '/mnt/tpsp/fkordon/mcc2024-input.r294-tajo-171654451800435.qcow2', fmt=qcow2 size=4294967296 backing_file='/mnt/tpsp/fkordon/mcc2024-input.qcow2' backing_fmt='qcow2' encryption=off cluster_size=65536 lazy_refcounts=off
Waiting for the VM to be ready (probing ssh)
...........................................................................................................................................................................................................................................................................................................................................................................................................................................................................................................................................................................................................................................................................................................................................................................................................................................................................................................................................................................................................................................................................................................................................................................................................................................................................................................................................................................................................................................................................................................................................................................................................................................................................................................................................................................................................................................................................................................................................................................................................................................................................................................................................................................................................................................................................................................................................................................................................................................................................................................................................................................................................................................................................................................................................................................................................................................................................................................................................................................................................................................................................................................................................................................................................................................................................................................................................................................................................................................................................................................................................................................................................................................................................................................................................
=====================================================================
Generated by BenchKit 2-5568
Executing tool tapaal
Input is PolyORBNT-COL-S10J80, examination is LTLCardinality
Time confinement is 3600 seconds
Memory confinement is 16384 MBytes
Number of cores is 4
Run identifier is r294-tajo-171654451800435
=====================================================================
--------------------
preparation of the directory to be used:
/home/mcc/execution
total 608K
-rw-r--r-- 1 mcc users 6.7K Apr 12 11:29 CTLCardinality.txt
-rw-r--r-- 1 mcc users 62K Apr 12 11:29 CTLCardinality.xml
-rw-r--r-- 1 mcc users 6.3K Apr 12 10:45 CTLFireability.txt
-rw-r--r-- 1 mcc users 55K Apr 12 10:45 CTLFireability.xml
-rw-r--r-- 1 mcc users 4.2K May 18 16:43 GenericPropertiesDefinition.xml
-rw-r--r-- 1 mcc users 6.5K May 18 16:43 GenericPropertiesVerdict.xml
-rw-r--r-- 1 mcc users 4.3K Apr 23 07:44 LTLCardinality.txt
-rw-r--r-- 1 mcc users 27K Apr 23 07:44 LTLCardinality.xml
-rw-r--r-- 1 mcc users 2.6K Apr 23 07:44 LTLFireability.txt
-rw-r--r-- 1 mcc users 19K Apr 23 07:44 LTLFireability.xml
-rw-r--r-- 1 mcc users 16K Apr 12 14:21 ReachabilityCardinality.txt
-rw-r--r-- 1 mcc users 150K Apr 12 14:21 ReachabilityCardinality.xml
-rw-r--r-- 1 mcc users 12K Apr 12 13:49 ReachabilityFireability.txt
-rw-r--r-- 1 mcc users 97K Apr 12 13:49 ReachabilityFireability.xml
-rw-r--r-- 1 mcc users 1.8K Apr 23 07:44 UpperBounds.txt
-rw-r--r-- 1 mcc users 3.8K Apr 23 07:44 UpperBounds.xml
-rw-r--r-- 1 mcc users 5 May 18 16:43 equiv_pt
-rw-r--r-- 1 mcc users 7 May 18 16:43 instance
-rw-r--r-- 1 mcc users 5 May 18 16:43 iscolored
-rw-r--r-- 1 mcc users 95K May 18 16:43 model.pnml
--------------------
content from stdout:
=== Data for post analysis generated by BenchKit (invocation template)
The expected result is a vector of booleans
BOOL_VECTOR
here is the order used to build the result vector(from text file)
FORMULA_NAME PolyORBNT-COL-S10J80-LTLCardinality-00
FORMULA_NAME PolyORBNT-COL-S10J80-LTLCardinality-01
FORMULA_NAME PolyORBNT-COL-S10J80-LTLCardinality-02
FORMULA_NAME PolyORBNT-COL-S10J80-LTLCardinality-03
FORMULA_NAME PolyORBNT-COL-S10J80-LTLCardinality-04
FORMULA_NAME PolyORBNT-COL-S10J80-LTLCardinality-05
FORMULA_NAME PolyORBNT-COL-S10J80-LTLCardinality-06
FORMULA_NAME PolyORBNT-COL-S10J80-LTLCardinality-07
FORMULA_NAME PolyORBNT-COL-S10J80-LTLCardinality-08
FORMULA_NAME PolyORBNT-COL-S10J80-LTLCardinality-09
FORMULA_NAME PolyORBNT-COL-S10J80-LTLCardinality-10
FORMULA_NAME PolyORBNT-COL-S10J80-LTLCardinality-11
FORMULA_NAME PolyORBNT-COL-S10J80-LTLCardinality-12
FORMULA_NAME PolyORBNT-COL-S10J80-LTLCardinality-13
FORMULA_NAME PolyORBNT-COL-S10J80-LTLCardinality-14
FORMULA_NAME PolyORBNT-COL-S10J80-LTLCardinality-15
=== Now, execution of the tool begins
BK_START 1716796770083
tapaal
Got BK_BIN_PATH=/home/mcc/BenchKit/bin/
---> tapaal --- TAPAAL - v2.2024
Setting MODEL_PATH=.
Setting VERIFYPN=/home/mcc/BenchKit/bin/verifypn
Got BK_TIME_CONFINEMENT=3600
Setting TEMPDIR=/home/mcc/BenchKit/bin/tmp
Got BK_MEMORY_CONFINEMENT=16384
Limiting to 16265216 kB
Total timeout: 3590
Time left: 3590
*************************************
* TAPAAL verifying LTLCardinality *
*************************************
TEMPDIR=/home/mcc/BenchKit/bin/tmp
QF=/home/mcc/BenchKit/bin/tmp/tmp.iMuuVIp3zb
MF=/home/mcc/BenchKit/bin/tmp/tmp.PsuUyt2XEs
Time left: 3590
---------------------------------------------------
Step -1: Stripping Colors
---------------------------------------------------
Verifying stripped models (16 in total)
Time left: 3590
---------------------------------------------------
Step 0: Parallel Simplification
---------------------------------------------------
Doing parallel simplification (16 in total)
Total simplification timout is 718 -- reduction timeout is 299
timeout 1017 /home/mcc/BenchKit/bin/verifypn -n -ltl -q 718 -l 29 -d 299 -z 4 -s OverApprox --binary-query-io 2 --write-simplified /home/mcc/BenchKit/bin/tmp/tmp.iMuuVIp3zb --write-reduced /home/mcc/BenchKit/bin/tmp/tmp.PsuUyt2XEs -x 1,2,3,4,5,6,7,8,9,10,11,12,13,14,15,16 ./model.pnml ./LTLCardinality.xml
FORMULA PolyORBNT-COL-S10J80-LTLCardinality-00 FALSE TECHNIQUES COLLATERAL_PROCESSING STRUCTURAL_REDUCTION QUERY_REDUCTION SAT_SMT LP_APPROX UNFOLDING_TO_PT
Query index 0 was solved
Query is NOT satisfied.
FORMULA PolyORBNT-COL-S10J80-LTLCardinality-01 TRUE TECHNIQUES COLLATERAL_PROCESSING STRUCTURAL_REDUCTION QUERY_REDUCTION SAT_SMT LP_APPROX UNFOLDING_TO_PT
Query index 1 was solved
Query is satisfied.
FORMULA PolyORBNT-COL-S10J80-LTLCardinality-04 TRUE TECHNIQUES COLLATERAL_PROCESSING STRUCTURAL_REDUCTION QUERY_REDUCTION SAT_SMT LP_APPROX UNFOLDING_TO_PT
Query index 4 was solved
Query is satisfied.
FORMULA PolyORBNT-COL-S10J80-LTLCardinality-09 FALSE TECHNIQUES COLLATERAL_PROCESSING STRUCTURAL_REDUCTION QUERY_REDUCTION SAT_SMT LP_APPROX UNFOLDING_TO_PT
Query index 9 was solved
Query is NOT satisfied.
FORMULA PolyORBNT-COL-S10J80-LTLCardinality-13 FALSE TECHNIQUES COLLATERAL_PROCESSING STRUCTURAL_REDUCTION QUERY_REDUCTION SAT_SMT LP_APPROX UNFOLDING_TO_PT
Query index 13 was solved
Query is NOT satisfied.
FORMULA PolyORBNT-COL-S10J80-LTLCardinality-14 TRUE TECHNIQUES COLLATERAL_PROCESSING STRUCTURAL_REDUCTION QUERY_REDUCTION SAT_SMT LP_APPROX UNFOLDING_TO_PT
Query index 14 was solved
Query is satisfied.
Solution found by parallel simplification (step 0)
Solution found by parallel simplification (step 0)
Solution found by parallel simplification (step 0)
Solution found by parallel simplification (step 0)
Solution found by parallel simplification (step 0)
Solution found by parallel simplification (step 0)
Time left: 3575
---------------------------------------------------
Step 1: Parallel processing
---------------------------------------------------
Doing parallel verification of individual queries (10 in total)
Each query is verified by 4 parallel strategies for 299 seconds
------------------- QUERY 1 ----------------------
Solution found by parallel processing (step 1)
Query index 0 was solved
Query is NOT satisfied.
Spent 0.027272 on verification
@@@0.19,23956@@@
parallel: This job succeeded:
eval /usr/bin/time -f "@@@%e,%M@@@" /home/mcc/BenchKit/bin/verifypn -n '-ltl tarjan --ltl-heur dist -q 0 -l 0 -d 119' /home/mcc/BenchKit/bin/tmp/tmp.PsuUyt2XEs /home/mcc/BenchKit/bin/tmp/tmp.iMuuVIp3zb --binary-query-io 1 -x 1 -n
FORMULA PolyORBNT-COL-S10J80-LTLCardinality-08 FALSE TECHNIQUES COLLATERAL_PROCESSING STRUCTURAL_REDUCTION QUERY_REDUCTION SAT_SMT EXPLICIT STATE_COMPRESSION STUBBORN_SETS
Time left: 3575
------------------- QUERY 2 ----------------------
No solution found
parallel: Warning: This job was killed because it timed out:
parallel: Warning: eval /usr/bin/time -f "@@@%e,%M@@@" /home/mcc/BenchKit/bin/verifypn -n '-ltl tarjan --ltl-heur dist -q 0 -l 0 -d 119' /home/mcc/BenchKit/bin/tmp/tmp.PsuUyt2XEs /home/mcc/BenchKit/bin/tmp/tmp.iMuuVIp3zb --binary-query-io 1 -x 2 -n
parallel: Warning: This job was killed because it timed out:
parallel: Warning: eval /usr/bin/time -f "@@@%e,%M@@@" /home/mcc/BenchKit/bin/verifypn -n '-ltl tarjan --ltl-heur fire-count -q 0 -l 0 -d 119' /home/mcc/BenchKit/bin/tmp/tmp.PsuUyt2XEs /home/mcc/BenchKit/bin/tmp/tmp.iMuuVIp3zb --binary-query-io 1 -x 2 -n
parallel: Warning: This job was killed because it timed out:
parallel: Warning: eval /usr/bin/time -f "@@@%e,%M@@@" /home/mcc/BenchKit/bin/verifypn -n '-ltl tarjan --ltl-heur aut -s DFS -p -q 0 -l 0 -d 119' /home/mcc/BenchKit/bin/tmp/tmp.PsuUyt2XEs /home/mcc/BenchKit/bin/tmp/tmp.iMuuVIp3zb --binary-query-io 1 -x 2 -n
parallel: Warning: This job was killed because it timed out:
parallel: Warning: eval /usr/bin/time -f "@@@%e,%M@@@" /home/mcc/BenchKit/bin/verifypn -n '-ltl ndfs -q 0 -l 0 -d 119' /home/mcc/BenchKit/bin/tmp/tmp.PsuUyt2XEs /home/mcc/BenchKit/bin/tmp/tmp.iMuuVIp3zb --binary-query-io 1 -x 2 -n
Time left: 3273
------------------- QUERY 3 ----------------------
Solution found by parallel processing (step 1)
Query index 0 was solved
Query is NOT satisfied.
Spent 0.00674 on verification
@@@0.46,26020@@@
parallel: This job succeeded:
eval /usr/bin/time -f "@@@%e,%M@@@" /home/mcc/BenchKit/bin/verifypn -n '-ltl ndfs -q 0 -l 0 -d 119' /home/mcc/BenchKit/bin/tmp/tmp.PsuUyt2XEs /home/mcc/BenchKit/bin/tmp/tmp.iMuuVIp3zb --binary-query-io 1 -x 3 -n
FORMULA PolyORBNT-COL-S10J80-LTLCardinality-02 FALSE TECHNIQUES EXPLICIT NDFS WEAK_SKIP HEURISTIC AUTOMATON_HEUR OPTIM-1
Time left: 3273
------------------- QUERY 4 ----------------------
No solution found
parallel: Warning: This job was killed because it timed out:
parallel: Warning: eval /usr/bin/time -f "@@@%e,%M@@@" /home/mcc/BenchKit/bin/verifypn -n '-ltl tarjan --ltl-heur dist -q 0 -l 0 -d 119' /home/mcc/BenchKit/bin/tmp/tmp.PsuUyt2XEs /home/mcc/BenchKit/bin/tmp/tmp.iMuuVIp3zb --binary-query-io 1 -x 4 -n
parallel: Warning: This job was killed because it timed out:
parallel: Warning: eval /usr/bin/time -f "@@@%e,%M@@@" /home/mcc/BenchKit/bin/verifypn -n '-ltl tarjan --ltl-heur fire-count -q 0 -l 0 -d 119' /home/mcc/BenchKit/bin/tmp/tmp.PsuUyt2XEs /home/mcc/BenchKit/bin/tmp/tmp.iMuuVIp3zb --binary-query-io 1 -x 4 -n
parallel: Warning: This job was killed because it timed out:
parallel: Warning: eval /usr/bin/time -f "@@@%e,%M@@@" /home/mcc/BenchKit/bin/verifypn -n '-ltl tarjan --ltl-heur aut -s DFS -p -q 0 -l 0 -d 119' /home/mcc/BenchKit/bin/tmp/tmp.PsuUyt2XEs /home/mcc/BenchKit/bin/tmp/tmp.iMuuVIp3zb --binary-query-io 1 -x 4 -n
parallel: Warning: This job was killed because it timed out:
parallel: Warning: eval /usr/bin/time -f "@@@%e,%M@@@" /home/mcc/BenchKit/bin/verifypn -n '-ltl ndfs -q 0 -l 0 -d 119' /home/mcc/BenchKit/bin/tmp/tmp.PsuUyt2XEs /home/mcc/BenchKit/bin/tmp/tmp.iMuuVIp3zb --binary-query-io 1 -x 4 -n
Time left: 2971
------------------- QUERY 5 ----------------------
Solution found by parallel processing (step 1)
Query index 0 was solved
Query is satisfied.
Spent 0.01822 on verification
@@@0.86,25944@@@
parallel: This job succeeded:
eval /usr/bin/time -f "@@@%e,%M@@@" /home/mcc/BenchKit/bin/verifypn -n '-ltl ndfs -q 0 -l 0 -d 119' /home/mcc/BenchKit/bin/tmp/tmp.PsuUyt2XEs /home/mcc/BenchKit/bin/tmp/tmp.iMuuVIp3zb --binary-query-io 1 -x 5 -n
FORMULA PolyORBNT-COL-S10J80-LTLCardinality-11 TRUE TECHNIQUES EXPLICIT NDFS WEAK_SKIP HEURISTIC AUTOMATON_HEUR OPTIM-1
Time left: 2969
------------------- QUERY 6 ----------------------
Solution found by parallel processing (step 1)
Query index 0 was solved
Query is satisfied.
Spent 0.018283 on verification
@@@0.72,25896@@@
parallel: This job succeeded:
eval /usr/bin/time -f "@@@%e,%M@@@" /home/mcc/BenchKit/bin/verifypn -n '-ltl ndfs -q 0 -l 0 -d 119' /home/mcc/BenchKit/bin/tmp/tmp.PsuUyt2XEs /home/mcc/BenchKit/bin/tmp/tmp.iMuuVIp3zb --binary-query-io 1 -x 6 -n
FORMULA PolyORBNT-COL-S10J80-LTLCardinality-06 TRUE TECHNIQUES EXPLICIT NDFS WEAK_SKIP HEURISTIC AUTOMATON_HEUR OPTIM-1
Time left: 2968
------------------- QUERY 7 ----------------------
No solution found
parallel: Warning: This job was killed because it timed out:
parallel: Warning: eval /usr/bin/time -f "@@@%e,%M@@@" /home/mcc/BenchKit/bin/verifypn -n '-ltl tarjan --ltl-heur dist -q 0 -l 0 -d 119' /home/mcc/BenchKit/bin/tmp/tmp.PsuUyt2XEs /home/mcc/BenchKit/bin/tmp/tmp.iMuuVIp3zb --binary-query-io 1 -x 7 -n
parallel: Warning: This job was killed because it timed out:
parallel: Warning: eval /usr/bin/time -f "@@@%e,%M@@@" /home/mcc/BenchKit/bin/verifypn -n '-ltl tarjan --ltl-heur fire-count -q 0 -l 0 -d 119' /home/mcc/BenchKit/bin/tmp/tmp.PsuUyt2XEs /home/mcc/BenchKit/bin/tmp/tmp.iMuuVIp3zb --binary-query-io 1 -x 7 -n
parallel: Warning: This job was killed because it timed out:
parallel: Warning: eval /usr/bin/time -f "@@@%e,%M@@@" /home/mcc/BenchKit/bin/verifypn -n '-ltl tarjan --ltl-heur aut -s DFS -p -q 0 -l 0 -d 119' /home/mcc/BenchKit/bin/tmp/tmp.PsuUyt2XEs /home/mcc/BenchKit/bin/tmp/tmp.iMuuVIp3zb --binary-query-io 1 -x 7 -n
parallel: Warning: This job was killed because it timed out:
parallel: Warning: eval /usr/bin/time -f "@@@%e,%M@@@" /home/mcc/BenchKit/bin/verifypn -n '-ltl ndfs -q 0 -l 0 -d 119' /home/mcc/BenchKit/bin/tmp/tmp.PsuUyt2XEs /home/mcc/BenchKit/bin/tmp/tmp.iMuuVIp3zb --binary-query-io 1 -x 7 -n
Time left: 2666
------------------- QUERY 8 ----------------------
Solution found by parallel processing (step 1)
Query index 0 was solved
Query is NOT satisfied.
Spent 0.155132 on verification
@@@0.85,153968@@@
parallel: This job succeeded:
eval /usr/bin/time -f "@@@%e,%M@@@" /home/mcc/BenchKit/bin/verifypn -n '-ltl tarjan --ltl-heur dist -q 0 -l 0 -d 119' /home/mcc/BenchKit/bin/tmp/tmp.PsuUyt2XEs /home/mcc/BenchKit/bin/tmp/tmp.iMuuVIp3zb --binary-query-io 1 -x 8 -n
FORMULA PolyORBNT-COL-S10J80-LTLCardinality-05 FALSE TECHNIQUES EXPLICIT TARJAN WEAK_SKIP STUBBORN AUT_STUB HEURISTIC LOGFIRECOUNT_HEUR(5000) OPTIM-1
Query index 0 was solved
Query is NOT satisfied.
Spent 0.162808 on verification
@@@0.84,153896@@@
parallel: This job succeeded:
eval /usr/bin/time -f "@@@%e,%M@@@" /home/mcc/BenchKit/bin/verifypn -n '-ltl tarjan --ltl-heur fire-count -q 0 -l 0 -d 119' /home/mcc/BenchKit/bin/tmp/tmp.PsuUyt2XEs /home/mcc/BenchKit/bin/tmp/tmp.iMuuVIp3zb --binary-query-io 1 -x 8 -n
FORMULA PolyORBNT-COL-S10J80-LTLCardinality-05 FALSE TECHNIQUES EXPLICIT TARJAN WEAK_SKIP STUBBORN AUT_STUB HEURISTIC DIST_HEUR OPTIM-1
Time left: 2665
------------------- QUERY 9 ----------------------
Solution found by parallel processing (step 1)
Query index 0 was solved
Query is NOT satisfied.
Spent 0.045464 on verification
@@@0.40,154620@@@
parallel: This job succeeded:
eval /usr/bin/time -f "@@@%e,%M@@@" /home/mcc/BenchKit/bin/verifypn -n '-ltl tarjan --ltl-heur fire-count -q 0 -l 0 -d 119' /home/mcc/BenchKit/bin/tmp/tmp.PsuUyt2XEs /home/mcc/BenchKit/bin/tmp/tmp.iMuuVIp3zb --binary-query-io 1 -x 9 -n
FORMULA PolyORBNT-COL-S10J80-LTLCardinality-07 FALSE TECHNIQUES EXPLICIT TARJAN WEAK_SKIP STUBBORN AUT_STUB HEURISTIC LOGFIRECOUNT_HEUR(5000) OPTIM-1
Time left: 2665
------------------- QUERY 10 ----------------------
Solution found by parallel processing (step 1)
Query index 0 was solved
Query is NOT satisfied.
Spent 0.089393 on verification
@@@0.85,153520@@@
parallel: This job succeeded:
eval /usr/bin/time -f "@@@%e,%M@@@" /home/mcc/BenchKit/bin/verifypn -n '-ltl tarjan --ltl-heur aut -s DFS -p -q 0 -l 0 -d 119' /home/mcc/BenchKit/bin/tmp/tmp.PsuUyt2XEs /home/mcc/BenchKit/bin/tmp/tmp.iMuuVIp3zb --binary-query-io 1 -x 10 -n
FORMULA PolyORBNT-COL-S10J80-LTLCardinality-12 FALSE TECHNIQUES EXPLICIT TARJAN WEAK_SKIP STUBBORN AUT_STUB HEURISTIC DIST_HEUR OPTIM-1
Query index 0 was solved
Query is NOT satisfied.
Spent 0.104439 on verification
@@@0.86,154304@@@
parallel: This job succeeded:
eval /usr/bin/time -f "@@@%e,%M@@@" /home/mcc/BenchKit/bin/verifypn -n '-ltl tarjan --ltl-heur dist -q 0 -l 0 -d 119' /home/mcc/BenchKit/bin/tmp/tmp.PsuUyt2XEs /home/mcc/BenchKit/bin/tmp/tmp.iMuuVIp3zb --binary-query-io 1 -x 10 -n
FORMULA PolyORBNT-COL-S10J80-LTLCardinality-12 FALSE TECHNIQUES EXPLICIT TARJAN WEAK_SKIP OPTIM-1
Time left: 2664
---------------------------------------------------
Step 2: Sequential processing
---------------------------------------------------
Remaining 3 queries are verified sequentially.
Each query is verified for a dynamic timeout (at least 512 seconds)
Time left: 2664
------------------- QUERY 2 ----------------------
Running query 2 for 888 seconds. Remaining: 3 queries and 2664 seconds
No solution found
parallel: Warning: This job was killed because it timed out:
parallel: Warning: eval /usr/bin/time -f "@@@%e,%M@@@" /home/mcc/BenchKit/bin/verifypn -n '-ltl tarjan -q 40 -l 5 -d 119 -s BestFS --ltl-por automaton --ltl-heur aut' /home/mcc/BenchKit/bin/tmp/tmp.PsuUyt2XEs /home/mcc/BenchKit/bin/tmp/tmp.iMuuVIp3zb --binary-query-io 1 -x 2 -n
Time left: 1774
------------------- QUERY 4 ----------------------
Running query 4 for 887 seconds. Remaining: 2 queries and 1774 seconds
No solution found
parallel: Warning: This job was killed because it timed out:
parallel: Warning: eval /usr/bin/time -f "@@@%e,%M@@@" /home/mcc/BenchKit/bin/verifypn -n '-ltl tarjan -q 40 -l 5 -d 119 -s BestFS --ltl-por automaton --ltl-heur aut' /home/mcc/BenchKit/bin/tmp/tmp.PsuUyt2XEs /home/mcc/BenchKit/bin/tmp/tmp.iMuuVIp3zb --binary-query-io 1 -x 4 -n
Time left: 884
------------------- QUERY 7 ----------------------
Running query 7 for 884 seconds. Remaining: 1 queries and 884 seconds
No solution found
parallel: Warning: This job was killed because it timed out:
parallel: Warning: eval /usr/bin/time -f "@@@%e,%M@@@" /home/mcc/BenchKit/bin/verifypn -n '-ltl tarjan -q 40 -l 5 -d 119 -s BestFS --ltl-por automaton --ltl-heur aut' /home/mcc/BenchKit/bin/tmp/tmp.PsuUyt2XEs /home/mcc/BenchKit/bin/tmp/tmp.iMuuVIp3zb --binary-query-io 1 -x 7 -n
Time left: -2
Out of time, terminating!
terminated-with-cleanup
BK_STOP 1716800362741
--------------------
content from stderr:
ERROR: A query could not be translated from CTL* to CTL.
Sequence of Actions to be Executed by the VM
This is useful if one wants to reexecute the tool in the VM from the submitted image disk.
set -x
# this is for BenchKit: configuration of major elements for the test
export BK_INPUT="PolyORBNT-COL-S10J80"
export BK_EXAMINATION="LTLCardinality"
export BK_TOOL="tapaal"
export BK_RESULT_DIR="/tmp/BK_RESULTS/OUTPUTS"
export BK_TIME_CONFINEMENT="3600"
export BK_MEMORY_CONFINEMENT="16384"
export BK_BIN_PATH="/home/mcc/BenchKit/bin/"
# this is specific to your benchmark or test
export BIN_DIR="$HOME/BenchKit/bin"
# remove the execution directoty if it exists (to avoid increse of .vmdk images)
if [ -d execution ] ; then
rm -rf execution
fi
# this is for BenchKit: explicit launching of the test
echo "====================================================================="
echo " Generated by BenchKit 2-5568"
echo " Executing tool tapaal"
echo " Input is PolyORBNT-COL-S10J80, examination is LTLCardinality"
echo " Time confinement is $BK_TIME_CONFINEMENT seconds"
echo " Memory confinement is 16384 MBytes"
echo " Number of cores is 4"
echo " Run identifier is r294-tajo-171654451800435"
echo "====================================================================="
echo
echo "--------------------"
echo "preparation of the directory to be used:"
tar xzf /home/mcc/BenchKit/INPUTS/PolyORBNT-COL-S10J80.tgz
mv PolyORBNT-COL-S10J80 execution
cd execution
if [ "LTLCardinality" = "ReachabilityDeadlock" ] || [ "LTLCardinality" = "UpperBounds" ] || [ "LTLCardinality" = "QuasiLiveness" ] || [ "LTLCardinality" = "StableMarking" ] || [ "LTLCardinality" = "Liveness" ] || [ "LTLCardinality" = "OneSafe" ] || [ "LTLCardinality" = "StateSpace" ]; then
rm -f GenericPropertiesVerdict.xml
fi
pwd
ls -lh
echo
echo "--------------------"
echo "content from stdout:"
echo
echo "=== Data for post analysis generated by BenchKit (invocation template)"
echo
if [ "LTLCardinality" = "UpperBounds" ] ; then
echo "The expected result is a vector of positive values"
echo NUM_VECTOR
elif [ "LTLCardinality" != "StateSpace" ] ; then
echo "The expected result is a vector of booleans"
echo BOOL_VECTOR
else
echo "no data necessary for post analysis"
fi
echo
if [ -f "LTLCardinality.txt" ] ; then
echo "here is the order used to build the result vector(from text file)"
for x in $(grep Property LTLCardinality.txt | cut -d ' ' -f 2 | sort -u) ; do
echo "FORMULA_NAME $x"
done
elif [ -f "LTLCardinality.xml" ] ; then # for cunf (txt files deleted;-)
echo echo "here is the order used to build the result vector(from xml file)"
for x in $(grep '
echo "FORMULA_NAME $x"
done
elif [ "LTLCardinality" = "ReachabilityDeadlock" ] || [ "LTLCardinality" = "QuasiLiveness" ] || [ "LTLCardinality" = "StableMarking" ] || [ "LTLCardinality" = "Liveness" ] || [ "LTLCardinality" = "OneSafe" ] ; then
echo "FORMULA_NAME LTLCardinality"
fi
echo
echo "=== Now, execution of the tool begins"
echo
echo -n "BK_START "
date -u +%s%3N
echo
timeout -s 9 $BK_TIME_CONFINEMENT bash -c "/home/mcc/BenchKit/BenchKit_head.sh 2> STDERR ; echo ; echo -n \"BK_STOP \" ; date -u +%s%3N"
if [ $? -eq 137 ] ; then
echo
echo "BK_TIME_CONFINEMENT_REACHED"
fi
echo
echo "--------------------"
echo "content from stderr:"
echo
cat STDERR ;