

About the Execution of 2023-gold for FlexibleBarrier-PT-22a
| Execution Summary | |||||
| Max Memory Used (MB) |
Time wait (ms) | CPU Usage (ms) | I/O Wait (ms) | Computed Result | Execution Status |
| 190.991 | 3473.00 | 5739.00 | 245.60 | F | normal |
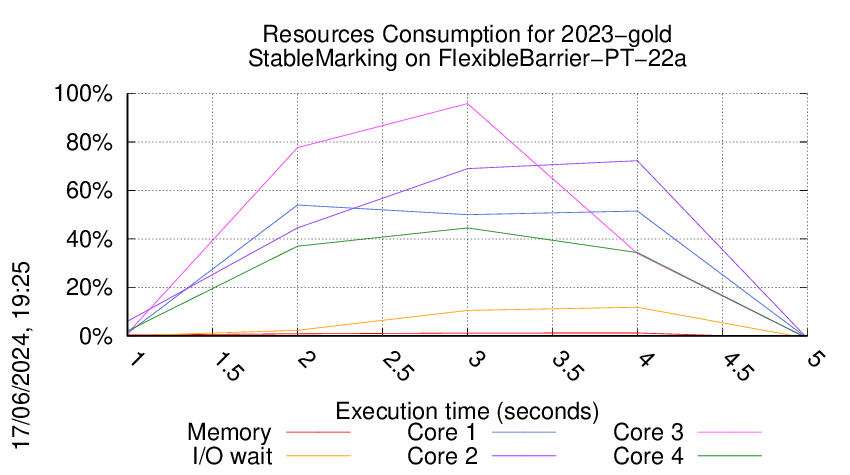
Execution Chart
We display below the execution chart for this examination (boot time has been removed).
Trace from the execution
Formatting '/data/fkordon/mcc2024-input.r198-tall-171640626000093.qcow2', fmt=qcow2 size=4294967296 backing_file=/data/fkordon/mcc2024-input.qcow2 backing_fmt=qcow2 cluster_size=65536 lazy_refcounts=off refcount_bits=16
Waiting for the VM to be ready (probing ssh)
...........................................................................................................................................................................................................................................................................................................................................................................................................................................................................................................................................................................................................................................................................................................................................................................................................................................................................................................................................................................................................................................................................................................................................................................................................................................................
=====================================================================
Generated by BenchKit 2-5568
Executing tool gold2023
Input is FlexibleBarrier-PT-22a, examination is StableMarking
Time confinement is 1800 seconds
Memory confinement is 16384 MBytes
Number of cores is 4
Run identifier is r198-tall-171640626000093
=====================================================================
--------------------
preparation of the directory to be used:
/home/mcc/execution
total 816K
-rw-r--r-- 1 mcc users 7.6K May 14 13:22 CTLCardinality.txt
-rw-r--r-- 1 mcc users 81K May 14 13:22 CTLCardinality.xml
-rw-r--r-- 1 mcc users 5.2K May 14 13:22 CTLFireability.txt
-rw-r--r-- 1 mcc users 46K May 14 13:22 CTLFireability.xml
-rw-r--r-- 1 mcc users 4.2K May 18 16:42 GenericPropertiesDefinition.xml
-rw-r--r-- 1 mcc users 3.9K Apr 22 14:45 LTLCardinality.txt
-rw-r--r-- 1 mcc users 27K Apr 22 14:45 LTLCardinality.xml
-rw-r--r-- 1 mcc users 2.4K Apr 22 14:45 LTLFireability.txt
-rw-r--r-- 1 mcc users 19K Apr 22 14:45 LTLFireability.xml
-rw-r--r-- 1 mcc users 9.7K Apr 13 12:28 ReachabilityCardinality.txt
-rw-r--r-- 1 mcc users 99K Apr 13 12:28 ReachabilityCardinality.xml
-rw-r--r-- 1 mcc users 8.6K Apr 13 12:08 ReachabilityFireability.txt
-rw-r--r-- 1 mcc users 74K Apr 13 12:08 ReachabilityFireability.xml
-rw-r--r-- 1 mcc users 1.7K Apr 22 14:45 UpperBounds.txt
-rw-r--r-- 1 mcc users 3.7K Apr 22 14:45 UpperBounds.xml
-rw-r--r-- 1 mcc users 6 May 18 16:42 equiv_col
-rw-r--r-- 1 mcc users 4 May 18 16:42 instance
-rw-r--r-- 1 mcc users 6 May 18 16:42 iscolored
-rw-r--r-- 1 mcc users 384K May 18 16:42 model.pnml
--------------------
content from stdout:
=== Data for post analysis generated by BenchKit (invocation template)
The expected result is a vector of booleans
BOOL_VECTOR
FORMULA_NAME StableMarking
=== Now, execution of the tool begins
BK_START 1716495988217
bash -c /home/mcc/BenchKit/BenchKit_head.sh 2> STDERR ; echo ; echo -n "BK_STOP " ; date -u +%s%3N
Invoking MCC driver with
BK_TOOL=gold2023
BK_EXAMINATION=StableMarking
BK_BIN_PATH=/home/mcc/BenchKit/bin/
BK_TIME_CONFINEMENT=1800
BK_INPUT=FlexibleBarrier-PT-22a
Not applying reductions.
Model is PT
StableMarking PT
Running Version 202304061127
[2024-05-23 20:26:29] [INFO ] Running its-tools with arguments : [-pnfolder, /home/mcc/execution, -examination, StableMarking, -its, -ltsmin, -greatspnpath, /home/mcc/BenchKit/bin//../itstools/bin//..//greatspn/, -order, META, -manyOrder, -smt, -timeout, 1800]
[2024-05-23 20:26:29] [INFO ] Parsing pnml file : /home/mcc/execution/model.pnml
[2024-05-23 20:26:29] [INFO ] Load time of PNML (sax parser for PT used): 95 ms
[2024-05-23 20:26:29] [INFO ] Transformed 267 places.
[2024-05-23 20:26:30] [INFO ] Transformed 1258 transitions.
[2024-05-23 20:26:30] [INFO ] Found NUPN structural information;
[2024-05-23 20:26:30] [INFO ] Parsed PT model containing 267 places and 1258 transitions and 6375 arcs in 415 ms.
Graph (trivial) has 221 edges and 267 vertex of which 66 / 267 are part of one of the 22 SCC in 3 ms
Free SCC test removed 44 places
Structural test allowed to assert that 91 places are NOT stable. Took 15 ms.
Ensure Unique test removed 696 transitions
Reduce redundant transitions removed 696 transitions.
Finished random walk after 825 steps, including 0 resets, run visited all 176 properties in 107 ms. (steps per millisecond=7 )
Parikh walk visited 0 properties in 0 ms.
[2024-05-23 20:26:30] [INFO ] Flatten gal took : 58 ms
[2024-05-23 20:26:30] [INFO ] Flatten gal took : 21 ms
[2024-05-23 20:26:30] [INFO ] Time to serialize gal into /tmp/ReachabilityCardinality1859900975081975365.gal : 20 ms
[2024-05-23 20:26:30] [INFO ] Time to serialize properties into /tmp/ReachabilityCardinality16778210559254103681.prop : 1 ms
Invoking ITS tools like this :cd /home/mcc/execution;'/home/mcc/BenchKit/itstools/itstools/plugins/fr.lip6.move.gal.itstools.binaries_1.0.0.202304061127/bin/its-reach-linux64' '--gc-threshold' '2000000' '--quiet' '-i' '/tmp/ReachabilityCardinality1859900975081975365.gal' '-t' 'CGAL' '-reachable-file' '/tmp/ReachabilityCardinality16778210559254103681.prop' '--nowitness' '--gen-order' 'FOLLOW'
its-reach command run as :
ITS runner failed with exception null
java.lang.InterruptedException
at java.base/java.lang.Object.wait(Native Method)
at java.base/java.lang.Thread.join(Thread.java:1304)
at java.base/java.lang.Thread.join(Thread.java:1372)
at fr.lip6.move.gal.application.runner.AbstractRunner.join(AbstractRunner.java:27)
at fr.lip6.move.gal.application.runner.its.ITSRunner.join(ITSRunner.java:177)
at fr.lip6.move.gal.application.solver.global.GlobalPropertySolver.verifyWithSDD(GlobalPropertySolver.java:675)
at fr.lip6.move.gal.application.solver.ReachabilitySolver.lambda$2(ReachabilitySolver.java:63)
at java.base/java.lang.Thread.run(Thread.java:833)
/home/mcc/BenchKit/itstools/itstools/plugins/fr.lip6.move.gal.itstools.binaries_1.0.0.202304061127/bin/its-reach-linux64 --gc-threshold 2000000 --quiet ...329
Able to resolve query StableMarking after proving 178 properties.
FORMULA StableMarking FALSE TECHNIQUES RANDOM_WALK MARKED_SUFFIX_TEST TRIVIAL_UNMARKED_SCC_TEST TOPOLOGICAL
Total runtime 938 ms.
Loading property file /tmp/ReachabilityCardinality16778210559254103681.prop.
Found states matching all0 target predicate
Will report total states built up to this point. Computation was interrupted after 3 fixpoint passes
Model ,|S| ,Time ,Mem(kb) ,fin. SDD ,fin. DDD ,peak SDD ,peak DDD ,SDD Hom ,SDD cache peak ,DDD Hom ,DDD cachepeak ,SHom cache
petri\_inst\_inst,5,0.107242,7168,2,401,5,986,6,0,1430,302,0
Total reachable state count : 5
BK_STOP 1716495991690
--------------------
content from stderr:
+ export BINDIR=/home/mcc/BenchKit/bin//../itstools/bin//../
+ BINDIR=/home/mcc/BenchKit/bin//../itstools/bin//../
++ pwd
+ export MODEL=/home/mcc/execution
+ MODEL=/home/mcc/execution
+ [[ StableMarking = StateSpace ]]
+ /home/mcc/BenchKit/bin//../itstools/bin//..//runeclipse.sh /home/mcc/execution StableMarking -its -ltsmin -greatspnpath /home/mcc/BenchKit/bin//../itstools/bin//..//greatspn/ -order META -manyOrder -smt -timeout 1800
+ ulimit -s 65536
+ [[ -z '' ]]
+ export LTSMIN_MEM_SIZE=8589934592
+ LTSMIN_MEM_SIZE=8589934592
+ export PYTHONPATH=/home/mcc/BenchKit/itstools/pylibs
+ PYTHONPATH=/home/mcc/BenchKit/itstools/pylibs
+ export LD_LIBRARY_PATH=/home/mcc/BenchKit/itstools/pylibs:
+ LD_LIBRARY_PATH=/home/mcc/BenchKit/itstools/pylibs:
++ perl -pe 's/.*\.//g'
++ sed s/.jar//
++ ls /home/mcc/BenchKit/bin//../itstools/bin//..//itstools/plugins/fr.lip6.move.gal.application.pnmcc_1.0.0.202304061127.jar
+ VERSION=202304061127
+ echo 'Running Version 202304061127'
+ /home/mcc/BenchKit/bin//../itstools/bin//..//itstools/its-tools -pnfolder /home/mcc/execution -examination StableMarking -its -ltsmin -greatspnpath /home/mcc/BenchKit/bin//../itstools/bin//..//greatspn/ -order META -manyOrder -smt -timeout 1800
Sequence of Actions to be Executed by the VM
This is useful if one wants to reexecute the tool in the VM from the submitted image disk.
set -x
# this is for BenchKit: configuration of major elements for the test
export BK_INPUT="FlexibleBarrier-PT-22a"
export BK_EXAMINATION="StableMarking"
export BK_TOOL="gold2023"
export BK_RESULT_DIR="/tmp/BK_RESULTS/OUTPUTS"
export BK_TIME_CONFINEMENT="1800"
export BK_MEMORY_CONFINEMENT="16384"
export BK_BIN_PATH="/home/mcc/BenchKit/bin/"
# this is specific to your benchmark or test
export BIN_DIR="$HOME/BenchKit/bin"
# remove the execution directoty if it exists (to avoid increse of .vmdk images)
if [ -d execution ] ; then
rm -rf execution
fi
# this is for BenchKit: explicit launching of the test
echo "====================================================================="
echo " Generated by BenchKit 2-5568"
echo " Executing tool gold2023"
echo " Input is FlexibleBarrier-PT-22a, examination is StableMarking"
echo " Time confinement is $BK_TIME_CONFINEMENT seconds"
echo " Memory confinement is 16384 MBytes"
echo " Number of cores is 4"
echo " Run identifier is r198-tall-171640626000093"
echo "====================================================================="
echo
echo "--------------------"
echo "preparation of the directory to be used:"
tar xzf /home/mcc/BenchKit/INPUTS/FlexibleBarrier-PT-22a.tgz
mv FlexibleBarrier-PT-22a execution
cd execution
if [ "StableMarking" = "ReachabilityDeadlock" ] || [ "StableMarking" = "UpperBounds" ] || [ "StableMarking" = "QuasiLiveness" ] || [ "StableMarking" = "StableMarking" ] || [ "StableMarking" = "Liveness" ] || [ "StableMarking" = "OneSafe" ] || [ "StableMarking" = "StateSpace" ]; then
rm -f GenericPropertiesVerdict.xml
fi
pwd
ls -lh
echo
echo "--------------------"
echo "content from stdout:"
echo
echo "=== Data for post analysis generated by BenchKit (invocation template)"
echo
if [ "StableMarking" = "UpperBounds" ] ; then
echo "The expected result is a vector of positive values"
echo NUM_VECTOR
elif [ "StableMarking" != "StateSpace" ] ; then
echo "The expected result is a vector of booleans"
echo BOOL_VECTOR
else
echo "no data necessary for post analysis"
fi
echo
if [ -f "StableMarking.txt" ] ; then
echo "here is the order used to build the result vector(from text file)"
for x in $(grep Property StableMarking.txt | cut -d ' ' -f 2 | sort -u) ; do
echo "FORMULA_NAME $x"
done
elif [ -f "StableMarking.xml" ] ; then # for cunf (txt files deleted;-)
echo echo "here is the order used to build the result vector(from xml file)"
for x in $(grep '
echo "FORMULA_NAME $x"
done
elif [ "StableMarking" = "ReachabilityDeadlock" ] || [ "StableMarking" = "QuasiLiveness" ] || [ "StableMarking" = "StableMarking" ] || [ "StableMarking" = "Liveness" ] || [ "StableMarking" = "OneSafe" ] ; then
echo "FORMULA_NAME StableMarking"
fi
echo
echo "=== Now, execution of the tool begins"
echo
echo -n "BK_START "
date -u +%s%3N
echo
timeout -s 9 $BK_TIME_CONFINEMENT bash -c "/home/mcc/BenchKit/BenchKit_head.sh 2> STDERR ; echo ; echo -n \"BK_STOP \" ; date -u +%s%3N"
if [ $? -eq 137 ] ; then
echo
echo "BK_TIME_CONFINEMENT_REACHED"
fi
echo
echo "--------------------"
echo "content from stderr:"
echo
cat STDERR ;