

About the Execution of Tapaal for BART-COL-030
| Execution Summary | |||||
| Max Memory Used (MB) |
Time wait (ms) | CPU Usage (ms) | I/O Wait (ms) | Computed Result | Execution Status |
| 2913.840 | 3592708.00 | 4956058.00 | 9777.60 | TFFFFFF?FFFTTFFF | normal |
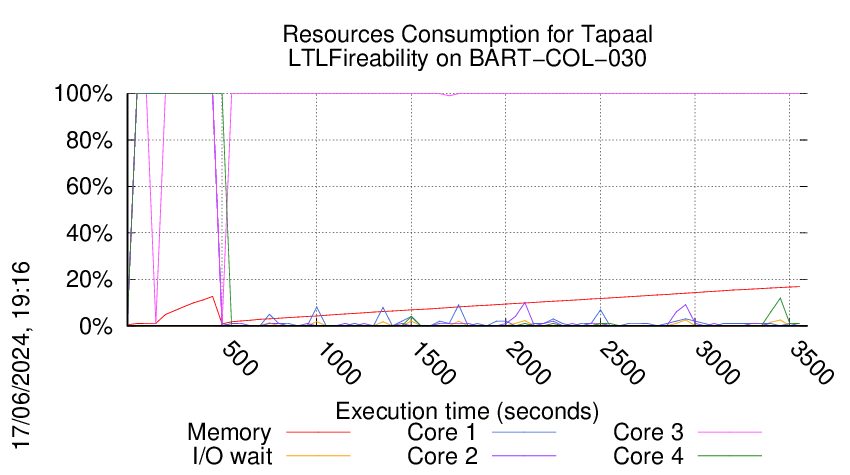
Execution Chart
We display below the execution chart for this examination (boot time has been removed).
Trace from the execution
Formatting '/data/fkordon/mcc2024-input.r030-smll-171620172000412.qcow2', fmt=qcow2 size=4294967296 backing_file=/data/fkordon/mcc2024-input.qcow2 backing_fmt=qcow2 cluster_size=65536 lazy_refcounts=off refcount_bits=16
Waiting for the VM to be ready (probing ssh)
..........................................................................................................................................................................................................................................................................................................................................................................................................................................................................................................................................................................................................................................................................................................................................................................................................................................................................................................................................................................................................................................................................................................................................................................................................................................................................................................................................................................................................................................................................................................................................................................................................................................................................................................................................................................................................................................................................................................................................................................................................................................................................................................................................................................................................................................................................................................................................................................................................................................................................................................................................................................................................................................................................................................................................................................................................................................................................................................................................................................................................................................................................................................................................................................................................................................................................................................................................................................................................................................................................................................................................................................................................................................................................................................................................................................................................................................................................................................................................................................................................................................................................................................................................................................
=====================================================================
Generated by BenchKit 2-5568
Executing tool tapaal
Input is BART-COL-030, examination is LTLFireability
Time confinement is 3600 seconds
Memory confinement is 16384 MBytes
Number of cores is 4
Run identifier is r030-smll-171620172000412
=====================================================================
--------------------
preparation of the directory to be used:
/home/mcc/execution
total 708K
-rw-r--r-- 1 mcc users 7.1K Apr 12 23:29 CTLCardinality.txt
-rw-r--r-- 1 mcc users 65K Apr 12 23:29 CTLCardinality.xml
-rw-r--r-- 1 mcc users 6.2K Apr 12 21:42 CTLFireability.txt
-rw-r--r-- 1 mcc users 54K Apr 12 21:42 CTLFireability.xml
-rw-r--r-- 1 mcc users 4.2K May 18 16:42 GenericPropertiesDefinition.xml
-rw-r--r-- 1 mcc users 6.4K May 18 16:42 GenericPropertiesVerdict.xml
-rw-r--r-- 1 mcc users 4.1K Apr 22 14:29 LTLCardinality.txt
-rw-r--r-- 1 mcc users 26K Apr 22 14:29 LTLCardinality.xml
-rw-r--r-- 1 mcc users 2.3K Apr 22 14:29 LTLFireability.txt
-rw-r--r-- 1 mcc users 16K Apr 22 14:29 LTLFireability.xml
-rw-r--r-- 1 mcc users 17K Apr 13 03:10 ReachabilityCardinality.txt
-rw-r--r-- 1 mcc users 162K Apr 13 03:10 ReachabilityCardinality.xml
-rw-r--r-- 1 mcc users 9.7K Apr 13 00:35 ReachabilityFireability.txt
-rw-r--r-- 1 mcc users 75K Apr 13 00:35 ReachabilityFireability.xml
-rw-r--r-- 1 mcc users 1.7K Apr 22 14:29 UpperBounds.txt
-rw-r--r-- 1 mcc users 3.7K Apr 22 14:29 UpperBounds.xml
-rw-r--r-- 1 mcc users 5 May 18 16:42 equiv_pt
-rw-r--r-- 1 mcc users 4 May 18 16:42 instance
-rw-r--r-- 1 mcc users 5 May 18 16:42 iscolored
-rw-r--r-- 1 mcc users 201K May 18 16:42 model.pnml
--------------------
content from stdout:
=== Data for post analysis generated by BenchKit (invocation template)
The expected result is a vector of booleans
BOOL_VECTOR
here is the order used to build the result vector(from text file)
FORMULA_NAME BART-COL-030-LTLFireability-00
FORMULA_NAME BART-COL-030-LTLFireability-01
FORMULA_NAME BART-COL-030-LTLFireability-02
FORMULA_NAME BART-COL-030-LTLFireability-03
FORMULA_NAME BART-COL-030-LTLFireability-04
FORMULA_NAME BART-COL-030-LTLFireability-05
FORMULA_NAME BART-COL-030-LTLFireability-06
FORMULA_NAME BART-COL-030-LTLFireability-07
FORMULA_NAME BART-COL-030-LTLFireability-08
FORMULA_NAME BART-COL-030-LTLFireability-09
FORMULA_NAME BART-COL-030-LTLFireability-10
FORMULA_NAME BART-COL-030-LTLFireability-11
FORMULA_NAME BART-COL-030-LTLFireability-12
FORMULA_NAME BART-COL-030-LTLFireability-13
FORMULA_NAME BART-COL-030-LTLFireability-14
FORMULA_NAME BART-COL-030-LTLFireability-15
=== Now, execution of the tool begins
BK_START 1716499474455
tapaal
Got BK_BIN_PATH=/home/mcc/BenchKit/bin/
---> tapaal --- TAPAAL - v2.2024
Setting MODEL_PATH=.
Setting VERIFYPN=/home/mcc/BenchKit/bin/verifypn
Got BK_TIME_CONFINEMENT=3600
Setting TEMPDIR=/home/mcc/BenchKit/bin/tmp
Got BK_MEMORY_CONFINEMENT=16384
Limiting to 16265216 kB
Total timeout: 3590
Time left: 3590
*************************************
* TAPAAL verifying LTLFireability *
*************************************
TEMPDIR=/home/mcc/BenchKit/bin/tmp
QF=/home/mcc/BenchKit/bin/tmp/tmp.gfOH3Fiagh
MF=/home/mcc/BenchKit/bin/tmp/tmp.GhBUyQlYGx
Time left: 3590
---------------------------------------------------
Step -1: Stripping Colors
---------------------------------------------------
Verifying stripped models (16 in total)
Time left: 3590
---------------------------------------------------
Step 0: Parallel Simplification
---------------------------------------------------
Doing parallel simplification (16 in total)
Total simplification timout is 718 -- reduction timeout is 299
timeout 1017 /home/mcc/BenchKit/bin/verifypn -n -ltl -q 718 -l 29 -d 299 -z 4 -s OverApprox --binary-query-io 2 --write-simplified /home/mcc/BenchKit/bin/tmp/tmp.gfOH3Fiagh --write-reduced /home/mcc/BenchKit/bin/tmp/tmp.GhBUyQlYGx -x 1,2,3,4,5,6,7,8,9,10,11,12,13,14,15,16 ./model.pnml ./LTLFireability.xml
FORMULA BART-COL-030-LTLFireability-00 TRUE TECHNIQUES COLLATERAL_PROCESSING STRUCTURAL_REDUCTION QUERY_REDUCTION SAT_SMT LP_APPROX UNFOLDING_TO_PT
Query index 0 was solved
Query is satisfied.
FORMULA BART-COL-030-LTLFireability-03 FALSE TECHNIQUES COLLATERAL_PROCESSING STRUCTURAL_REDUCTION QUERY_REDUCTION SAT_SMT LP_APPROX UNFOLDING_TO_PT
Query index 3 was solved
Query is NOT satisfied.
FORMULA BART-COL-030-LTLFireability-04 FALSE TECHNIQUES COLLATERAL_PROCESSING STRUCTURAL_REDUCTION QUERY_REDUCTION SAT_SMT LP_APPROX UNFOLDING_TO_PT
Query index 4 was solved
Query is NOT satisfied.
Solution found by parallel simplification (step 0)
Solution found by parallel simplification (step 0)
Solution found by parallel simplification (step 0)
Time left: 3435
---------------------------------------------------
Step 1: Parallel processing
---------------------------------------------------
Doing parallel verification of individual queries (13 in total)
Each query is verified by 4 parallel strategies for 299 seconds
------------------- QUERY 1 ----------------------
Solution found by parallel processing (step 1)
Query index 0 was solved
Query is NOT satisfied.
Spent 0.090074 on verification
@@@0.40,157856@@@
parallel: This job succeeded:
eval /usr/bin/time -f "@@@%e,%M@@@" /home/mcc/BenchKit/bin/verifypn -n '-ltl tarjan --ltl-heur dist -q 0 -l 0 -d 119' /home/mcc/BenchKit/bin/tmp/tmp.GhBUyQlYGx /home/mcc/BenchKit/bin/tmp/tmp.gfOH3Fiagh --binary-query-io 1 -x 1 -n
FORMULA BART-COL-030-LTLFireability-08 FALSE TECHNIQUES EXPLICIT TARJAN WEAK_SKIP STUBBORN AUT_STUB HEURISTIC DIST_HEUR OPTIM-1
Time left: 3434
------------------- QUERY 2 ----------------------
Solution found by parallel processing (step 1)
Query index 0 was solved
Query is satisfied.
Spent 0.005647 on verification
@@@0.30,29908@@@
parallel: This job succeeded:
eval /usr/bin/time -f "@@@%e,%M@@@" /home/mcc/BenchKit/bin/verifypn -n '-ltl ndfs -q 0 -l 0 -d 119' /home/mcc/BenchKit/bin/tmp/tmp.GhBUyQlYGx /home/mcc/BenchKit/bin/tmp/tmp.gfOH3Fiagh --binary-query-io 1 -x 2 -n
FORMULA BART-COL-030-LTLFireability-11 TRUE TECHNIQUES EXPLICIT NDFS WEAK_SKIP HEURISTIC AUTOMATON_HEUR OPTIM-1
Time left: 3433
------------------- QUERY 3 ----------------------
Solution found by parallel processing (step 1)
Query index 0 was solved
Query is NOT satisfied.
Spent 0.063448 on verification
@@@0.71,157756@@@
parallel: This job succeeded:
eval /usr/bin/time -f "@@@%e,%M@@@" /home/mcc/BenchKit/bin/verifypn -n '-ltl tarjan --ltl-heur fire-count -q 0 -l 0 -d 119' /home/mcc/BenchKit/bin/tmp/tmp.GhBUyQlYGx /home/mcc/BenchKit/bin/tmp/tmp.gfOH3Fiagh --binary-query-io 1 -x 3 -n
FORMULA BART-COL-030-LTLFireability-02 FALSE TECHNIQUES EXPLICIT TARJAN WEAK_SKIP STUBBORN AUT_STUB HEURISTIC LOGFIRECOUNT_HEUR(5000) OPTIM-1
Time left: 3432
------------------- QUERY 4 ----------------------
Solution found by parallel processing (step 1)
Query index 0 was solved
Query is NOT satisfied.
Spent 0.062689 on verification
@@@0.66,157796@@@
parallel: This job succeeded:
eval /usr/bin/time -f "@@@%e,%M@@@" /home/mcc/BenchKit/bin/verifypn -n '-ltl tarjan --ltl-heur aut -s DFS -p -q 0 -l 0 -d 119' /home/mcc/BenchKit/bin/tmp/tmp.GhBUyQlYGx /home/mcc/BenchKit/bin/tmp/tmp.gfOH3Fiagh --binary-query-io 1 -x 4 -n
FORMULA BART-COL-030-LTLFireability-15 FALSE TECHNIQUES EXPLICIT TARJAN WEAK_SKIP OPTIM-1
Time left: 3431
------------------- QUERY 5 ----------------------
Solution found by parallel processing (step 1)
Query index 0 was solved
Query is NOT satisfied.
Spent 0.038413 on verification
@@@0.21,30016@@@
parallel: This job succeeded:
eval /usr/bin/time -f "@@@%e,%M@@@" /home/mcc/BenchKit/bin/verifypn -n '-ltl ndfs -q 0 -l 0 -d 119' /home/mcc/BenchKit/bin/tmp/tmp.GhBUyQlYGx /home/mcc/BenchKit/bin/tmp/tmp.gfOH3Fiagh --binary-query-io 1 -x 5 -n
FORMULA BART-COL-030-LTLFireability-06 FALSE TECHNIQUES EXPLICIT NDFS WEAK_SKIP HEURISTIC AUTOMATON_HEUR OPTIM-1
Time left: 3431
------------------- QUERY 6 ----------------------
Solution found by parallel processing (step 1)
Query index 0 was solved
Query is satisfied.
Spent 1.05522 on verification
@@@1.27,158080@@@
parallel: This job succeeded:
eval /usr/bin/time -f "@@@%e,%M@@@" /home/mcc/BenchKit/bin/verifypn -n '-ltl tarjan --ltl-heur aut -s DFS -p -q 0 -l 0 -d 119' /home/mcc/BenchKit/bin/tmp/tmp.GhBUyQlYGx /home/mcc/BenchKit/bin/tmp/tmp.gfOH3Fiagh --binary-query-io 1 -x 6 -n
FORMULA BART-COL-030-LTLFireability-12 TRUE TECHNIQUES EXPLICIT TARJAN WEAK_SKIP OPTIM-1
Time left: 3429
------------------- QUERY 7 ----------------------
Solution found by parallel processing (step 1)
Query index 0 was solved
Query is NOT satisfied.
Spent 0.070616 on verification
@@@0.26,157724@@@
parallel: This job succeeded:
eval /usr/bin/time -f "@@@%e,%M@@@" /home/mcc/BenchKit/bin/verifypn -n '-ltl tarjan --ltl-heur aut -s DFS -p -q 0 -l 0 -d 119' /home/mcc/BenchKit/bin/tmp/tmp.GhBUyQlYGx /home/mcc/BenchKit/bin/tmp/tmp.gfOH3Fiagh --binary-query-io 1 -x 7 -n
FORMULA BART-COL-030-LTLFireability-09 FALSE TECHNIQUES EXPLICIT TARJAN WEAK_SKIP OPTIM-1
Time left: 3429
------------------- QUERY 8 ----------------------
Solution found by parallel processing (step 1)
Query index 0 was solved
Query is NOT satisfied.
Spent 0.062991 on verification
@@@0.25,157672@@@
parallel: This job succeeded:
eval /usr/bin/time -f "@@@%e,%M@@@" /home/mcc/BenchKit/bin/verifypn -n '-ltl tarjan --ltl-heur aut -s DFS -p -q 0 -l 0 -d 119' /home/mcc/BenchKit/bin/tmp/tmp.GhBUyQlYGx /home/mcc/BenchKit/bin/tmp/tmp.gfOH3Fiagh --binary-query-io 1 -x 8 -n
FORMULA BART-COL-030-LTLFireability-13 FALSE TECHNIQUES EXPLICIT TARJAN WEAK_SKIP OPTIM-1
Time left: 3428
------------------- QUERY 9 ----------------------
Solution found by parallel processing (step 1)
Query index 0 was solved
Query is NOT satisfied.
Spent 0.069179 on verification
@@@0.27,158172@@@
parallel: This job succeeded:
eval /usr/bin/time -f "@@@%e,%M@@@" /home/mcc/BenchKit/bin/verifypn -n '-ltl tarjan --ltl-heur aut -s DFS -p -q 0 -l 0 -d 119' /home/mcc/BenchKit/bin/tmp/tmp.GhBUyQlYGx /home/mcc/BenchKit/bin/tmp/tmp.gfOH3Fiagh --binary-query-io 1 -x 9 -n
FORMULA BART-COL-030-LTLFireability-10 FALSE TECHNIQUES EXPLICIT TARJAN WEAK_SKIP OPTIM-1
Time left: 3428
------------------- QUERY 10 ----------------------
Solution found by parallel processing (step 1)
Query index 0 was solved
Query is NOT satisfied.
Spent 0.020562 on verification
@@@0.22,30268@@@
parallel: This job succeeded:
eval /usr/bin/time -f "@@@%e,%M@@@" /home/mcc/BenchKit/bin/verifypn -n '-ltl ndfs -q 0 -l 0 -d 119' /home/mcc/BenchKit/bin/tmp/tmp.GhBUyQlYGx /home/mcc/BenchKit/bin/tmp/tmp.gfOH3Fiagh --binary-query-io 1 -x 10 -n
FORMULA BART-COL-030-LTLFireability-05 FALSE TECHNIQUES EXPLICIT NDFS WEAK_SKIP HEURISTIC AUTOMATON_HEUR OPTIM-1
Time left: 3427
------------------- QUERY 11 ----------------------
Solution found by parallel processing (step 1)
Query index 0 was solved
Query is NOT satisfied.
Spent 0.081827 on verification
@@@0.25,157980@@@
parallel: This job succeeded:
eval /usr/bin/time -f "@@@%e,%M@@@" /home/mcc/BenchKit/bin/verifypn -n '-ltl tarjan --ltl-heur aut -s DFS -p -q 0 -l 0 -d 119' /home/mcc/BenchKit/bin/tmp/tmp.GhBUyQlYGx /home/mcc/BenchKit/bin/tmp/tmp.gfOH3Fiagh --binary-query-io 1 -x 11 -n
FORMULA BART-COL-030-LTLFireability-14 FALSE TECHNIQUES EXPLICIT TARJAN WEAK_SKIP OPTIM-1
Time left: 3427
------------------- QUERY 12 ----------------------
Solution found by parallel processing (step 1)
Query index 0 was solved
Query is NOT satisfied.
Spent 0.064743 on verification
@@@0.25,158076@@@
parallel: This job succeeded:
eval /usr/bin/time -f "@@@%e,%M@@@" /home/mcc/BenchKit/bin/verifypn -n '-ltl tarjan --ltl-heur aut -s DFS -p -q 0 -l 0 -d 119' /home/mcc/BenchKit/bin/tmp/tmp.GhBUyQlYGx /home/mcc/BenchKit/bin/tmp/tmp.gfOH3Fiagh --binary-query-io 1 -x 12 -n
FORMULA BART-COL-030-LTLFireability-01 FALSE TECHNIQUES EXPLICIT TARJAN WEAK_SKIP OPTIM-1
Time left: 3426
------------------- QUERY 13 ----------------------
No solution found
parallel: Warning: This job was killed because it timed out:
parallel: Warning: eval /usr/bin/time -f "@@@%e,%M@@@" /home/mcc/BenchKit/bin/verifypn -n '-ltl tarjan --ltl-heur dist -q 0 -l 0 -d 119' /home/mcc/BenchKit/bin/tmp/tmp.GhBUyQlYGx /home/mcc/BenchKit/bin/tmp/tmp.gfOH3Fiagh --binary-query-io 1 -x 13 -n
parallel: Warning: This job was killed because it timed out:
parallel: Warning: eval /usr/bin/time -f "@@@%e,%M@@@" /home/mcc/BenchKit/bin/verifypn -n '-ltl tarjan --ltl-heur fire-count -q 0 -l 0 -d 119' /home/mcc/BenchKit/bin/tmp/tmp.GhBUyQlYGx /home/mcc/BenchKit/bin/tmp/tmp.gfOH3Fiagh --binary-query-io 1 -x 13 -n
parallel: Warning: This job was killed because it timed out:
parallel: Warning: eval /usr/bin/time -f "@@@%e,%M@@@" /home/mcc/BenchKit/bin/verifypn -n '-ltl tarjan --ltl-heur aut -s DFS -p -q 0 -l 0 -d 119' /home/mcc/BenchKit/bin/tmp/tmp.GhBUyQlYGx /home/mcc/BenchKit/bin/tmp/tmp.gfOH3Fiagh --binary-query-io 1 -x 13 -n
parallel: Warning: This job was killed because it timed out:
parallel: Warning: eval /usr/bin/time -f "@@@%e,%M@@@" /home/mcc/BenchKit/bin/verifypn -n '-ltl ndfs -q 0 -l 0 -d 119' /home/mcc/BenchKit/bin/tmp/tmp.GhBUyQlYGx /home/mcc/BenchKit/bin/tmp/tmp.gfOH3Fiagh --binary-query-io 1 -x 13 -n
Time left: 3125
---------------------------------------------------
Step 2: Sequential processing
---------------------------------------------------
Remaining 1 queries are verified sequentially.
Each query is verified for a dynamic timeout (at least 598 seconds)
Time left: 3125
------------------- QUERY 13 ----------------------
Running query 13 for 3125 seconds. Remaining: 1 queries and 3125 seconds
No solution found
parallel: Warning: This job was killed because it timed out:
parallel: Warning: eval /usr/bin/time -f "@@@%e,%M@@@" /home/mcc/BenchKit/bin/verifypn -n '-ltl tarjan -q 40 -l 5 -d 119 -s BestFS --ltl-por automaton --ltl-heur aut' /home/mcc/BenchKit/bin/tmp/tmp.GhBUyQlYGx /home/mcc/BenchKit/bin/tmp/tmp.gfOH3Fiagh --binary-query-io 1 -x 13 -n
Time left: -3
Out of time, terminating!
terminated-with-cleanup
BK_STOP 1716503067163
--------------------
content from stderr:
ERROR: A query could not be translated from CTL* to CTL.
Sequence of Actions to be Executed by the VM
This is useful if one wants to reexecute the tool in the VM from the submitted image disk.
set -x
# this is for BenchKit: configuration of major elements for the test
export BK_INPUT="BART-COL-030"
export BK_EXAMINATION="LTLFireability"
export BK_TOOL="tapaal"
export BK_RESULT_DIR="/tmp/BK_RESULTS/OUTPUTS"
export BK_TIME_CONFINEMENT="3600"
export BK_MEMORY_CONFINEMENT="16384"
export BK_BIN_PATH="/home/mcc/BenchKit/bin/"
# this is specific to your benchmark or test
export BIN_DIR="$HOME/BenchKit/bin"
# remove the execution directoty if it exists (to avoid increse of .vmdk images)
if [ -d execution ] ; then
rm -rf execution
fi
# this is for BenchKit: explicit launching of the test
echo "====================================================================="
echo " Generated by BenchKit 2-5568"
echo " Executing tool tapaal"
echo " Input is BART-COL-030, examination is LTLFireability"
echo " Time confinement is $BK_TIME_CONFINEMENT seconds"
echo " Memory confinement is 16384 MBytes"
echo " Number of cores is 4"
echo " Run identifier is r030-smll-171620172000412"
echo "====================================================================="
echo
echo "--------------------"
echo "preparation of the directory to be used:"
tar xzf /home/mcc/BenchKit/INPUTS/BART-COL-030.tgz
mv BART-COL-030 execution
cd execution
if [ "LTLFireability" = "ReachabilityDeadlock" ] || [ "LTLFireability" = "UpperBounds" ] || [ "LTLFireability" = "QuasiLiveness" ] || [ "LTLFireability" = "StableMarking" ] || [ "LTLFireability" = "Liveness" ] || [ "LTLFireability" = "OneSafe" ] || [ "LTLFireability" = "StateSpace" ]; then
rm -f GenericPropertiesVerdict.xml
fi
pwd
ls -lh
echo
echo "--------------------"
echo "content from stdout:"
echo
echo "=== Data for post analysis generated by BenchKit (invocation template)"
echo
if [ "LTLFireability" = "UpperBounds" ] ; then
echo "The expected result is a vector of positive values"
echo NUM_VECTOR
elif [ "LTLFireability" != "StateSpace" ] ; then
echo "The expected result is a vector of booleans"
echo BOOL_VECTOR
else
echo "no data necessary for post analysis"
fi
echo
if [ -f "LTLFireability.txt" ] ; then
echo "here is the order used to build the result vector(from text file)"
for x in $(grep Property LTLFireability.txt | cut -d ' ' -f 2 | sort -u) ; do
echo "FORMULA_NAME $x"
done
elif [ -f "LTLFireability.xml" ] ; then # for cunf (txt files deleted;-)
echo echo "here is the order used to build the result vector(from xml file)"
for x in $(grep '
echo "FORMULA_NAME $x"
done
elif [ "LTLFireability" = "ReachabilityDeadlock" ] || [ "LTLFireability" = "QuasiLiveness" ] || [ "LTLFireability" = "StableMarking" ] || [ "LTLFireability" = "Liveness" ] || [ "LTLFireability" = "OneSafe" ] ; then
echo "FORMULA_NAME LTLFireability"
fi
echo
echo "=== Now, execution of the tool begins"
echo
echo -n "BK_START "
date -u +%s%3N
echo
timeout -s 9 $BK_TIME_CONFINEMENT bash -c "/home/mcc/BenchKit/BenchKit_head.sh 2> STDERR ; echo ; echo -n \"BK_STOP \" ; date -u +%s%3N"
if [ $? -eq 137 ] ; then
echo
echo "BK_TIME_CONFINEMENT_REACHED"
fi
echo
echo "--------------------"
echo "content from stderr:"
echo
cat STDERR ;