

About the Execution of 2022-gold for PGCD-COL-D02N100
| Execution Summary | |||||
| Max Memory Used (MB) |
Time wait (ms) | CPU Usage (ms) | I/O Wait (ms) | Computed Result | Execution Status |
| 16224.527 | 3592509.00 | 7582942.00 | 9083.50 | FFFF?TTFFFFFFFFF | normal |
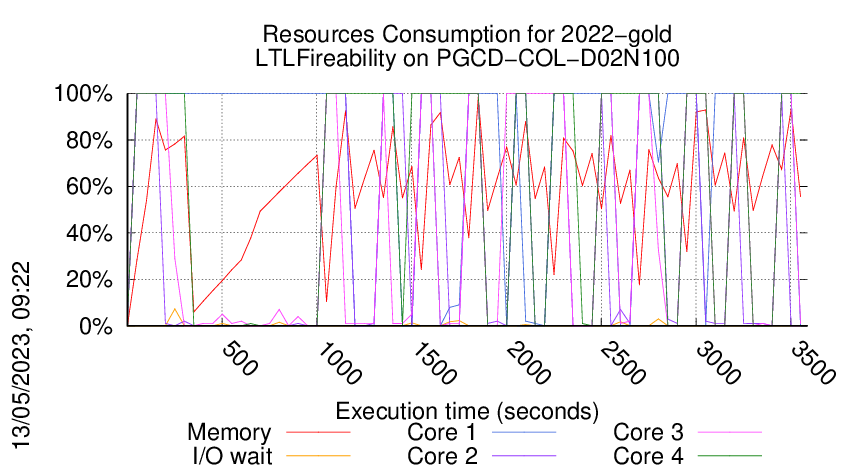
Execution Chart
We display below the execution chart for this examination (boot time has been removed).
Trace from the execution
Formatting '/data/fkordon/mcc2023-input.r542-tall-167987257100298.qcow2', fmt=qcow2 size=4294967296 backing_file=/data/fkordon/mcc2023-input.qcow2 cluster_size=65536 lazy_refcounts=off refcount_bits=16
Waiting for the VM to be ready (probing ssh)
...............
=====================================================================
Generated by BenchKit 2-5348
Executing tool gold2022
Input is PGCD-COL-D02N100, examination is LTLFireability
Time confinement is 3600 seconds
Memory confinement is 16384 MBytes
Number of cores is 4
Run identifier is r542-tall-167987257100298
=====================================================================
--------------------
preparation of the directory to be used:
/home/mcc/execution
total 376K
-rw-r--r-- 1 mcc users 5.8K Mar 23 15:25 CTLCardinality.txt
-rw-r--r-- 1 mcc users 59K Mar 23 15:25 CTLCardinality.xml
-rw-r--r-- 1 mcc users 4.7K Mar 23 15:21 CTLFireability.txt
-rw-r--r-- 1 mcc users 43K Mar 23 15:21 CTLFireability.xml
-rw-r--r-- 1 mcc users 5 Mar 26 22:42 equiv_pt
-rw-r--r-- 1 mcc users 8 Mar 26 22:42 instance
-rw-r--r-- 1 mcc users 5 Mar 26 22:42 iscolored
-rw-r--r-- 1 mcc users 3.3K Apr 7 12:02 LTLCardinality.txt
-rw-r--r-- 1 mcc users 24K Apr 7 12:02 LTLCardinality.xml
-rw-r--r-- 1 mcc users 2.0K Apr 7 12:02 LTLFireability.txt
-rw-r--r-- 1 mcc users 17K Apr 7 12:02 LTLFireability.xml
-rw-r--r-- 1 mcc users 11K Mar 31 16:48 model.pnml
-rw-r--r-- 1 mcc users 1 Mar 26 22:42 NewModel
-rw-r--r-- 1 mcc users 7.5K Mar 23 15:28 ReachabilityCardinality.txt
-rw-r--r-- 1 mcc users 77K Mar 23 15:28 ReachabilityCardinality.xml
-rw-r--r-- 1 mcc users 7.7K Mar 23 15:27 ReachabilityFireability.txt
-rw-r--r-- 1 mcc users 71K Mar 23 15:27 ReachabilityFireability.xml
-rw-r--r-- 1 mcc users 1.6K Apr 7 12:02 UpperBounds.txt
-rw-r--r-- 1 mcc users 3.6K Apr 7 12:02 UpperBounds.xml
--------------------
content from stdout:
=== Data for post analysis generated by BenchKit (invocation template)
The expected result is a vector of booleans
BOOL_VECTOR
here is the order used to build the result vector(from text file)
FORMULA_NAME PGCD-COL-D02N100-LTLFireability-00
FORMULA_NAME PGCD-COL-D02N100-LTLFireability-01
FORMULA_NAME PGCD-COL-D02N100-LTLFireability-02
FORMULA_NAME PGCD-COL-D02N100-LTLFireability-03
FORMULA_NAME PGCD-COL-D02N100-LTLFireability-04
FORMULA_NAME PGCD-COL-D02N100-LTLFireability-05
FORMULA_NAME PGCD-COL-D02N100-LTLFireability-06
FORMULA_NAME PGCD-COL-D02N100-LTLFireability-07
FORMULA_NAME PGCD-COL-D02N100-LTLFireability-08
FORMULA_NAME PGCD-COL-D02N100-LTLFireability-09
FORMULA_NAME PGCD-COL-D02N100-LTLFireability-10
FORMULA_NAME PGCD-COL-D02N100-LTLFireability-11
FORMULA_NAME PGCD-COL-D02N100-LTLFireability-12
FORMULA_NAME PGCD-COL-D02N100-LTLFireability-13
FORMULA_NAME PGCD-COL-D02N100-LTLFireability-14
FORMULA_NAME PGCD-COL-D02N100-LTLFireability-15
=== Now, execution of the tool begins
BK_START 1680945983635
gold2022
Got BK_BIN_PATH=/home/mcc/BenchKit/bin/
---> gold2022 --- TAPAAL v5
Setting MODEL_PATH=.
Setting VERIFYPN=/home/mcc/BenchKit/bin/verifypn
Got BK_TIME_CONFINEMENT=3600
Setting TEMPDIR=/home/mcc/BenchKit/bin/tmp
Got BK_MEMORY_CONFINEMENT=16384
Limiting to 16265216 kB
Total timeout: 3590
Time left: 3590
*************************************
* TAPAAL verifying LTLFireability *
*************************************
TEMPDIR=/home/mcc/BenchKit/bin/tmp
QF=/home/mcc/BenchKit/bin/tmp/tmp.RhzdMRfVOu
MF=/home/mcc/BenchKit/bin/tmp/tmp.xm05ejtDhO
Time left: 3590
---------------------------------------------------
Step -1: Stripping Colors
---------------------------------------------------
Verifying stripped models (16 in total)
/home/mcc/BenchKit/bin/verifypn -n -c -q 718 -ltl -l 29 -d 299 -z 4 -x 1,2,3,4,5,6,7,8,9,10,11,12,13,14,15,16 ./model.pnml ./LTLFireability.xml
Warning: CPN OverApproximation is only available for Reachability queries without deadlock, negated fireability and UpperBounds, skipping PGCD-COL-D02N100-LTLFireability-15
Warning: CPN OverApproximation is only available for Reachability queries without deadlock, negated fireability and UpperBounds, skipping PGCD-COL-D02N100-LTLFireability-14
Warning: CPN OverApproximation is only available for Reachability queries without deadlock, negated fireability and UpperBounds, skipping PGCD-COL-D02N100-LTLFireability-13
Warning: CPN OverApproximation is only available for Reachability queries without deadlock, negated fireability and UpperBounds, skipping PGCD-COL-D02N100-LTLFireability-12
Warning: CPN OverApproximation is only available for Reachability queries without deadlock, negated fireability and UpperBounds, skipping PGCD-COL-D02N100-LTLFireability-11
Warning: CPN OverApproximation is only available for Reachability queries without deadlock, negated fireability and UpperBounds, skipping PGCD-COL-D02N100-LTLFireability-10
Warning: CPN OverApproximation is only available for Reachability queries without deadlock, negated fireability and UpperBounds, skipping PGCD-COL-D02N100-LTLFireability-09
Warning: CPN OverApproximation is only available for Reachability queries without deadlock, negated fireability and UpperBounds, skipping PGCD-COL-D02N100-LTLFireability-08
Warning: CPN OverApproximation is only available for Reachability queries without deadlock, negated fireability and UpperBounds, skipping PGCD-COL-D02N100-LTLFireability-07
Warning: CPN OverApproximation is only available for Reachability queries without deadlock, negated fireability and UpperBounds, skipping PGCD-COL-D02N100-LTLFireability-06
Warning: CPN OverApproximation is only available for Reachability queries without deadlock, negated fireability and UpperBounds, skipping PGCD-COL-D02N100-LTLFireability-05
Warning: CPN OverApproximation is only available for Reachability queries without deadlock, negated fireability and UpperBounds, skipping PGCD-COL-D02N100-LTLFireability-04
Warning: CPN OverApproximation is only available for Reachability queries without deadlock, negated fireability and UpperBounds, skipping PGCD-COL-D02N100-LTLFireability-03
Warning: CPN OverApproximation is only available for Reachability queries without deadlock, negated fireability and UpperBounds, skipping PGCD-COL-D02N100-LTLFireability-02
Warning: CPN OverApproximation is only available for Reachability queries without deadlock, negated fireability and UpperBounds, skipping PGCD-COL-D02N100-LTLFireability-01
Warning: CPN OverApproximation is only available for Reachability queries without deadlock, negated fireability and UpperBounds, skipping PGCD-COL-D02N100-LTLFireability-00
WARNING: Could not run CPN over-approximation on any queries, terminating.
Time left: 3590
---------------------------------------------------
Step 0: Parallel Simplification
---------------------------------------------------
Doing parallel simplification (16 in total)
Total simplification timout is 718 -- reduction timeout is 299
timeout 1017 /home/mcc/BenchKit/bin/verifypn -n -ltl -q 718 -l 29 -d 299 -z 4 -s OverApprox --binary-query-io 2 --write-simplified /home/mcc/BenchKit/bin/tmp/tmp.RhzdMRfVOu --write-reduced /home/mcc/BenchKit/bin/tmp/tmp.xm05ejtDhO -x 1,2,3,4,5,6,7,8,9,10,11,12,13,14,15,16 ./model.pnml ./LTLFireability.xml
FORMULA PGCD-COL-D02N100-LTLFireability-00 FALSE TECHNIQUES COLLATERAL_PROCESSING STRUCTURAL_REDUCTION QUERY_REDUCTION SAT_SMT LP_APPROX UNFOLDING_TO_PT
Query index 0 was solved
Query is NOT satisfied.
FORMULA PGCD-COL-D02N100-LTLFireability-01 FALSE TECHNIQUES COLLATERAL_PROCESSING STRUCTURAL_REDUCTION QUERY_REDUCTION SAT_SMT LP_APPROX UNFOLDING_TO_PT
Query index 1 was solved
Query is NOT satisfied.
FORMULA PGCD-COL-D02N100-LTLFireability-14 FALSE TECHNIQUES COLLATERAL_PROCESSING STRUCTURAL_REDUCTION QUERY_REDUCTION SAT_SMT LP_APPROX UNFOLDING_TO_PT
Query index 14 was solved
Query is NOT satisfied.
Solution found by parallel simplification (step 0)
Solution found by parallel simplification (step 0)
Solution found by parallel simplification (step 0)
Time left: 3590
---------------------------------------------------
Step 1: Parallel processing
---------------------------------------------------
Doing parallel verification of individual queries (13 in total)
Each query is verified by 4 parallel strategies for 299 seconds
------------------- QUERY 1 ----------------------
Solution found by parallel processing (step 1)
Query index 0 was solved
Query is NOT satisfied.
Spent 0.004282 on verification
@@@0.00,7136@@@
parallel: This job succeeded:
eval /usr/bin/time -f "@@@%e,%M@@@" /home/mcc/BenchKit/bin/verifypn -n -ltl\ tarjan\ --ltl-heur\ dist\ -q\ 0\ -l\ 0\ -d\ 119 /home/mcc/BenchKit/bin/tmp/tmp.xm05ejtDhO /home/mcc/BenchKit/bin/tmp/tmp.RhzdMRfVOu --binary-query-io 1 -x 1 -n
FORMULA PGCD-COL-D02N100-LTLFireability-15 FALSE TECHNIQUES COLLATERAL_PROCESSING STRUCTURAL_REDUCTION QUERY_REDUCTION SAT_SMT EXPLICIT STATE_COMPRESSION STUBBORN_SETS
Time left: 3589
------------------- QUERY 2 ----------------------
Solution found by parallel processing (step 1)
Query index 0 was solved
Query is NOT satisfied.
Spent 0.058166 on verification
@@@0.06,148840@@@
parallel: This job succeeded:
eval /usr/bin/time -f "@@@%e,%M@@@" /home/mcc/BenchKit/bin/verifypn -n -ltl\ tarjan\ --ltl-heur\ dist\ -q\ 0\ -l\ 0\ -d\ 119 /home/mcc/BenchKit/bin/tmp/tmp.xm05ejtDhO /home/mcc/BenchKit/bin/tmp/tmp.RhzdMRfVOu --binary-query-io 1 -x 2 -n
FORMULA PGCD-COL-D02N100-LTLFireability-02 FALSE TECHNIQUES EXPLICIT TARJAN WEAK_SKIP STUBBORN AUT_STUB HEURISTIC DIST_HEUR OPTIM-1
Time left: 3589
------------------- QUERY 3 ----------------------
Solution found by parallel processing (step 1)
Query index 0 was solved
Query is NOT satisfied.
Spent 0.015013 on verification
@@@0.01,21716@@@
parallel: This job succeeded:
eval /usr/bin/time -f "@@@%e,%M@@@" /home/mcc/BenchKit/bin/verifypn -n -ltl\ ndfs\ -q\ 0\ -l\ 0\ -d\ 119 /home/mcc/BenchKit/bin/tmp/tmp.xm05ejtDhO /home/mcc/BenchKit/bin/tmp/tmp.RhzdMRfVOu --binary-query-io 1 -x 3 -n
FORMULA PGCD-COL-D02N100-LTLFireability-12 FALSE TECHNIQUES EXPLICIT NDFS WEAK_SKIP HEURISTIC AUTOMATON_HEUR OPTIM-1
Time left: 3589
------------------- QUERY 4 ----------------------
No solution found
Command terminated by signal 9
@@@151.09,6384488@@@
Command terminated by signal 9
@@@216.96,8051452@@@
Time left: 3287
------------------- QUERY 5 ----------------------
Solution found by parallel processing (step 1)
Query index 0 was solved
Query is NOT satisfied.
Spent 0.058199 on verification
@@@0.06,149272@@@
FORMULA PGCD-COL-D02N100-LTLFireability-09 FALSE TECHNIQUES EXPLICIT TARJAN WEAK_SKIP OPTIM-1
Query index 0 was solved
Query is NOT satisfied.
Spent 0.055726 on verification
@@@0.06,148984@@@
FORMULA PGCD-COL-D02N100-LTLFireability-09 FALSE TECHNIQUES EXPLICIT TARJAN WEAK_SKIP STUBBORN AUT_STUB HEURISTIC DIST_HEUR OPTIM-1
Query index 0 was solved
Query is NOT satisfied.
Spent 0.058997 on verification
@@@0.08,149136@@@
parallel: This job succeeded:
eval /usr/bin/time -f "@@@%e,%M@@@" /home/mcc/BenchKit/bin/verifypn -n -ltl\ tarjan\ --ltl-heur\ dist\ -q\ 0\ -l\ 0\ -d\ 119 /home/mcc/BenchKit/bin/tmp/tmp.xm05ejtDhO /home/mcc/BenchKit/bin/tmp/tmp.RhzdMRfVOu --binary-query-io 1 -x 5 -n
parallel: This job succeeded:
eval /usr/bin/time -f "@@@%e,%M@@@" /home/mcc/BenchKit/bin/verifypn -n -ltl\ tarjan\ --ltl-heur\ fire-count\ -q\ 0\ -l\ 0\ -d\ 119 /home/mcc/BenchKit/bin/tmp/tmp.xm05ejtDhO /home/mcc/BenchKit/bin/tmp/tmp.RhzdMRfVOu --binary-query-io 1 -x 5 -n
parallel: This job succeeded:
eval /usr/bin/time -f "@@@%e,%M@@@" /home/mcc/BenchKit/bin/verifypn -n -ltl\ tarjan\ --ltl-heur\ aut\ -s\ DFS\ -p\ -q\ 0\ -l\ 0\ -d\ 119 /home/mcc/BenchKit/bin/tmp/tmp.xm05ejtDhO /home/mcc/BenchKit/bin/tmp/tmp.RhzdMRfVOu --binary-query-io 1 -x 5 -n
FORMULA PGCD-COL-D02N100-LTLFireability-09 FALSE TECHNIQUES EXPLICIT TARJAN WEAK_SKIP STUBBORN AUT_STUB HEURISTIC LOGFIRECOUNT_HEUR(5000) OPTIM-1
Time left: 3287
------------------- QUERY 6 ----------------------
Solution found by parallel processing (step 1)
Query index 0 was solved
Query is NOT satisfied.
Spent 0.016248 on verification
@@@0.02,21232@@@
parallel: This job succeeded:
eval /usr/bin/time -f "@@@%e,%M@@@" /home/mcc/BenchKit/bin/verifypn -n -ltl\ ndfs\ -q\ 0\ -l\ 0\ -d\ 119 /home/mcc/BenchKit/bin/tmp/tmp.xm05ejtDhO /home/mcc/BenchKit/bin/tmp/tmp.RhzdMRfVOu --binary-query-io 1 -x 6 -n
FORMULA PGCD-COL-D02N100-LTLFireability-07 FALSE TECHNIQUES EXPLICIT NDFS WEAK_SKIP HEURISTIC AUTOMATON_HEUR OPTIM-1
Time left: 3287
------------------- QUERY 7 ----------------------
Solution found by parallel processing (step 1)
Query index 0 was solved
Query is NOT satisfied.
Spent 0.053508 on verification
@@@0.05,148856@@@
parallel: This job succeeded:
eval /usr/bin/time -f "@@@%e,%M@@@" /home/mcc/BenchKit/bin/verifypn -n -ltl\ tarjan\ --ltl-heur\ dist\ -q\ 0\ -l\ 0\ -d\ 119 /home/mcc/BenchKit/bin/tmp/tmp.xm05ejtDhO /home/mcc/BenchKit/bin/tmp/tmp.RhzdMRfVOu --binary-query-io 1 -x 7 -n
FORMULA PGCD-COL-D02N100-LTLFireability-08 FALSE TECHNIQUES EXPLICIT TARJAN WEAK_SKIP STUBBORN AUT_STUB HEURISTIC DIST_HEUR OPTIM-1
Time left: 3287
------------------- QUERY 8 ----------------------
Solution found by parallel processing (step 1)
Query index 0 was solved
Query is NOT satisfied.
Spent 0.014606 on verification
@@@0.01,21348@@@
parallel: This job succeeded:
eval /usr/bin/time -f "@@@%e,%M@@@" /home/mcc/BenchKit/bin/verifypn -n -ltl\ ndfs\ -q\ 0\ -l\ 0\ -d\ 119 /home/mcc/BenchKit/bin/tmp/tmp.xm05ejtDhO /home/mcc/BenchKit/bin/tmp/tmp.RhzdMRfVOu --binary-query-io 1 -x 8 -n
FORMULA PGCD-COL-D02N100-LTLFireability-13 FALSE TECHNIQUES EXPLICIT NDFS WEAK_SKIP HEURISTIC AUTOMATON_HEUR OPTIM-1
Time left: 3286
------------------- QUERY 9 ----------------------
Solution found by parallel processing (step 1)
Query index 0 was solved
Query is satisfied.
Spent 0.014853 on verification
@@@0.01,21216@@@
parallel: This job succeeded:
eval /usr/bin/time -f "@@@%e,%M@@@" /home/mcc/BenchKit/bin/verifypn -n -ltl\ ndfs\ -q\ 0\ -l\ 0\ -d\ 119 /home/mcc/BenchKit/bin/tmp/tmp.xm05ejtDhO /home/mcc/BenchKit/bin/tmp/tmp.RhzdMRfVOu --binary-query-io 1 -x 9 -n
FORMULA PGCD-COL-D02N100-LTLFireability-05 TRUE TECHNIQUES EXPLICIT NDFS WEAK_SKIP HEURISTIC AUTOMATON_HEUR OPTIM-1
Time left: 3286
------------------- QUERY 10 ----------------------
Solution found by parallel processing (step 1)
Query index 0 was solved
Query is NOT satisfied.
Spent 0.016599 on verification
@@@0.02,21440@@@
parallel: This job succeeded:
eval /usr/bin/time -f "@@@%e,%M@@@" /home/mcc/BenchKit/bin/verifypn -n -ltl\ ndfs\ -q\ 0\ -l\ 0\ -d\ 119 /home/mcc/BenchKit/bin/tmp/tmp.xm05ejtDhO /home/mcc/BenchKit/bin/tmp/tmp.RhzdMRfVOu --binary-query-io 1 -x 10 -n
FORMULA PGCD-COL-D02N100-LTLFireability-03 FALSE TECHNIQUES EXPLICIT NDFS WEAK_SKIP HEURISTIC AUTOMATON_HEUR OPTIM-1
Time left: 3286
------------------- QUERY 11 ----------------------
Solution found by parallel processing (step 1)
Query index 0 was solved
Query is satisfied.
Spent 0.013024 on verification
@@@0.02,21468@@@
parallel: This job succeeded:
eval /usr/bin/time -f "@@@%e,%M@@@" /home/mcc/BenchKit/bin/verifypn -n -ltl\ ndfs\ -q\ 0\ -l\ 0\ -d\ 119 /home/mcc/BenchKit/bin/tmp/tmp.xm05ejtDhO /home/mcc/BenchKit/bin/tmp/tmp.RhzdMRfVOu --binary-query-io 1 -x 11 -n
FORMULA PGCD-COL-D02N100-LTLFireability-06 TRUE TECHNIQUES EXPLICIT NDFS WEAK_SKIP HEURISTIC AUTOMATON_HEUR OPTIM-1
Time left: 3286
------------------- QUERY 12 ----------------------
Solution found by parallel processing (step 1)
Query index 0 was solved
Query is NOT satisfied.
Spent 0.019549 on verification
@@@0.02,22560@@@
parallel: This job succeeded:
eval /usr/bin/time -f "@@@%e,%M@@@" /home/mcc/BenchKit/bin/verifypn -n -ltl\ ndfs\ -q\ 0\ -l\ 0\ -d\ 119 /home/mcc/BenchKit/bin/tmp/tmp.xm05ejtDhO /home/mcc/BenchKit/bin/tmp/tmp.RhzdMRfVOu --binary-query-io 1 -x 12 -n
FORMULA PGCD-COL-D02N100-LTLFireability-10 FALSE TECHNIQUES EXPLICIT NDFS WEAK_SKIP HEURISTIC AUTOMATON_HEUR OPTIM-1
Time left: 3285
------------------- QUERY 13 ----------------------
Solution found by parallel processing (step 1)
Query index 0 was solved
Query is NOT satisfied.
Spent 0.013663 on verification
@@@0.01,21500@@@
parallel: This job succeeded:
eval /usr/bin/time -f "@@@%e,%M@@@" /home/mcc/BenchKit/bin/verifypn -n -ltl\ ndfs\ -q\ 0\ -l\ 0\ -d\ 119 /home/mcc/BenchKit/bin/tmp/tmp.xm05ejtDhO /home/mcc/BenchKit/bin/tmp/tmp.RhzdMRfVOu --binary-query-io 1 -x 13 -n
FORMULA PGCD-COL-D02N100-LTLFireability-11 FALSE TECHNIQUES EXPLICIT NDFS WEAK_SKIP HEURISTIC AUTOMATON_HEUR OPTIM-1
Time left: 3285
---------------------------------------------------
Step 2: Sequential processing
---------------------------------------------------
Remaining 1 queries are verified sequentially.
Each query is verified for a dynamic timeout (at least 598 seconds)
Time left: 3285
------------------- QUERY 4 ----------------------
Running query 4 for 3285 seconds. Remaining: 1 queries and 3285 seconds
No solution found
terminate called after throwing an instance of 'std::bad_alloc'
what(): std::bad_alloc
Command terminated by signal 6
@@@739.21,12539932@@@
Time left: 2546
Time left: 2546
---------------------------------------------------
Step 4: Random Parallel processing
---------------------------------------------------
Doing random parallel verification of individual queries (1 in total)
Each query is verified by 4 parallel strategies for 2546 seconds
------------------- QUERY 4 ----------------------
No solution found
Command terminated by signal 9
@@@87.80,4494764@@@
Command terminated by signal 9
@@@108.80,6974832@@@
Command terminated by signal 9
@@@139.11,9132456@@@
terminate called after throwing an instance of 'std::bad_alloc'
what(): std::bad_alloc
Command terminated by signal 6
@@@268.03,12713188@@@
Time left: 2277
Time left: 2277
---------------------------------------------------
Step 4: Random Parallel processing
---------------------------------------------------
Doing random parallel verification of individual queries (1 in total)
Each query is verified by 4 parallel strategies for 2277 seconds
------------------- QUERY 4 ----------------------
No solution found
Command terminated by signal 9
@@@74.19,4159208@@@
Command terminated by signal 9
@@@98.79,5931080@@@
Command terminated by signal 9
@@@112.96,8397684@@@
terminate called after throwing an instance of 'std::bad_alloc'
what(): std::bad_alloc
Command terminated by signal 6
@@@223.54,12712744@@@
Time left: 2054
Time left: 2053
---------------------------------------------------
Step 4: Random Parallel processing
---------------------------------------------------
Doing random parallel verification of individual queries (1 in total)
Each query is verified by 4 parallel strategies for 2053 seconds
------------------- QUERY 4 ----------------------
No solution found
Command terminated by signal 9
@@@74.54,4137972@@@
Command terminated by signal 9
@@@99.50,5752340@@@
Command terminated by signal 9
@@@115.93,8288480@@@
terminate called after throwing an instance of 'std::bad_alloc'
what(): std::bad_alloc
Command terminated by signal 6
@@@237.90,12713128@@@
Time left: 1815
Time left: 1815
---------------------------------------------------
Step 4: Random Parallel processing
---------------------------------------------------
Doing random parallel verification of individual queries (1 in total)
Each query is verified by 4 parallel strategies for 1815 seconds
------------------- QUERY 4 ----------------------
No solution found
Command terminated by signal 9
@@@76.32,4106120@@@
Command terminated by signal 9
@@@102.27,5772820@@@
Command terminated by signal 9
@@@112.46,8994516@@@
terminate called after throwing an instance of 'std::bad_alloc'
what(): std::bad_alloc
Command terminated by signal 6
@@@231.63,12713672@@@
Time left: 1583
Time left: 1583
---------------------------------------------------
Step 4: Random Parallel processing
---------------------------------------------------
Doing random parallel verification of individual queries (1 in total)
Each query is verified by 4 parallel strategies for 1583 seconds
------------------- QUERY 4 ----------------------
No solution found
Command terminated by signal 9
@@@76.96,4089008@@@
Command terminated by signal 9
@@@103.66,5640512@@@
Command terminated by signal 9
@@@113.66,8633720@@@
terminate called after throwing an instance of 'std::bad_alloc'
what(): std::bad_alloc
Command terminated by signal 6
@@@230.48,12712244@@@
Time left: 1353
Time left: 1353
---------------------------------------------------
Step 4: Random Parallel processing
---------------------------------------------------
Doing random parallel verification of individual queries (1 in total)
Each query is verified by 4 parallel strategies for 1353 seconds
------------------- QUERY 4 ----------------------
No solution found
Command terminated by signal 9
@@@80.05,4285600@@@
Command terminated by signal 9
@@@103.92,6350992@@@
Command terminated by signal 9
@@@125.92,8106176@@@
terminate called after throwing an instance of 'std::bad_alloc'
what(): std::bad_alloc
Command terminated by signal 6
@@@228.44,12712964@@@
Time left: 1124
Time left: 1124
---------------------------------------------------
Step 4: Random Parallel processing
---------------------------------------------------
Doing random parallel verification of individual queries (1 in total)
Each query is verified by 4 parallel strategies for 1124 seconds
------------------- QUERY 4 ----------------------
No solution found
Command terminated by signal 9
@@@75.40,4182580@@@
Command terminated by signal 9
@@@100.17,6038708@@@
Command terminated by signal 9
@@@111.76,8830360@@@
terminate called after throwing an instance of 'std::bad_alloc'
what(): std::bad_alloc
Command terminated by signal 6
@@@225.04,12712040@@@
Time left: 899
Time left: 898
---------------------------------------------------
Step 4: Random Parallel processing
---------------------------------------------------
Doing random parallel verification of individual queries (1 in total)
Each query is verified by 4 parallel strategies for 898 seconds
------------------- QUERY 4 ----------------------
No solution found
Command terminated by signal 9
@@@82.93,4660512@@@
Command terminated by signal 9
@@@108.94,5910384@@@
Command terminated by signal 9
@@@129.44,9130268@@@
terminate called after throwing an instance of 'std::bad_alloc'
what(): std::bad_alloc
Command terminated by signal 6
@@@239.35,12712840@@@
Time left: 659
Time left: 659
---------------------------------------------------
Step 4: Random Parallel processing
---------------------------------------------------
Doing random parallel verification of individual queries (1 in total)
Each query is verified by 4 parallel strategies for 659 seconds
------------------- QUERY 4 ----------------------
No solution found
Command terminated by signal 9
@@@76.15,4197216@@@
Command terminated by signal 9
@@@98.69,5867804@@@
Command terminated by signal 9
@@@122.40,9132964@@@
terminate called after throwing an instance of 'std::bad_alloc'
what(): std::bad_alloc
Command terminated by signal 6
@@@233.99,12712408@@@
Time left: 425
Time left: 425
---------------------------------------------------
Step 4: Random Parallel processing
---------------------------------------------------
Doing random parallel verification of individual queries (1 in total)
Each query is verified by 4 parallel strategies for 425 seconds
------------------- QUERY 4 ----------------------
No solution found
Command terminated by signal 9
@@@77.80,4220124@@@
Command terminated by signal 9
@@@107.67,5923408@@@
Command terminated by signal 9
@@@130.28,9132372@@@
terminate called after throwing an instance of 'std::bad_alloc'
what(): std::bad_alloc
Command terminated by signal 6
@@@242.99,12712312@@@
Time left: 181
Time left: 181
---------------------------------------------------
Step 4: Random Parallel processing
---------------------------------------------------
Doing random parallel verification of individual queries (1 in total)
Each query is verified by 4 parallel strategies for 181 seconds
------------------- QUERY 4 ----------------------
No solution found
Command terminated by signal 9
@@@75.93,4158536@@@
Command terminated by signal 9
@@@101.91,5804556@@@
Command terminated by signal 9
@@@111.47,9017640@@@
Time left: -3
Out of time, terminating!
terminated-with-cleanup
BK_STOP 1680949576144
--------------------
content from stderr:
Sequence of Actions to be Executed by the VM
This is useful if one wants to reexecute the tool in the VM from the submitted image disk.
set -x
# this is for BenchKit: configuration of major elements for the test
export BK_INPUT="PGCD-COL-D02N100"
export BK_EXAMINATION="LTLFireability"
export BK_TOOL="gold2022"
export BK_RESULT_DIR="/tmp/BK_RESULTS/OUTPUTS"
export BK_TIME_CONFINEMENT="3600"
export BK_MEMORY_CONFINEMENT="16384"
export BK_BIN_PATH="/home/mcc/BenchKit/bin/"
# this is specific to your benchmark or test
export BIN_DIR="$HOME/BenchKit/bin"
# remove the execution directoty if it exists (to avoid increse of .vmdk images)
if [ -d execution ] ; then
rm -rf execution
fi
# this is for BenchKit: explicit launching of the test
echo "====================================================================="
echo " Generated by BenchKit 2-5348"
echo " Executing tool gold2022"
echo " Input is PGCD-COL-D02N100, examination is LTLFireability"
echo " Time confinement is $BK_TIME_CONFINEMENT seconds"
echo " Memory confinement is 16384 MBytes"
echo " Number of cores is 4"
echo " Run identifier is r542-tall-167987257100298"
echo "====================================================================="
echo
echo "--------------------"
echo "preparation of the directory to be used:"
tar xzf /home/mcc/BenchKit/INPUTS/PGCD-COL-D02N100.tgz
mv PGCD-COL-D02N100 execution
cd execution
if [ "LTLFireability" = "ReachabilityDeadlock" ] || [ "LTLFireability" = "UpperBounds" ] || [ "LTLFireability" = "QuasiLiveness" ] || [ "LTLFireability" = "StableMarking" ] || [ "LTLFireability" = "Liveness" ] || [ "LTLFireability" = "OneSafe" ] || [ "LTLFireability" = "StateSpace" ]; then
rm -f GenericPropertiesVerdict.xml
fi
pwd
ls -lh
echo
echo "--------------------"
echo "content from stdout:"
echo
echo "=== Data for post analysis generated by BenchKit (invocation template)"
echo
if [ "LTLFireability" = "UpperBounds" ] ; then
echo "The expected result is a vector of positive values"
echo NUM_VECTOR
elif [ "LTLFireability" != "StateSpace" ] ; then
echo "The expected result is a vector of booleans"
echo BOOL_VECTOR
else
echo "no data necessary for post analysis"
fi
echo
if [ -f "LTLFireability.txt" ] ; then
echo "here is the order used to build the result vector(from text file)"
for x in $(grep Property LTLFireability.txt | cut -d ' ' -f 2 | sort -u) ; do
echo "FORMULA_NAME $x"
done
elif [ -f "LTLFireability.xml" ] ; then # for cunf (txt files deleted;-)
echo echo "here is the order used to build the result vector(from xml file)"
for x in $(grep '
echo "FORMULA_NAME $x"
done
elif [ "LTLFireability" = "ReachabilityDeadlock" ] || [ "LTLFireability" = "QuasiLiveness" ] || [ "LTLFireability" = "StableMarking" ] || [ "LTLFireability" = "Liveness" ] || [ "LTLFireability" = "OneSafe" ] ; then
echo "FORMULA_NAME LTLFireability"
fi
echo
echo "=== Now, execution of the tool begins"
echo
echo -n "BK_START "
date -u +%s%3N
echo
timeout -s 9 $BK_TIME_CONFINEMENT bash -c "/home/mcc/BenchKit/BenchKit_head.sh 2> STDERR ; echo ; echo -n \"BK_STOP \" ; date -u +%s%3N"
if [ $? -eq 137 ] ; then
echo
echo "BK_TIME_CONFINEMENT_REACHED"
fi
echo
echo "--------------------"
echo "content from stderr:"
echo
cat STDERR ;