

About the Execution of 2022-gold for Kanban-PT-00200
| Execution Summary | |||||
| Max Memory Used (MB) |
Time wait (ms) | CPU Usage (ms) | I/O Wait (ms) | Computed Result | Execution Status |
| 16226.380 | 3593147.00 | 7602984.00 | 17130.90 | ?FFFTFTTTFFT?TTT | normal |
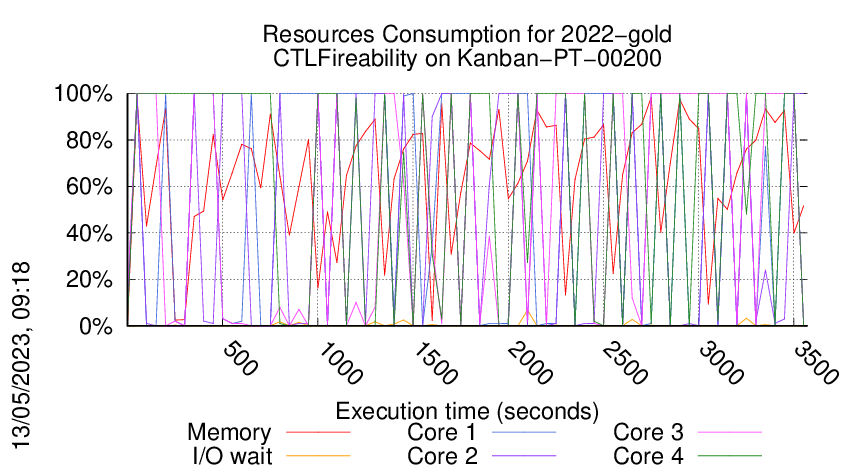
Execution Chart
We display below the execution chart for this examination (boot time has been removed).
Trace from the execution
Formatting '/data/fkordon/mcc2023-input.r254-tall-167856439500206.qcow2', fmt=qcow2 size=4294967296 backing_file=/data/fkordon/mcc2023-input.qcow2 cluster_size=65536 lazy_refcounts=off refcount_bits=16
Waiting for the VM to be ready (probing ssh)
.......................................................
=====================================================================
Generated by BenchKit 2-5348
Executing tool gold2022
Input is Kanban-PT-00200, examination is CTLFireability
Time confinement is 3600 seconds
Memory confinement is 16384 MBytes
Number of cores is 4
Run identifier is r254-tall-167856439500206
=====================================================================
--------------------
preparation of the directory to be used:
/home/mcc/execution
total 508K
-rw-r--r-- 1 mcc users 6.9K Feb 25 11:59 CTLCardinality.txt
-rw-r--r-- 1 mcc users 76K Feb 25 11:59 CTLCardinality.xml
-rw-r--r-- 1 mcc users 4.3K Feb 25 11:58 CTLFireability.txt
-rw-r--r-- 1 mcc users 34K Feb 25 11:58 CTLFireability.xml
-rw-r--r-- 1 mcc users 6 Mar 5 18:22 equiv_col
-rw-r--r-- 1 mcc users 4.2K Jan 29 11:40 GenericPropertiesDefinition.xml
-rw-r--r-- 1 mcc users 6.3K Jan 29 11:40 GenericPropertiesVerdict.xml
-rw-r--r-- 1 mcc users 6 Mar 5 18:22 instance
-rw-r--r-- 1 mcc users 6 Mar 5 18:22 iscolored
-rw-r--r-- 1 mcc users 3.9K Feb 25 16:19 LTLCardinality.txt
-rw-r--r-- 1 mcc users 28K Feb 25 16:19 LTLCardinality.xml
-rw-r--r-- 1 mcc users 2.2K Feb 25 16:19 LTLFireability.txt
-rw-r--r-- 1 mcc users 16K Feb 25 16:19 LTLFireability.xml
-rw-r--r-- 1 mcc users 14K Mar 5 18:22 model.pnml
-rw-r--r-- 1 mcc users 12K Feb 25 12:00 ReachabilityCardinality.txt
-rw-r--r-- 1 mcc users 125K Feb 25 12:00 ReachabilityCardinality.xml
-rw-r--r-- 1 mcc users 14K Feb 25 11:59 ReachabilityFireability.txt
-rw-r--r-- 1 mcc users 119K Feb 25 11:59 ReachabilityFireability.xml
-rw-r--r-- 1 mcc users 1.6K Feb 25 16:19 UpperBounds.txt
-rw-r--r-- 1 mcc users 3.6K Feb 25 16:19 UpperBounds.xml
--------------------
content from stdout:
=== Data for post analysis generated by BenchKit (invocation template)
The expected result is a vector of booleans
BOOL_VECTOR
here is the order used to build the result vector(from text file)
FORMULA_NAME Kanban-PT-00200-CTLFireability-00
FORMULA_NAME Kanban-PT-00200-CTLFireability-01
FORMULA_NAME Kanban-PT-00200-CTLFireability-02
FORMULA_NAME Kanban-PT-00200-CTLFireability-03
FORMULA_NAME Kanban-PT-00200-CTLFireability-04
FORMULA_NAME Kanban-PT-00200-CTLFireability-05
FORMULA_NAME Kanban-PT-00200-CTLFireability-06
FORMULA_NAME Kanban-PT-00200-CTLFireability-07
FORMULA_NAME Kanban-PT-00200-CTLFireability-08
FORMULA_NAME Kanban-PT-00200-CTLFireability-09
FORMULA_NAME Kanban-PT-00200-CTLFireability-10
FORMULA_NAME Kanban-PT-00200-CTLFireability-11
FORMULA_NAME Kanban-PT-00200-CTLFireability-12
FORMULA_NAME Kanban-PT-00200-CTLFireability-13
FORMULA_NAME Kanban-PT-00200-CTLFireability-14
FORMULA_NAME Kanban-PT-00200-CTLFireability-15
=== Now, execution of the tool begins
BK_START 1678688419914
gold2022
Got BK_BIN_PATH=/home/mcc/BenchKit/bin/
---> gold2022 --- TAPAAL v5
Setting MODEL_PATH=.
Setting VERIFYPN=/home/mcc/BenchKit/bin/verifypn
Got BK_TIME_CONFINEMENT=3600
Setting TEMPDIR=/home/mcc/BenchKit/bin/tmp
Got BK_MEMORY_CONFINEMENT=16384
Limiting to 16265216 kB
Total timeout: 3590
Time left: 3590
*************************************
* TAPAAL verifying CTLFireability *
*************************************
TEMPDIR=/home/mcc/BenchKit/bin/tmp
QF=/home/mcc/BenchKit/bin/tmp/tmp.mpkoO3An5q
MF=/home/mcc/BenchKit/bin/tmp/tmp.5D34DSWoMg
Time left: 3589
---------------------------------------------------
Step -1: Stripping Colors
---------------------------------------------------
Verifying stripped models (16 in total)
/home/mcc/BenchKit/bin/verifypn -n -c -q 718 -l 29 -d 299 -z 4 -x 1,2,3,4,5,6,7,8,9,10,11,12,13,14,15,16 ./model.pnml ./CTLFireability.xml
CPN OverApproximation is only usable on colored models
Time left: 3589
---------------------------------------------------
Step 0: Parallel Simplification
---------------------------------------------------
Doing parallel simplification (16 in total)
Total simplification timout is 718 -- reduction timeout is 299
timeout 3589 /home/mcc/BenchKit/bin/verifypn -n -q 718 -l 29 -d 299 -z 4 -s OverApprox --binary-query-io 2 --write-simplified /home/mcc/BenchKit/bin/tmp/tmp.mpkoO3An5q --write-reduced /home/mcc/BenchKit/bin/tmp/tmp.5D34DSWoMg -x 1,2,3,4,5,6,7,8,9,10,11,12,13,14,15,16 ./model.pnml ./CTLFireability.xml
FORMULA Kanban-PT-00200-CTLFireability-09 FALSE TECHNIQUES COLLATERAL_PROCESSING STRUCTURAL_REDUCTION QUERY_REDUCTION SAT_SMT LP_APPROX
Query index 9 was solved
Query is NOT satisfied.
Solution found by parallel simplification (step 0)
Time left: 3589
---------------------------------------------------
Step 1: Parallel processing
---------------------------------------------------
Doing parallel verification of individual queries (15 in total)
Each query is verified by 4 parallel strategies for 299 seconds
------------------- QUERY 1 ----------------------
Solution found by parallel processing (step 1)
Query index 0 was solved
Query is satisfied.
Spent 0.096189 on verification
@@@0.11,59328@@@
Query index 0 was solved
Query is satisfied.
Spent 0.083738 on verification
parallel: This job succeeded:
eval /usr/bin/time -f "@@@%e,%M@@@" /home/mcc/BenchKit/bin/verifypn -n -tar\ -s\ RDFS\ -q\ 0\ -l\ 0\ -d\ 119 /home/mcc/BenchKit/bin/tmp/tmp.5D34DSWoMg /home/mcc/BenchKit/bin/tmp/tmp.mpkoO3An5q --binary-query-io 1 -x 1 -n
@@@0.08,59304@@@
parallel: This job succeeded:
eval /usr/bin/time -f "@@@%e,%M@@@" /home/mcc/BenchKit/bin/verifypn -n -s\ BFS\ -q\ 0\ -l\ 0\ -d\ 119 /home/mcc/BenchKit/bin/tmp/tmp.5D34DSWoMg /home/mcc/BenchKit/bin/tmp/tmp.mpkoO3An5q --binary-query-io 1 -x 1 -n
FORMULA Kanban-PT-00200-CTLFireability-07 TRUE TECHNIQUES COLLATERAL_PROCESSING EXPLICIT STATE_COMPRESSION SAT_SMT STUBBORN_SETS CTL_CZERO
Time left: 3589
------------------- QUERY 2 ----------------------
Solution found by parallel processing (step 1)
@@@0.14,59340@@@
Query index 0 was solved
Query is NOT satisfied.
Spent 0.161166 on verification
@@@0.16,59296@@@
parallel: This job succeeded:
eval /usr/bin/time -f "@@@%e,%M@@@" /home/mcc/BenchKit/bin/verifypn -n -tar\ -s\ RDFS\ -q\ 0\ -l\ 0\ -d\ 119 /home/mcc/BenchKit/bin/tmp/tmp.5D34DSWoMg /home/mcc/BenchKit/bin/tmp/tmp.mpkoO3An5q --binary-query-io 1 -x 2 -n
Query index 0 was solved
Query is NOT satisfied.
Spent 0.145143 on verification
parallel: This job succeeded:
eval /usr/bin/time -f "@@@%e,%M@@@" /home/mcc/BenchKit/bin/verifypn -n -s\ BFS\ -q\ 0\ -l\ 0\ -d\ 119 /home/mcc/BenchKit/bin/tmp/tmp.5D34DSWoMg /home/mcc/BenchKit/bin/tmp/tmp.mpkoO3An5q --binary-query-io 1 -x 2 -n
Query index 0 was solved
Query is NOT satisfied.
Spent 0.057767 on verification
@@@0.12,59240@@@
parallel: This job succeeded:
eval /usr/bin/time -f "@@@%e,%M@@@" /home/mcc/BenchKit/bin/verifypn -n -s\ DFS\ -q\ 0\ -l\ 0\ -d\ 119 /home/mcc/BenchKit/bin/tmp/tmp.5D34DSWoMg /home/mcc/BenchKit/bin/tmp/tmp.mpkoO3An5q --binary-query-io 1 -x 2 -n
FORMULA Kanban-PT-00200-CTLFireability-05 FALSE TECHNIQUES COLLATERAL_PROCESSING EXPLICIT STATE_COMPRESSION SAT_SMT STUBBORN_SETS CTL_CZERO
Time left: 3588
------------------- QUERY 3 ----------------------
No solution found
Command terminated by signal 9
@@@49.82,8043204@@@
Command terminated by signal 9
@@@94.93,9538592@@@
Command terminated by signal 9
@@@211.51,15826580@@@
Time left: 3287
------------------- QUERY 4 ----------------------
Solution found by parallel processing (step 1)
Query index 0 was solved
Query is NOT satisfied.
Spent 4.9215 on verification
@@@4.97,561564@@@
parallel: This job succeeded:
eval /usr/bin/time -f "@@@%e,%M@@@" /home/mcc/BenchKit/bin/verifypn -n -tar\ -s\ RDFS\ -q\ 0\ -l\ 0\ -d\ 119 /home/mcc/BenchKit/bin/tmp/tmp.5D34DSWoMg /home/mcc/BenchKit/bin/tmp/tmp.mpkoO3An5q --binary-query-io 1 -x 4 -n
FORMULA Kanban-PT-00200-CTLFireability-03 FALSE TECHNIQUES COLLATERAL_PROCESSING EXPLICIT STATE_COMPRESSION SAT_SMT STUBBORN_SETS CTL_CZERO
Time left: 3282
------------------- QUERY 5 ----------------------
Solution found by parallel processing (step 1)
Query index 0 was solved
Query is NOT satisfied.
Spent 0.074687 on verification
@@@0.09,59228@@@
parallel: This job succeeded:
eval /usr/bin/time -f "@@@%e,%M@@@" /home/mcc/BenchKit/bin/verifypn -n -tar\ -s\ RDFS\ -q\ 0\ -l\ 0\ -d\ 119 /home/mcc/BenchKit/bin/tmp/tmp.5D34DSWoMg /home/mcc/BenchKit/bin/tmp/tmp.mpkoO3An5q --binary-query-io 1 -x 5 -n
FORMULA Kanban-PT-00200-CTLFireability-10 FALSE TECHNIQUES COLLATERAL_PROCESSING EXPLICIT STATE_COMPRESSION SAT_SMT STUBBORN_SETS CTL_CZERO
Time left: 3281
------------------- QUERY 6 ----------------------
Solution found by parallel processing (step 1)
Query index 0 was solved
Query is NOT satisfied.
Spent 0.057585 on verification
@@@0.06,59572@@@
Query index 0 was solved
Query is NOT satisfied.
Spent 0.07554 on verification
@@@0.07,59588@@@
parallel: This job succeeded:
eval /usr/bin/time -f "@@@%e,%M@@@" /home/mcc/BenchKit/bin/verifypn -n -s\ BestFS\ -q\ 0\ -l\ 0\ -d\ 119 /home/mcc/BenchKit/bin/tmp/tmp.5D34DSWoMg /home/mcc/BenchKit/bin/tmp/tmp.mpkoO3An5q --binary-query-io 1 -x 6 -n
parallel: This job succeeded:
eval /usr/bin/time -f "@@@%e,%M@@@" /home/mcc/BenchKit/bin/verifypn -n -s\ BFS\ -q\ 0\ -l\ 0\ -d\ 119 /home/mcc/BenchKit/bin/tmp/tmp.5D34DSWoMg /home/mcc/BenchKit/bin/tmp/tmp.mpkoO3An5q --binary-query-io 1 -x 6 -n
FORMULA Kanban-PT-00200-CTLFireability-01 FALSE TECHNIQUES COLLATERAL_PROCESSING EXPLICIT STATE_COMPRESSION SAT_SMT STUBBORN_SETS CTL_CZERO
Time left: 3281
------------------- QUERY 7 ----------------------
Solution found by parallel processing (step 1)
Query index 0 was solved
Query is satisfied.
Spent 0.075498 on verification
@@@0.08,59596@@@
parallel: This job succeeded:
eval /usr/bin/time -f "@@@%e,%M@@@" /home/mcc/BenchKit/bin/verifypn -n -s\ DFS\ -q\ 0\ -l\ 0\ -d\ 119 /home/mcc/BenchKit/bin/tmp/tmp.5D34DSWoMg /home/mcc/BenchKit/bin/tmp/tmp.mpkoO3An5q --binary-query-io 1 -x 7 -n
FORMULA Kanban-PT-00200-CTLFireability-14 TRUE TECHNIQUES COLLATERAL_PROCESSING EXPLICIT STATE_COMPRESSION SAT_SMT STUBBORN_SETS CTL_CZERO
Time left: 3281
------------------- QUERY 8 ----------------------
Solution found by parallel processing (step 1)
Query index 0 was solved
Query is satisfied.
Spent 0.058422 on verification
@@@0.06,59492@@@
parallel: This job succeeded:
eval /usr/bin/time -f "@@@%e,%M@@@" /home/mcc/BenchKit/bin/verifypn -n -s\ BestFS\ -q\ 0\ -l\ 0\ -d\ 119 /home/mcc/BenchKit/bin/tmp/tmp.5D34DSWoMg /home/mcc/BenchKit/bin/tmp/tmp.mpkoO3An5q --binary-query-io 1 -x 8 -n
FORMULA Kanban-PT-00200-CTLFireability-06 TRUE TECHNIQUES COLLATERAL_PROCESSING EXPLICIT STATE_COMPRESSION SAT_SMT STUBBORN_SETS CTL_CZERO
Time left: 3280
------------------- QUERY 9 ----------------------
Solution found by parallel processing (step 1)
Query index 0 was solved
Query is satisfied.
Spent 0.108665 on verification
@@@0.12,59508@@@
Query index 0 was solved
Query is satisfied.
Spent 0.109874 on verification
@@@0.11,59712@@@
parallel: This job succeeded:
eval /usr/bin/time -f "@@@%e,%M@@@" /home/mcc/BenchKit/bin/verifypn -n -tar\ -s\ RDFS\ -q\ 0\ -l\ 0\ -d\ 119 /home/mcc/BenchKit/bin/tmp/tmp.5D34DSWoMg /home/mcc/BenchKit/bin/tmp/tmp.mpkoO3An5q --binary-query-io 1 -x 9 -n
Query index 0 was solved
Query is satisfied.
Spent 0.11973 on verification
@@@0.12,59732@@@
parallel: This job succeeded:
eval /usr/bin/time -f "@@@%e,%M@@@" /home/mcc/BenchKit/bin/verifypn -n -s\ BestFS\ -q\ 0\ -l\ 0\ -d\ 119 /home/mcc/BenchKit/bin/tmp/tmp.5D34DSWoMg /home/mcc/BenchKit/bin/tmp/tmp.mpkoO3An5q --binary-query-io 1 -x 9 -n
parallel: This job succeeded:
eval /usr/bin/time -f "@@@%e,%M@@@" /home/mcc/BenchKit/bin/verifypn -n -s\ BFS\ -q\ 0\ -l\ 0\ -d\ 119 /home/mcc/BenchKit/bin/tmp/tmp.5D34DSWoMg /home/mcc/BenchKit/bin/tmp/tmp.mpkoO3An5q --binary-query-io 1 -x 9 -n
Query index 0 was solved
Query is satisfied.
Spent 0.085818 on verification
@@@0.11,59540@@@
parallel: This job succeeded:
eval /usr/bin/time -f "@@@%e,%M@@@" /home/mcc/BenchKit/bin/verifypn -n -s\ DFS\ -q\ 0\ -l\ 0\ -d\ 119 /home/mcc/BenchKit/bin/tmp/tmp.5D34DSWoMg /home/mcc/BenchKit/bin/tmp/tmp.mpkoO3An5q --binary-query-io 1 -x 9 -n
FORMULA Kanban-PT-00200-CTLFireability-04 TRUE TECHNIQUES COLLATERAL_PROCESSING EXPLICIT STATE_COMPRESSION SAT_SMT STUBBORN_SETS CTL_CZERO
Time left: 3280
------------------- QUERY 10 ----------------------
Solution found by parallel processing (step 1)
Query index 0 was solved
Query is satisfied.
Spent 0.060249 on verification
@@@0.06,59428@@@
parallel: This job succeeded:
eval /usr/bin/time -f "@@@%e,%M@@@" /home/mcc/BenchKit/bin/verifypn -n -s\ BFS\ -q\ 0\ -l\ 0\ -d\ 119 /home/mcc/BenchKit/bin/tmp/tmp.5D34DSWoMg /home/mcc/BenchKit/bin/tmp/tmp.mpkoO3An5q --binary-query-io 1 -x 10 -n
FORMULA Kanban-PT-00200-CTLFireability-15 TRUE TECHNIQUES COLLATERAL_PROCESSING EXPLICIT STATE_COMPRESSION SAT_SMT STUBBORN_SETS CTL_CZERO
Time left: 3279
------------------- QUERY 11 ----------------------
Solution found by parallel processing (step 1)
Query index 0 was solved
Query is satisfied.
Spent 0.08529 on verification
@@@0.10,59648@@@
parallel: This job succeeded:
eval /usr/bin/time -f "@@@%e,%M@@@" /home/mcc/BenchKit/bin/verifypn -n -s\ BestFS\ -q\ 0\ -l\ 0\ -d\ 119 /home/mcc/BenchKit/bin/tmp/tmp.5D34DSWoMg /home/mcc/BenchKit/bin/tmp/tmp.mpkoO3An5q --binary-query-io 1 -x 11 -n
FORMULA Kanban-PT-00200-CTLFireability-13 TRUE TECHNIQUES COLLATERAL_PROCESSING EXPLICIT STATE_COMPRESSION SAT_SMT STUBBORN_SETS CTL_CZERO
Time left: 3279
------------------- QUERY 12 ----------------------
Solution found by parallel processing (step 1)
Query index 0 was solved
Query is satisfied.
Spent 0.052747 on verification
@@@0.07,59556@@@
parallel: This job succeeded:
eval /usr/bin/time -f "@@@%e,%M@@@" /home/mcc/BenchKit/bin/verifypn -n -s\ BestFS\ -q\ 0\ -l\ 0\ -d\ 119 /home/mcc/BenchKit/bin/tmp/tmp.5D34DSWoMg /home/mcc/BenchKit/bin/tmp/tmp.mpkoO3An5q --binary-query-io 1 -x 12 -n
FORMULA Kanban-PT-00200-CTLFireability-08 TRUE TECHNIQUES COLLATERAL_PROCESSING EXPLICIT STATE_COMPRESSION SAT_SMT STUBBORN_SETS CTL_CZERO
Time left: 3279
------------------- QUERY 13 ----------------------
Solution found by parallel processing (step 1)
Query index 0 was solved
Query is satisfied.
Spent 0.088129 on verification
@@@0.09,59744@@@
parallel: This job succeeded:
eval /usr/bin/time -f "@@@%e,%M@@@" /home/mcc/BenchKit/bin/verifypn -n -s\ BestFS\ -q\ 0\ -l\ 0\ -d\ 119 /home/mcc/BenchKit/bin/tmp/tmp.5D34DSWoMg /home/mcc/BenchKit/bin/tmp/tmp.mpkoO3An5q --binary-query-io 1 -x 13 -n
FORMULA Kanban-PT-00200-CTLFireability-11 TRUE TECHNIQUES COLLATERAL_PROCESSING EXPLICIT STATE_COMPRESSION SAT_SMT STUBBORN_SETS CTL_CZERO
Time left: 3278
------------------- QUERY 14 ----------------------
Solution found by parallel processing (step 1)
Query index 0 was solved
Query is NOT satisfied.
Spent 0.051078 on verification
@@@0.05,59488@@@
parallel: This job succeeded:
eval /usr/bin/time -f "@@@%e,%M@@@" /home/mcc/BenchKit/bin/verifypn -n -s\ BestFS\ -q\ 0\ -l\ 0\ -d\ 119 /home/mcc/BenchKit/bin/tmp/tmp.5D34DSWoMg /home/mcc/BenchKit/bin/tmp/tmp.mpkoO3An5q --binary-query-io 1 -x 14 -n
FORMULA Kanban-PT-00200-CTLFireability-02 FALSE TECHNIQUES COLLATERAL_PROCESSING EXPLICIT STATE_COMPRESSION SAT_SMT STUBBORN_SETS CTL_CZERO
Time left: 3278
------------------- QUERY 15 ----------------------
No solution found
Command terminated by signal 9
@@@80.99,8978496@@@
Command terminated by signal 9
@@@168.10,8352156@@@
Time left: 2977
---------------------------------------------------
Step 2: Sequential processing
---------------------------------------------------
Remaining 2 queries are verified sequentially.
Each query is verified for a dynamic timeout (at least 598 seconds)
Time left: 2977
------------------- QUERY 3 ----------------------
Running query 3 for 1488 seconds. Remaining: 2 queries and 2977 seconds
No solution found
Command terminated by signal 9
@@@53.07,10393428@@@
Command terminated by signal 9
@@@152.83,16148348@@@
Time left: 2824
------------------- QUERY 15 ----------------------
Running query 15 for 2824 seconds. Remaining: 1 queries and 2824 seconds
No solution found
Command terminated by signal 9
@@@58.87,11772580@@@
Command terminated by signal 9
@@@233.03,16146524@@@
Time left: 2590
Time left: 2590
---------------------------------------------------
Step 4: Random Parallel processing
---------------------------------------------------
Doing random parallel verification of individual queries (2 in total)
Each query is verified by 4 parallel strategies for 1295 seconds
------------------- QUERY 3 ----------------------
No solution found
Command terminated by signal 9
@@@25.76,4755808@@@
Command terminated by signal 9
@@@34.47,6218976@@@
Command terminated by signal 9
@@@51.04,8703244@@@
terminate called after throwing an instance of 'std::bad_alloc'
what(): std::bad_alloc
Command terminated by signal 6
@@@98.23,15890536@@@
Time left: 2492
------------------- QUERY 15 ----------------------
No solution found
Command terminated by signal 9
@@@20.30,4112828@@@
Command terminated by signal 9
@@@27.64,5442732@@@
Command terminated by signal 9
@@@42.22,8146884@@@
terminate called after throwing an instance of 'std::bad_alloc'
what(): std::bad_alloc
Command terminated by signal 6
@@@83.83,15806772@@@
Time left: 2408
Time left: 2408
---------------------------------------------------
Step 4: Random Parallel processing
---------------------------------------------------
Doing random parallel verification of individual queries (2 in total)
Each query is verified by 4 parallel strategies for 1204 seconds
------------------- QUERY 3 ----------------------
No solution found
Command terminated by signal 9
@@@20.24,4139080@@@
Command terminated by signal 9
@@@27.56,5515236@@@
Command terminated by signal 9
@@@42.48,8075692@@@
terminate called after throwing an instance of 'std::bad_alloc'
what(): std::bad_alloc
Command terminated by signal 6
@@@83.67,15890528@@@
Time left: 2324
------------------- QUERY 15 ----------------------
No solution found
Command terminated by signal 9
@@@20.45,4167428@@@
Command terminated by signal 9
@@@27.64,5537756@@@
Command terminated by signal 9
@@@41.82,8097208@@@
terminate called after throwing an instance of 'std::bad_alloc'
what(): std::bad_alloc
Command terminated by signal 6
@@@82.58,15808588@@@
Time left: 2241
Time left: 2241
---------------------------------------------------
Step 4: Random Parallel processing
---------------------------------------------------
Doing random parallel verification of individual queries (2 in total)
Each query is verified by 4 parallel strategies for 1120 seconds
------------------- QUERY 3 ----------------------
No solution found
Command terminated by signal 9
@@@24.14,4119020@@@
Command terminated by signal 9
@@@31.47,5462820@@@
Command terminated by signal 9
@@@45.91,8089064@@@
terminate called after throwing an instance of 'std::bad_alloc'
what(): std::bad_alloc
Command terminated by signal 6
@@@86.54,15890288@@@
Time left: 2154
------------------- QUERY 15 ----------------------
No solution found
Command terminated by signal 9
@@@19.93,4120024@@@
Command terminated by signal 9
@@@42.22,5399672@@@
Command terminated by signal 9
@@@56.95,8115936@@@
terminate called after throwing an instance of 'std::bad_alloc'
what(): std::bad_alloc
Command terminated by signal 6
@@@97.81,15808584@@@
Time left: 2056
Time left: 2056
---------------------------------------------------
Step 4: Random Parallel processing
---------------------------------------------------
Doing random parallel verification of individual queries (2 in total)
Each query is verified by 4 parallel strategies for 1028 seconds
------------------- QUERY 3 ----------------------
No solution found
Command terminated by signal 9
@@@21.09,4312356@@@
Command terminated by signal 9
@@@28.63,5694912@@@
Command terminated by signal 9
@@@43.75,8172452@@@
terminate called after throwing an instance of 'std::bad_alloc'
what(): std::bad_alloc
Command terminated by signal 6
@@@86.08,15890308@@@
Time left: 1969
------------------- QUERY 15 ----------------------
No solution found
Command terminated by signal 9
@@@26.50,5240896@@@
Command terminated by signal 9
@@@35.85,6466516@@@
Command terminated by signal 9
@@@52.36,8216860@@@
terminate called after throwing an instance of 'std::bad_alloc'
what(): std::bad_alloc
Command terminated by signal 6
@@@92.15,15806980@@@
Time left: 1877
Time left: 1877
---------------------------------------------------
Step 4: Random Parallel processing
---------------------------------------------------
Doing random parallel verification of individual queries (2 in total)
Each query is verified by 4 parallel strategies for 938 seconds
------------------- QUERY 3 ----------------------
No solution found
Command terminated by signal 9
@@@25.77,4829036@@@
Command terminated by signal 9
@@@34.40,6381112@@@
Command terminated by signal 9
@@@51.22,8189836@@@
terminate called after throwing an instance of 'std::bad_alloc'
what(): std::bad_alloc
Command terminated by signal 6
@@@92.06,15890392@@@
Time left: 1785
------------------- QUERY 15 ----------------------
No solution found
Command terminated by signal 9
@@@19.95,4100160@@@
Command terminated by signal 9
@@@27.13,5507560@@@
Command terminated by signal 9
@@@41.71,8241796@@@
terminate called after throwing an instance of 'std::bad_alloc'
what(): std::bad_alloc
Command terminated by signal 6
@@@85.22,15808468@@@
Time left: 1699
Time left: 1699
---------------------------------------------------
Step 4: Random Parallel processing
---------------------------------------------------
Doing random parallel verification of individual queries (2 in total)
Each query is verified by 4 parallel strategies for 849 seconds
------------------- QUERY 3 ----------------------
No solution found
Command terminated by signal 9
@@@20.20,4138244@@@
Command terminated by signal 9
@@@27.58,5448196@@@
Command terminated by signal 9
@@@42.15,8267896@@@
terminate called after throwing an instance of 'std::bad_alloc'
what(): std::bad_alloc
Command terminated by signal 6
@@@84.23,15890452@@@
Time left: 1615
------------------- QUERY 15 ----------------------
No solution found
Command terminated by signal 9
@@@20.25,4110828@@@
Command terminated by signal 9
@@@27.53,5451112@@@
Command terminated by signal 9
@@@41.52,8101076@@@
terminate called after throwing an instance of 'std::bad_alloc'
what(): std::bad_alloc
Command terminated by signal 6
@@@80.91,15808668@@@
Time left: 1533
Time left: 1533
---------------------------------------------------
Step 4: Random Parallel processing
---------------------------------------------------
Doing random parallel verification of individual queries (2 in total)
Each query is verified by 4 parallel strategies for 766 seconds
------------------- QUERY 3 ----------------------
No solution found
Command terminated by signal 9
@@@22.49,4479112@@@
Command terminated by signal 9
@@@30.62,5835436@@@
Command terminated by signal 9
@@@46.19,8256572@@@
terminate called after throwing an instance of 'std::bad_alloc'
what(): std::bad_alloc
Command terminated by signal 6
@@@87.34,15890388@@@
Time left: 1446
------------------- QUERY 15 ----------------------
No solution found
Command terminated by signal 9
@@@21.15,4324112@@@
Command terminated by signal 9
@@@28.76,5581620@@@
Command terminated by signal 9
@@@43.71,8345904@@@
terminate called after throwing an instance of 'std::bad_alloc'
what(): std::bad_alloc
Command terminated by signal 6
@@@87.59,15806600@@@
Time left: 1358
Time left: 1358
---------------------------------------------------
Step 4: Random Parallel processing
---------------------------------------------------
Doing random parallel verification of individual queries (2 in total)
Each query is verified by 4 parallel strategies for 679 seconds
------------------- QUERY 3 ----------------------
No solution found
Command terminated by signal 9
@@@20.48,4070816@@@
Command terminated by signal 9
@@@30.45,5397516@@@
Command terminated by signal 9
@@@44.86,8168748@@@
terminate called after throwing an instance of 'std::bad_alloc'
what(): std::bad_alloc
Command terminated by signal 6
@@@86.42,15890392@@@
Time left: 1271
------------------- QUERY 15 ----------------------
No solution found
Command terminated by signal 9
@@@20.34,4080120@@@
Command terminated by signal 9
@@@27.43,5399000@@@
Command terminated by signal 9
@@@41.57,8117708@@@
terminate called after throwing an instance of 'std::bad_alloc'
what(): std::bad_alloc
Command terminated by signal 6
@@@80.18,15807180@@@
Time left: 1191
Time left: 1191
---------------------------------------------------
Step 4: Random Parallel processing
---------------------------------------------------
Doing random parallel verification of individual queries (2 in total)
Each query is verified by 4 parallel strategies for 595 seconds
------------------- QUERY 3 ----------------------
No solution found
Command terminated by signal 9
@@@20.32,4119564@@@
Command terminated by signal 9
@@@29.59,5458968@@@
Command terminated by signal 9
@@@44.24,8094200@@@
terminate called after throwing an instance of 'std::bad_alloc'
what(): std::bad_alloc
Command terminated by signal 6
@@@86.38,15890264@@@
Time left: 1104
------------------- QUERY 15 ----------------------
No solution found
Command terminated by signal 9
@@@19.91,4100592@@@
Command terminated by signal 9
@@@26.95,5423924@@@
Command terminated by signal 9
@@@40.94,8106508@@@
terminate called after throwing an instance of 'std::bad_alloc'
what(): std::bad_alloc
Command terminated by signal 6
@@@80.70,15808452@@@
Time left: 1023
Time left: 1023
---------------------------------------------------
Step 4: Random Parallel processing
---------------------------------------------------
Doing random parallel verification of individual queries (2 in total)
Each query is verified by 4 parallel strategies for 511 seconds
------------------- QUERY 3 ----------------------
No solution found
Command terminated by signal 9
@@@20.44,4081228@@@
Command terminated by signal 9
@@@27.77,5490772@@@
Command terminated by signal 9
@@@41.76,8197804@@@
terminate called after throwing an instance of 'std::bad_alloc'
what(): std::bad_alloc
Command terminated by signal 6
@@@81.98,15890432@@@
Time left: 941
------------------- QUERY 15 ----------------------
No solution found
Command terminated by signal 9
@@@19.69,4091964@@@
Command terminated by signal 9
@@@26.85,5481448@@@
Command terminated by signal 9
@@@41.14,8218544@@@
terminate called after throwing an instance of 'std::bad_alloc'
what(): std::bad_alloc
Command terminated by signal 6
@@@80.91,15808600@@@
Time left: 859
Time left: 859
---------------------------------------------------
Step 4: Random Parallel processing
---------------------------------------------------
Doing random parallel verification of individual queries (2 in total)
Each query is verified by 4 parallel strategies for 429 seconds
------------------- QUERY 3 ----------------------
No solution found
Command terminated by signal 9
@@@20.07,4147828@@@
Command terminated by signal 9
@@@27.41,5503576@@@
Command terminated by signal 9
@@@41.72,8184992@@@
terminate called after throwing an instance of 'std::bad_alloc'
what(): std::bad_alloc
Command terminated by signal 6
@@@82.85,15889984@@@
Time left: 776
------------------- QUERY 15 ----------------------
No solution found
Command terminated by signal 9
@@@20.35,4096068@@@
Command terminated by signal 9
@@@27.48,5452700@@@
Command terminated by signal 9
@@@41.35,8095544@@@
terminate called after throwing an instance of 'std::bad_alloc'
what(): std::bad_alloc
Command terminated by signal 6
@@@80.18,15808488@@@
Time left: 696
Time left: 696
---------------------------------------------------
Step 4: Random Parallel processing
---------------------------------------------------
Doing random parallel verification of individual queries (2 in total)
Each query is verified by 4 parallel strategies for 348 seconds
------------------- QUERY 3 ----------------------
No solution found
Command terminated by signal 9
@@@22.76,4138844@@@
Command terminated by signal 9
@@@29.99,5501508@@@
Command terminated by signal 9
@@@44.55,8321824@@@
terminate called after throwing an instance of 'std::bad_alloc'
what(): std::bad_alloc
Command terminated by signal 6
@@@87.12,15890476@@@
Time left: 608
------------------- QUERY 15 ----------------------
No solution found
Command terminated by signal 9
@@@24.35,4769712@@@
Command terminated by signal 9
@@@32.45,6244300@@@
Command terminated by signal 9
@@@48.83,8152296@@@
terminate called after throwing an instance of 'std::bad_alloc'
what(): std::bad_alloc
Command terminated by signal 6
@@@89.64,15806688@@@
Time left: 519
Time left: 518
---------------------------------------------------
Step 4: Random Parallel processing
---------------------------------------------------
Doing random parallel verification of individual queries (2 in total)
Each query is verified by 4 parallel strategies for 259 seconds
------------------- QUERY 3 ----------------------
No solution found
Command terminated by signal 9
@@@24.60,4580156@@@
Command terminated by signal 9
@@@32.58,5904764@@@
Command terminated by signal 9
@@@47.73,8206408@@@
terminate called after throwing an instance of 'std::bad_alloc'
what(): std::bad_alloc
Command terminated by signal 6
@@@88.80,15890532@@@
Time left: 429
------------------- QUERY 15 ----------------------
No solution found
Command terminated by signal 9
@@@26.75,4680848@@@
Command terminated by signal 9
@@@34.80,5647956@@@
Command terminated by signal 9
@@@49.81,8110620@@@
terminate called after throwing an instance of 'std::bad_alloc'
what(): std::bad_alloc
Command terminated by signal 6
@@@89.79,15807060@@@
Time left: 339
Time left: 339
---------------------------------------------------
Step 4: Random Parallel processing
---------------------------------------------------
Doing random parallel verification of individual queries (2 in total)
Each query is verified by 4 parallel strategies for 169 seconds
------------------- QUERY 3 ----------------------
No solution found
Command terminated by signal 9
@@@22.45,4218656@@@
Command terminated by signal 9
@@@30.21,5581832@@@
Command terminated by signal 9
@@@45.36,8103040@@@
terminate called after throwing an instance of 'std::bad_alloc'
what(): std::bad_alloc
Command terminated by signal 6
@@@90.05,15890624@@@
Time left: 249
------------------- QUERY 15 ----------------------
No solution found
Command terminated by signal 9
@@@26.63,4688972@@@
Command terminated by signal 9
@@@34.90,5519596@@@
Command terminated by signal 9
@@@49.30,8130116@@@
terminate called after throwing an instance of 'std::bad_alloc'
what(): std::bad_alloc
Command terminated by signal 6
@@@91.52,15808444@@@
Time left: 157
Time left: 157
---------------------------------------------------
Step 4: Random Parallel processing
---------------------------------------------------
Doing random parallel verification of individual queries (2 in total)
Each query is verified by 4 parallel strategies for 78 seconds
------------------- QUERY 3 ----------------------
No solution found
Command terminated by signal 9
@@@30.89,5596332@@@
Command terminated by signal 9
@@@44.04,5588952@@@
Command terminated by signal 9
@@@60.79,8182540@@@
Time left: 77
------------------- QUERY 15 ----------------------
No solution found
Command terminated by signal 9
@@@28.02,5394708@@@
Command terminated by signal 9
@@@37.78,7160716@@@
Command terminated by signal 9
@@@58.28,8251384@@@
Time left: -4
Out of time, terminating!
terminated-with-cleanup
BK_STOP 1678692013061
--------------------
content from stderr:
Sequence of Actions to be Executed by the VM
This is useful if one wants to reexecute the tool in the VM from the submitted image disk.
set -x
# this is for BenchKit: configuration of major elements for the test
export BK_INPUT="Kanban-PT-00200"
export BK_EXAMINATION="CTLFireability"
export BK_TOOL="gold2022"
export BK_RESULT_DIR="/tmp/BK_RESULTS/OUTPUTS"
export BK_TIME_CONFINEMENT="3600"
export BK_MEMORY_CONFINEMENT="16384"
export BK_BIN_PATH="/home/mcc/BenchKit/bin/"
# this is specific to your benchmark or test
export BIN_DIR="$HOME/BenchKit/bin"
# remove the execution directoty if it exists (to avoid increse of .vmdk images)
if [ -d execution ] ; then
rm -rf execution
fi
# this is for BenchKit: explicit launching of the test
echo "====================================================================="
echo " Generated by BenchKit 2-5348"
echo " Executing tool gold2022"
echo " Input is Kanban-PT-00200, examination is CTLFireability"
echo " Time confinement is $BK_TIME_CONFINEMENT seconds"
echo " Memory confinement is 16384 MBytes"
echo " Number of cores is 4"
echo " Run identifier is r254-tall-167856439500206"
echo "====================================================================="
echo
echo "--------------------"
echo "preparation of the directory to be used:"
tar xzf /home/mcc/BenchKit/INPUTS/Kanban-PT-00200.tgz
mv Kanban-PT-00200 execution
cd execution
if [ "CTLFireability" = "ReachabilityDeadlock" ] || [ "CTLFireability" = "UpperBounds" ] || [ "CTLFireability" = "QuasiLiveness" ] || [ "CTLFireability" = "StableMarking" ] || [ "CTLFireability" = "Liveness" ] || [ "CTLFireability" = "OneSafe" ] || [ "CTLFireability" = "StateSpace" ]; then
rm -f GenericPropertiesVerdict.xml
fi
pwd
ls -lh
echo
echo "--------------------"
echo "content from stdout:"
echo
echo "=== Data for post analysis generated by BenchKit (invocation template)"
echo
if [ "CTLFireability" = "UpperBounds" ] ; then
echo "The expected result is a vector of positive values"
echo NUM_VECTOR
elif [ "CTLFireability" != "StateSpace" ] ; then
echo "The expected result is a vector of booleans"
echo BOOL_VECTOR
else
echo "no data necessary for post analysis"
fi
echo
if [ -f "CTLFireability.txt" ] ; then
echo "here is the order used to build the result vector(from text file)"
for x in $(grep Property CTLFireability.txt | cut -d ' ' -f 2 | sort -u) ; do
echo "FORMULA_NAME $x"
done
elif [ -f "CTLFireability.xml" ] ; then # for cunf (txt files deleted;-)
echo echo "here is the order used to build the result vector(from xml file)"
for x in $(grep '
echo "FORMULA_NAME $x"
done
elif [ "CTLFireability" = "ReachabilityDeadlock" ] || [ "CTLFireability" = "QuasiLiveness" ] || [ "CTLFireability" = "StableMarking" ] || [ "CTLFireability" = "Liveness" ] || [ "CTLFireability" = "OneSafe" ] ; then
echo "FORMULA_NAME CTLFireability"
fi
echo
echo "=== Now, execution of the tool begins"
echo
echo -n "BK_START "
date -u +%s%3N
echo
timeout -s 9 $BK_TIME_CONFINEMENT bash -c "/home/mcc/BenchKit/BenchKit_head.sh 2> STDERR ; echo ; echo -n \"BK_STOP \" ; date -u +%s%3N"
if [ $? -eq 137 ] ; then
echo
echo "BK_TIME_CONFINEMENT_REACHED"
fi
echo
echo "--------------------"
echo "content from stderr:"
echo
cat STDERR ;