

About the Execution of 2022-gold for JoinFreeModules-PT-0200
| Execution Summary | |||||
| Max Memory Used (MB) |
Time wait (ms) | CPU Usage (ms) | I/O Wait (ms) | Computed Result | Execution Status |
| 16222.892 | 1474037.00 | 3214142.00 | 2424.10 | TFFFFFTFFFFFFFFF | normal |
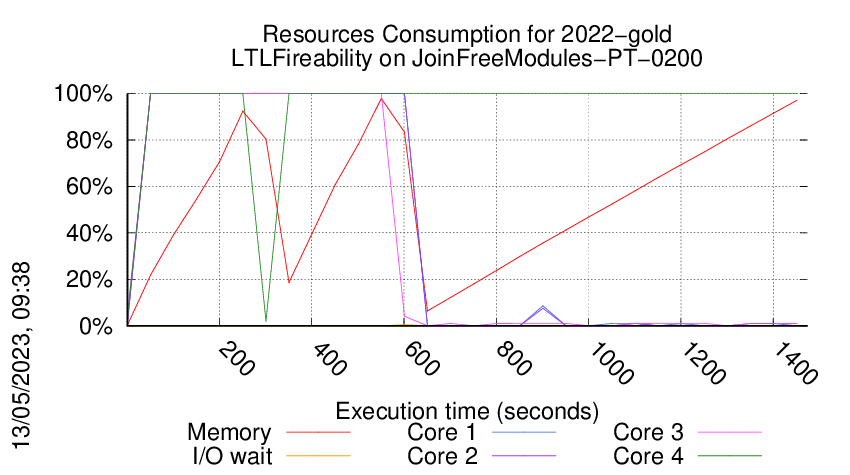
Execution Chart
We display below the execution chart for this examination (boot time has been removed).
Trace from the execution
Formatting '/data/fkordon/mcc2023-input.r254-tall-167856439400148.qcow2', fmt=qcow2 size=4294967296 backing_file=/data/fkordon/mcc2023-input.qcow2 cluster_size=65536 lazy_refcounts=off refcount_bits=16
Waiting for the VM to be ready (probing ssh)
....................................................................................................................................................
=====================================================================
Generated by BenchKit 2-5348
Executing tool gold2022
Input is JoinFreeModules-PT-0200, examination is LTLFireability
Time confinement is 3600 seconds
Memory confinement is 16384 MBytes
Number of cores is 4
Run identifier is r254-tall-167856439400148
=====================================================================
--------------------
preparation of the directory to be used:
/home/mcc/execution
total 992K
-rw-r--r-- 1 mcc users 7.5K Feb 25 11:55 CTLCardinality.txt
-rw-r--r-- 1 mcc users 82K Feb 25 11:55 CTLCardinality.xml
-rw-r--r-- 1 mcc users 5.4K Feb 25 11:55 CTLFireability.txt
-rw-r--r-- 1 mcc users 47K Feb 25 11:55 CTLFireability.xml
-rw-r--r-- 1 mcc users 6 Mar 5 18:22 equiv_col
-rw-r--r-- 1 mcc users 4.2K Jan 29 11:40 GenericPropertiesDefinition.xml
-rw-r--r-- 1 mcc users 6.1K Jan 29 11:40 GenericPropertiesVerdict.xml
-rw-r--r-- 1 mcc users 5 Mar 5 18:22 instance
-rw-r--r-- 1 mcc users 6 Mar 5 18:22 iscolored
-rw-r--r-- 1 mcc users 3.6K Feb 25 16:18 LTLCardinality.txt
-rw-r--r-- 1 mcc users 24K Feb 25 16:18 LTLCardinality.xml
-rw-r--r-- 1 mcc users 2.3K Feb 25 16:18 LTLFireability.txt
-rw-r--r-- 1 mcc users 16K Feb 25 16:18 LTLFireability.xml
-rw-r--r-- 1 mcc users 613K Mar 5 18:22 model.pnml
-rw-r--r-- 1 mcc users 5.7K Feb 25 11:55 ReachabilityCardinality.txt
-rw-r--r-- 1 mcc users 47K Feb 25 11:55 ReachabilityCardinality.xml
-rw-r--r-- 1 mcc users 8.6K Feb 25 11:55 ReachabilityFireability.txt
-rw-r--r-- 1 mcc users 73K Feb 25 11:55 ReachabilityFireability.xml
-rw-r--r-- 1 mcc users 1.7K Feb 25 16:18 UpperBounds.txt
-rw-r--r-- 1 mcc users 3.8K Feb 25 16:18 UpperBounds.xml
--------------------
content from stdout:
=== Data for post analysis generated by BenchKit (invocation template)
The expected result is a vector of booleans
BOOL_VECTOR
here is the order used to build the result vector(from text file)
FORMULA_NAME JoinFreeModules-PT-0200-LTLFireability-00
FORMULA_NAME JoinFreeModules-PT-0200-LTLFireability-01
FORMULA_NAME JoinFreeModules-PT-0200-LTLFireability-02
FORMULA_NAME JoinFreeModules-PT-0200-LTLFireability-03
FORMULA_NAME JoinFreeModules-PT-0200-LTLFireability-04
FORMULA_NAME JoinFreeModules-PT-0200-LTLFireability-05
FORMULA_NAME JoinFreeModules-PT-0200-LTLFireability-06
FORMULA_NAME JoinFreeModules-PT-0200-LTLFireability-07
FORMULA_NAME JoinFreeModules-PT-0200-LTLFireability-08
FORMULA_NAME JoinFreeModules-PT-0200-LTLFireability-09
FORMULA_NAME JoinFreeModules-PT-0200-LTLFireability-10
FORMULA_NAME JoinFreeModules-PT-0200-LTLFireability-11
FORMULA_NAME JoinFreeModules-PT-0200-LTLFireability-12
FORMULA_NAME JoinFreeModules-PT-0200-LTLFireability-13
FORMULA_NAME JoinFreeModules-PT-0200-LTLFireability-14
FORMULA_NAME JoinFreeModules-PT-0200-LTLFireability-15
=== Now, execution of the tool begins
BK_START 1678677870611
gold2022
Got BK_BIN_PATH=/home/mcc/BenchKit/bin/
---> gold2022 --- TAPAAL v5
Setting MODEL_PATH=.
Setting VERIFYPN=/home/mcc/BenchKit/bin/verifypn
Got BK_TIME_CONFINEMENT=3600
Setting TEMPDIR=/home/mcc/BenchKit/bin/tmp
Got BK_MEMORY_CONFINEMENT=16384
Limiting to 16265216 kB
Total timeout: 3590
Time left: 3590
*************************************
* TAPAAL verifying LTLFireability *
*************************************
TEMPDIR=/home/mcc/BenchKit/bin/tmp
QF=/home/mcc/BenchKit/bin/tmp/tmp.acKdPFXdyV
MF=/home/mcc/BenchKit/bin/tmp/tmp.agR2oATdD4
Time left: 3590
---------------------------------------------------
Step -1: Stripping Colors
---------------------------------------------------
Verifying stripped models (16 in total)
/home/mcc/BenchKit/bin/verifypn -n -c -q 718 -ltl -l 29 -d 299 -z 4 -x 1,2,3,4,5,6,7,8,9,10,11,12,13,14,15,16 ./model.pnml ./LTLFireability.xml
CPN OverApproximation is only usable on colored models
Time left: 3590
---------------------------------------------------
Step 0: Parallel Simplification
---------------------------------------------------
Doing parallel simplification (16 in total)
Total simplification timout is 718 -- reduction timeout is 299
timeout 1017 /home/mcc/BenchKit/bin/verifypn -n -ltl -q 718 -l 29 -d 299 -z 4 -s OverApprox --binary-query-io 2 --write-simplified /home/mcc/BenchKit/bin/tmp/tmp.acKdPFXdyV --write-reduced /home/mcc/BenchKit/bin/tmp/tmp.agR2oATdD4 -x 1,2,3,4,5,6,7,8,9,10,11,12,13,14,15,16 ./model.pnml ./LTLFireability.xml
FORMULA JoinFreeModules-PT-0200-LTLFireability-06 TRUE TECHNIQUES COLLATERAL_PROCESSING STRUCTURAL_REDUCTION QUERY_REDUCTION SAT_SMT LP_APPROX
Query index 6 was solved
Query is satisfied.
FORMULA JoinFreeModules-PT-0200-LTLFireability-14 FALSE TECHNIQUES COLLATERAL_PROCESSING STRUCTURAL_REDUCTION QUERY_REDUCTION SAT_SMT LP_APPROX
Query index 14 was solved
Query is NOT satisfied.
Solution found by parallel simplification (step 0)
Solution found by parallel simplification (step 0)
Time left: 3589
---------------------------------------------------
Step 1: Parallel processing
---------------------------------------------------
Doing parallel verification of individual queries (14 in total)
Each query is verified by 4 parallel strategies for 299 seconds
------------------- QUERY 1 ----------------------
Solution found by parallel processing (step 1)
Query index 0 was solved
Query is NOT satisfied.
Spent 0.094104 on verification
@@@0.16,152848@@@
parallel: This job succeeded:
eval /usr/bin/time -f "@@@%e,%M@@@" /home/mcc/BenchKit/bin/verifypn -n -ltl\ tarjan\ --ltl-heur\ aut\ -s\ DFS\ -p\ -q\ 0\ -l\ 0\ -d\ 119 /home/mcc/BenchKit/bin/tmp/tmp.agR2oATdD4 /home/mcc/BenchKit/bin/tmp/tmp.acKdPFXdyV --binary-query-io 1 -x 1 -n
FORMULA JoinFreeModules-PT-0200-LTLFireability-08 FALSE TECHNIQUES EXPLICIT TARJAN WEAK_SKIP OPTIM-1
Time left: 3589
------------------- QUERY 2 ----------------------
Solution found by parallel processing (step 1)
Query index 0 was solved
Query is NOT satisfied.
Spent 0.127288 on verification
@@@0.19,152924@@@
FORMULA JoinFreeModules-PT-0200-LTLFireability-07 FALSE TECHNIQUES EXPLICIT TARJAN WEAK_SKIP STUBBORN AUT_STUB HEURISTIC LOGFIRECOUNT_HEUR(5000) OPTIM-1
Query index 0 was solved
Query is NOT satisfied.
Spent 0.108755 on verification
@@@0.17,152840@@@
parallel: This job succeeded:
eval /usr/bin/time -f "@@@%e,%M@@@" /home/mcc/BenchKit/bin/verifypn -n -ltl\ tarjan\ --ltl-heur\ fire-count\ -q\ 0\ -l\ 0\ -d\ 119 /home/mcc/BenchKit/bin/tmp/tmp.agR2oATdD4 /home/mcc/BenchKit/bin/tmp/tmp.acKdPFXdyV --binary-query-io 1 -x 2 -n
FORMULA JoinFreeModules-PT-0200-LTLFireability-07 FALSE TECHNIQUES EXPLICIT TARJAN WEAK_SKIP STUBBORN AUT_STUB HEURISTIC DIST_HEUR OPTIM-1
Time left: 3588
------------------- QUERY 3 ----------------------
No solution found
Command terminated by signal 9
@@@269.26,4596844@@@
Time left: 3286
------------------- QUERY 4 ----------------------
Solution found by parallel processing (step 1)
Query index 0 was solved
Query is NOT satisfied.
Spent 0.026711 on verification
@@@0.08,25632@@@
parallel: This job succeeded:
eval /usr/bin/time -f "@@@%e,%M@@@" /home/mcc/BenchKit/bin/verifypn -n -ltl\ ndfs\ -q\ 0\ -l\ 0\ -d\ 119 /home/mcc/BenchKit/bin/tmp/tmp.agR2oATdD4 /home/mcc/BenchKit/bin/tmp/tmp.acKdPFXdyV --binary-query-io 1 -x 4 -n
FORMULA JoinFreeModules-PT-0200-LTLFireability-13 FALSE TECHNIQUES EXPLICIT NDFS WEAK_SKIP HEURISTIC AUTOMATON_HEUR OPTIM-1
Time left: 3286
------------------- QUERY 5 ----------------------
Solution found by parallel processing (step 1)
Query index 0 was solved
Query is NOT satisfied.
Spent 0.296196 on verification
@@@0.37,153888@@@
parallel: This job succeeded:
eval /usr/bin/time -f "@@@%e,%M@@@" /home/mcc/BenchKit/bin/verifypn -n -ltl\ tarjan\ --ltl-heur\ dist\ -q\ 0\ -l\ 0\ -d\ 119 /home/mcc/BenchKit/bin/tmp/tmp.agR2oATdD4 /home/mcc/BenchKit/bin/tmp/tmp.acKdPFXdyV --binary-query-io 1 -x 5 -n
FORMULA JoinFreeModules-PT-0200-LTLFireability-01 FALSE TECHNIQUES EXPLICIT TARJAN WEAK_SKIP STUBBORN AUT_STUB HEURISTIC DIST_HEUR OPTIM-1
Time left: 3285
------------------- QUERY 6 ----------------------
Solution found by parallel processing (step 1)
Query index 0 was solved
Query is NOT satisfied.
Spent 0.03916 on verification
@@@0.07,25492@@@
parallel: This job succeeded:
eval /usr/bin/time -f "@@@%e,%M@@@" /home/mcc/BenchKit/bin/verifypn -n -ltl\ ndfs\ -q\ 0\ -l\ 0\ -d\ 119 /home/mcc/BenchKit/bin/tmp/tmp.agR2oATdD4 /home/mcc/BenchKit/bin/tmp/tmp.acKdPFXdyV --binary-query-io 1 -x 6 -n
FORMULA JoinFreeModules-PT-0200-LTLFireability-03 FALSE TECHNIQUES EXPLICIT NDFS WEAK_SKIP HEURISTIC AUTOMATON_HEUR OPTIM-1
Time left: 3285
------------------- QUERY 7 ----------------------
Solution found by parallel processing (step 1)
Query index 0 was solved
Query is NOT satisfied.
Spent 0.056518 on verification
@@@0.11,153108@@@
parallel: This job succeeded:
eval /usr/bin/time -f "@@@%e,%M@@@" /home/mcc/BenchKit/bin/verifypn -n -ltl\ tarjan\ --ltl-heur\ dist\ -q\ 0\ -l\ 0\ -d\ 119 /home/mcc/BenchKit/bin/tmp/tmp.agR2oATdD4 /home/mcc/BenchKit/bin/tmp/tmp.acKdPFXdyV --binary-query-io 1 -x 7 -n
FORMULA JoinFreeModules-PT-0200-LTLFireability-15 FALSE TECHNIQUES EXPLICIT TARJAN WEAK_SKIP STUBBORN AUT_STUB HEURISTIC DIST_HEUR OPTIM-1
Time left: 3284
------------------- QUERY 8 ----------------------
Solution found by parallel processing (step 1)
Query index 0 was solved
Query is NOT satisfied.
Spent 0.02232 on verification
@@@0.05,25488@@@
parallel: This job succeeded:
eval /usr/bin/time -f "@@@%e,%M@@@" /home/mcc/BenchKit/bin/verifypn -n -ltl\ ndfs\ -q\ 0\ -l\ 0\ -d\ 119 /home/mcc/BenchKit/bin/tmp/tmp.agR2oATdD4 /home/mcc/BenchKit/bin/tmp/tmp.acKdPFXdyV --binary-query-io 1 -x 8 -n
FORMULA JoinFreeModules-PT-0200-LTLFireability-05 FALSE TECHNIQUES EXPLICIT NDFS WEAK_SKIP HEURISTIC AUTOMATON_HEUR OPTIM-1
Time left: 3284
------------------- QUERY 9 ----------------------
Solution found by parallel processing (step 1)
Query index 0 was solved
Query is NOT satisfied.
Spent 0.048988 on verification
@@@0.07,153020@@@
parallel: This job succeeded:
eval /usr/bin/time -f "@@@%e,%M@@@" /home/mcc/BenchKit/bin/verifypn -n -ltl\ tarjan\ --ltl-heur\ dist\ -q\ 0\ -l\ 0\ -d\ 119 /home/mcc/BenchKit/bin/tmp/tmp.agR2oATdD4 /home/mcc/BenchKit/bin/tmp/tmp.acKdPFXdyV --binary-query-io 1 -x 9 -n
FORMULA JoinFreeModules-PT-0200-LTLFireability-02 FALSE TECHNIQUES EXPLICIT TARJAN WEAK_SKIP STUBBORN AUT_STUB HEURISTIC DIST_HEUR OPTIM-1
Time left: 3284
------------------- QUERY 10 ----------------------
Solution found by parallel processing (step 1)
Query index 0 was solved
Query is NOT satisfied.
Spent 0.050554 on verification
@@@0.08,152932@@@
parallel: This job succeeded:
eval /usr/bin/time -f "@@@%e,%M@@@" /home/mcc/BenchKit/bin/verifypn -n -ltl\ tarjan\ --ltl-heur\ dist\ -q\ 0\ -l\ 0\ -d\ 119 /home/mcc/BenchKit/bin/tmp/tmp.agR2oATdD4 /home/mcc/BenchKit/bin/tmp/tmp.acKdPFXdyV --binary-query-io 1 -x 10 -n
FORMULA JoinFreeModules-PT-0200-LTLFireability-12 FALSE TECHNIQUES EXPLICIT TARJAN WEAK_SKIP STUBBORN AUT_STUB HEURISTIC DIST_HEUR OPTIM-1
Time left: 3283
------------------- QUERY 11 ----------------------
Solution found by parallel processing (step 1)
Query index 0 was solved
Query is NOT satisfied.
Spent 0.047494 on verification
@@@0.07,152860@@@
parallel: This job succeeded:
eval /usr/bin/time -f "@@@%e,%M@@@" /home/mcc/BenchKit/bin/verifypn -n -ltl\ tarjan\ --ltl-heur\ dist\ -q\ 0\ -l\ 0\ -d\ 119 /home/mcc/BenchKit/bin/tmp/tmp.agR2oATdD4 /home/mcc/BenchKit/bin/tmp/tmp.acKdPFXdyV --binary-query-io 1 -x 11 -n
FORMULA JoinFreeModules-PT-0200-LTLFireability-10 FALSE TECHNIQUES EXPLICIT TARJAN WEAK_SKIP STUBBORN AUT_STUB HEURISTIC DIST_HEUR OPTIM-1
Time left: 3283
------------------- QUERY 12 ----------------------
Solution found by parallel processing (step 1)
Query index 0 was solved
Query is satisfied.
Spent 0.128293 on verification
@@@0.15,152992@@@
parallel: This job succeeded:
eval /usr/bin/time -f "@@@%e,%M@@@" /home/mcc/BenchKit/bin/verifypn -n -ltl\ tarjan\ --ltl-heur\ fire-count\ -q\ 0\ -l\ 0\ -d\ 119 /home/mcc/BenchKit/bin/tmp/tmp.agR2oATdD4 /home/mcc/BenchKit/bin/tmp/tmp.acKdPFXdyV --binary-query-io 1 -x 12 -n
FORMULA JoinFreeModules-PT-0200-LTLFireability-00 TRUE TECHNIQUES EXPLICIT TARJAN WEAK_SKIP STUBBORN AUT_STUB HEURISTIC LOGFIRECOUNT_HEUR(5000) OPTIM-1
Time left: 3283
------------------- QUERY 13 ----------------------
No solution found
Command terminated by signal 9
@@@246.52,4880680@@@
Time left: 2980
------------------- QUERY 14 ----------------------
Solution found by parallel processing (step 1)
Query index 0 was solved
Query is NOT satisfied.
Spent 0.143934 on verification
@@@0.24,152948@@@
parallel: This job succeeded:
eval /usr/bin/time -f "@@@%e,%M@@@" /home/mcc/BenchKit/bin/verifypn -n -ltl\ tarjan\ --ltl-heur\ aut\ -s\ DFS\ -p\ -q\ 0\ -l\ 0\ -d\ 119 /home/mcc/BenchKit/bin/tmp/tmp.agR2oATdD4 /home/mcc/BenchKit/bin/tmp/tmp.acKdPFXdyV --binary-query-io 1 -x 14 -n
FORMULA JoinFreeModules-PT-0200-LTLFireability-09 FALSE TECHNIQUES EXPLICIT TARJAN WEAK_SKIP OPTIM-1
Time left: 2980
---------------------------------------------------
Step 2: Sequential processing
---------------------------------------------------
Remaining 2 queries are verified sequentially.
Each query is verified for a dynamic timeout (at least 598 seconds)
Time left: 2980
------------------- QUERY 3 ----------------------
Running query 3 for 1490 seconds. Remaining: 2 queries and 2980 seconds
No solution found
Command terminated by signal 9
@@@859.90,16147484@@@
Time left: 2120
------------------- QUERY 13 ----------------------
Running query 13 for 2120 seconds. Remaining: 1 queries and 2120 seconds
Solution found by sequential processing (step 2)
FORMULA JoinFreeModules-PT-0200-LTLFireability-04 FALSE TECHNIQUES EXPLICIT TARJAN WEAK_SKIP STUBBORN AUT_STUB HEURISTIC AUTOMATON_HEUR OPTIM-1
Query index 0 was solved
Query is NOT satisfied.
Spent 0.153599 on verification
@@@0.23,155508@@@
parallel: This job succeeded:
eval /usr/bin/time -f "@@@%e,%M@@@" /home/mcc/BenchKit/bin/verifypn -n -ltl\ tarjan\ -q\ 40\ -l\ 5\ -d\ 119\ -s\ BestFS\ --ltl-por\ automaton\ --ltl-heur\ aut /home/mcc/BenchKit/bin/tmp/tmp.agR2oATdD4 /home/mcc/BenchKit/bin/tmp/tmp.acKdPFXdyV --binary-query-io 1 -x 13 -n
FORMULA JoinFreeModules-PT-0200-LTLFireability-04 FALSE TECHNIQUES EXPLICIT TARJAN WEAK_SKIP STUBBORN AUT_STUB HEURISTIC AUTOMATON_HEUR OPTIM-1
Time left: 2119
Time left: 2119
---------------------------------------------------
Step 4: Random Parallel processing
---------------------------------------------------
Doing random parallel verification of individual queries (1 in total)
Each query is verified by 4 parallel strategies for 2119 seconds
------------------- QUERY 3 ----------------------
Solution found in random processing (step 4)
Query index 0 was solved
Query is NOT satisfied.
Spent 3.01827 on verification
@@@3.05,203500@@@
parallel: This job succeeded:
eval /usr/bin/time -f "@@@%e,%M@@@" /home/mcc/BenchKit/bin/verifypn -n -ltl\ tarjan\ -s\ RDFS\ --seed-offset\ 1337\ -p\ -q\ 0\ -l\ 0\ -d\ 119 /home/mcc/BenchKit/bin/tmp/tmp.agR2oATdD4 /home/mcc/BenchKit/bin/tmp/tmp.acKdPFXdyV --binary-query-io 1 -x 3 -n
FORMULA JoinFreeModules-PT-0200-LTLFireability-11 FALSE TECHNIQUES EXPLICIT TARJAN WEAK_SKIP HEURISTIC RANDOM_HEUR OPTIM-1
Time left: 2116
Time left: 2116
All queries are solved
Time left: 2116
terminated-with-cleanup
BK_STOP 1678679344648
--------------------
content from stderr:
Sequence of Actions to be Executed by the VM
This is useful if one wants to reexecute the tool in the VM from the submitted image disk.
set -x
# this is for BenchKit: configuration of major elements for the test
export BK_INPUT="JoinFreeModules-PT-0200"
export BK_EXAMINATION="LTLFireability"
export BK_TOOL="gold2022"
export BK_RESULT_DIR="/tmp/BK_RESULTS/OUTPUTS"
export BK_TIME_CONFINEMENT="3600"
export BK_MEMORY_CONFINEMENT="16384"
export BK_BIN_PATH="/home/mcc/BenchKit/bin/"
# this is specific to your benchmark or test
export BIN_DIR="$HOME/BenchKit/bin"
# remove the execution directoty if it exists (to avoid increse of .vmdk images)
if [ -d execution ] ; then
rm -rf execution
fi
# this is for BenchKit: explicit launching of the test
echo "====================================================================="
echo " Generated by BenchKit 2-5348"
echo " Executing tool gold2022"
echo " Input is JoinFreeModules-PT-0200, examination is LTLFireability"
echo " Time confinement is $BK_TIME_CONFINEMENT seconds"
echo " Memory confinement is 16384 MBytes"
echo " Number of cores is 4"
echo " Run identifier is r254-tall-167856439400148"
echo "====================================================================="
echo
echo "--------------------"
echo "preparation of the directory to be used:"
tar xzf /home/mcc/BenchKit/INPUTS/JoinFreeModules-PT-0200.tgz
mv JoinFreeModules-PT-0200 execution
cd execution
if [ "LTLFireability" = "ReachabilityDeadlock" ] || [ "LTLFireability" = "UpperBounds" ] || [ "LTLFireability" = "QuasiLiveness" ] || [ "LTLFireability" = "StableMarking" ] || [ "LTLFireability" = "Liveness" ] || [ "LTLFireability" = "OneSafe" ] || [ "LTLFireability" = "StateSpace" ]; then
rm -f GenericPropertiesVerdict.xml
fi
pwd
ls -lh
echo
echo "--------------------"
echo "content from stdout:"
echo
echo "=== Data for post analysis generated by BenchKit (invocation template)"
echo
if [ "LTLFireability" = "UpperBounds" ] ; then
echo "The expected result is a vector of positive values"
echo NUM_VECTOR
elif [ "LTLFireability" != "StateSpace" ] ; then
echo "The expected result is a vector of booleans"
echo BOOL_VECTOR
else
echo "no data necessary for post analysis"
fi
echo
if [ -f "LTLFireability.txt" ] ; then
echo "here is the order used to build the result vector(from text file)"
for x in $(grep Property LTLFireability.txt | cut -d ' ' -f 2 | sort -u) ; do
echo "FORMULA_NAME $x"
done
elif [ -f "LTLFireability.xml" ] ; then # for cunf (txt files deleted;-)
echo echo "here is the order used to build the result vector(from xml file)"
for x in $(grep '
echo "FORMULA_NAME $x"
done
elif [ "LTLFireability" = "ReachabilityDeadlock" ] || [ "LTLFireability" = "QuasiLiveness" ] || [ "LTLFireability" = "StableMarking" ] || [ "LTLFireability" = "Liveness" ] || [ "LTLFireability" = "OneSafe" ] ; then
echo "FORMULA_NAME LTLFireability"
fi
echo
echo "=== Now, execution of the tool begins"
echo
echo -n "BK_START "
date -u +%s%3N
echo
timeout -s 9 $BK_TIME_CONFINEMENT bash -c "/home/mcc/BenchKit/BenchKit_head.sh 2> STDERR ; echo ; echo -n \"BK_STOP \" ; date -u +%s%3N"
if [ $? -eq 137 ] ; then
echo
echo "BK_TIME_CONFINEMENT_REACHED"
fi
echo
echo "--------------------"
echo "content from stderr:"
echo
cat STDERR ;