

About the Execution of 2022-gold for FlexibleBarrier-PT-18a
| Execution Summary | |||||
| Max Memory Used (MB) |
Time wait (ms) | CPU Usage (ms) | I/O Wait (ms) | Computed Result | Execution Status |
| 16225.239 | 3592890.00 | 7951238.00 | 9774.60 | FFTFFFFF?FFFFFFF | normal |
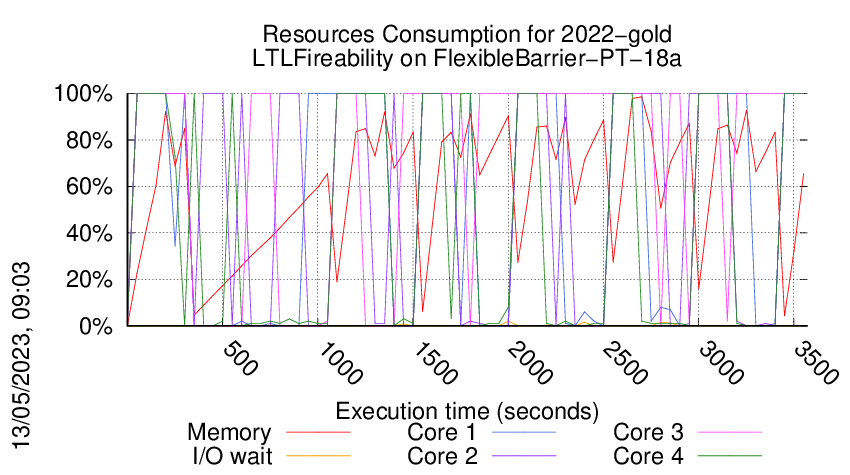
Execution Chart
We display below the execution chart for this examination (boot time has been removed).
Trace from the execution
Formatting '/data/fkordon/mcc2023-input.r190-tall-167838875700418.qcow2', fmt=qcow2 size=4294967296 backing_file=/data/fkordon/mcc2023-input.qcow2 cluster_size=65536 lazy_refcounts=off refcount_bits=16
Waiting for the VM to be ready (probing ssh)
..........................................................................................................................................
=====================================================================
Generated by BenchKit 2-5348
Executing tool gold2022
Input is FlexibleBarrier-PT-18a, examination is LTLFireability
Time confinement is 3600 seconds
Memory confinement is 16384 MBytes
Number of cores is 4
Run identifier is r190-tall-167838875700418
=====================================================================
--------------------
preparation of the directory to be used:
/home/mcc/execution
total 672K
-rw-r--r-- 1 mcc users 7.3K Feb 25 13:09 CTLCardinality.txt
-rw-r--r-- 1 mcc users 74K Feb 25 13:09 CTLCardinality.xml
-rw-r--r-- 1 mcc users 5.4K Feb 25 12:48 CTLFireability.txt
-rw-r--r-- 1 mcc users 49K Feb 25 12:48 CTLFireability.xml
-rw-r--r-- 1 mcc users 6 Mar 5 18:22 equiv_col
-rw-r--r-- 1 mcc users 4.2K Jan 29 11:40 GenericPropertiesDefinition.xml
-rw-r--r-- 1 mcc users 6.5K Jan 29 11:40 GenericPropertiesVerdict.xml
-rw-r--r-- 1 mcc users 4 Mar 5 18:22 instance
-rw-r--r-- 1 mcc users 6 Mar 5 18:22 iscolored
-rw-r--r-- 1 mcc users 3.4K Feb 25 16:07 LTLCardinality.txt
-rw-r--r-- 1 mcc users 23K Feb 25 16:07 LTLCardinality.xml
-rw-r--r-- 1 mcc users 2.3K Feb 25 16:07 LTLFireability.txt
-rw-r--r-- 1 mcc users 16K Feb 25 16:07 LTLFireability.xml
-rw-r--r-- 1 mcc users 265K Mar 5 18:22 model.pnml
-rw-r--r-- 1 mcc users 8.3K Feb 25 13:30 ReachabilityCardinality.txt
-rw-r--r-- 1 mcc users 80K Feb 25 13:30 ReachabilityCardinality.xml
-rw-r--r-- 1 mcc users 8.4K Feb 25 13:21 ReachabilityFireability.txt
-rw-r--r-- 1 mcc users 71K Feb 25 13:21 ReachabilityFireability.xml
-rw-r--r-- 1 mcc users 1.7K Feb 25 16:07 UpperBounds.txt
-rw-r--r-- 1 mcc users 3.7K Feb 25 16:07 UpperBounds.xml
--------------------
content from stdout:
=== Data for post analysis generated by BenchKit (invocation template)
The expected result is a vector of booleans
BOOL_VECTOR
here is the order used to build the result vector(from text file)
FORMULA_NAME FlexibleBarrier-PT-18a-LTLFireability-00
FORMULA_NAME FlexibleBarrier-PT-18a-LTLFireability-01
FORMULA_NAME FlexibleBarrier-PT-18a-LTLFireability-02
FORMULA_NAME FlexibleBarrier-PT-18a-LTLFireability-03
FORMULA_NAME FlexibleBarrier-PT-18a-LTLFireability-04
FORMULA_NAME FlexibleBarrier-PT-18a-LTLFireability-05
FORMULA_NAME FlexibleBarrier-PT-18a-LTLFireability-06
FORMULA_NAME FlexibleBarrier-PT-18a-LTLFireability-07
FORMULA_NAME FlexibleBarrier-PT-18a-LTLFireability-08
FORMULA_NAME FlexibleBarrier-PT-18a-LTLFireability-09
FORMULA_NAME FlexibleBarrier-PT-18a-LTLFireability-10
FORMULA_NAME FlexibleBarrier-PT-18a-LTLFireability-11
FORMULA_NAME FlexibleBarrier-PT-18a-LTLFireability-12
FORMULA_NAME FlexibleBarrier-PT-18a-LTLFireability-13
FORMULA_NAME FlexibleBarrier-PT-18a-LTLFireability-14
FORMULA_NAME FlexibleBarrier-PT-18a-LTLFireability-15
=== Now, execution of the tool begins
BK_START 1678674372494
gold2022
Got BK_BIN_PATH=/home/mcc/BenchKit/bin/
---> gold2022 --- TAPAAL v5
Setting MODEL_PATH=.
Setting VERIFYPN=/home/mcc/BenchKit/bin/verifypn
Got BK_TIME_CONFINEMENT=3600
Setting TEMPDIR=/home/mcc/BenchKit/bin/tmp
Got BK_MEMORY_CONFINEMENT=16384
Limiting to 16265216 kB
Total timeout: 3590
Time left: 3590
*************************************
* TAPAAL verifying LTLFireability *
*************************************
TEMPDIR=/home/mcc/BenchKit/bin/tmp
QF=/home/mcc/BenchKit/bin/tmp/tmp.ZQDnMJbwuK
MF=/home/mcc/BenchKit/bin/tmp/tmp.59RyMQkF8r
Time left: 3590
---------------------------------------------------
Step -1: Stripping Colors
---------------------------------------------------
Verifying stripped models (16 in total)
/home/mcc/BenchKit/bin/verifypn -n -c -q 718 -ltl -l 29 -d 299 -z 4 -x 1,2,3,4,5,6,7,8,9,10,11,12,13,14,15,16 ./model.pnml ./LTLFireability.xml
CPN OverApproximation is only usable on colored models
Time left: 3590
---------------------------------------------------
Step 0: Parallel Simplification
---------------------------------------------------
Doing parallel simplification (16 in total)
Total simplification timout is 718 -- reduction timeout is 299
timeout 1017 /home/mcc/BenchKit/bin/verifypn -n -ltl -q 718 -l 29 -d 299 -z 4 -s OverApprox --binary-query-io 2 --write-simplified /home/mcc/BenchKit/bin/tmp/tmp.ZQDnMJbwuK --write-reduced /home/mcc/BenchKit/bin/tmp/tmp.59RyMQkF8r -x 1,2,3,4,5,6,7,8,9,10,11,12,13,14,15,16 ./model.pnml ./LTLFireability.xml
Time left: 3590
---------------------------------------------------
Step 1: Parallel processing
---------------------------------------------------
Doing parallel verification of individual queries (16 in total)
Each query is verified by 4 parallel strategies for 299 seconds
------------------- QUERY 1 ----------------------
Solution found by parallel processing (step 1)
Query index 0 was solved
Query is NOT satisfied.
Spent 0.001641 on verification
Query index 0 was solved
Query is NOT satisfied.
Spent 0.00112 on verification
@@@0.02,7904@@@
@@@0.01,7820@@@
parallel: This job succeeded:
eval /usr/bin/time -f "@@@%e,%M@@@" /home/mcc/BenchKit/bin/verifypn -n -ltl\ tarjan\ --ltl-heur\ dist\ -q\ 0\ -l\ 0\ -d\ 119 /home/mcc/BenchKit/bin/tmp/tmp.59RyMQkF8r /home/mcc/BenchKit/bin/tmp/tmp.ZQDnMJbwuK --binary-query-io 1 -x 1 -n
parallel: This job succeeded:
eval /usr/bin/time -f "@@@%e,%M@@@" /home/mcc/BenchKit/bin/verifypn -n -ltl\ tarjan\ --ltl-heur\ fire-count\ -q\ 0\ -l\ 0\ -d\ 119 /home/mcc/BenchKit/bin/tmp/tmp.59RyMQkF8r /home/mcc/BenchKit/bin/tmp/tmp.ZQDnMJbwuK --binary-query-io 1 -x 1 -n
FORMULA FlexibleBarrier-PT-18a-LTLFireability-05 FALSE TECHNIQUES COLLATERAL_PROCESSING STRUCTURAL_REDUCTION QUERY_REDUCTION SAT_SMT EXPLICIT STATE_COMPRESSION STUBBORN_SETS
Time left: 3589
------------------- QUERY 2 ----------------------
Solution found by parallel processing (step 1)
Query index 0 was solved
Query is NOT satisfied.
Spent 0.011395 on verification
@@@0.02,22020@@@
parallel: This job succeeded:
eval /usr/bin/time -f "@@@%e,%M@@@" /home/mcc/BenchKit/bin/verifypn -n -ltl\ ndfs\ -q\ 0\ -l\ 0\ -d\ 119 /home/mcc/BenchKit/bin/tmp/tmp.59RyMQkF8r /home/mcc/BenchKit/bin/tmp/tmp.ZQDnMJbwuK --binary-query-io 1 -x 2 -n
FORMULA FlexibleBarrier-PT-18a-LTLFireability-11 FALSE TECHNIQUES EXPLICIT NDFS WEAK_SKIP HEURISTIC AUTOMATON_HEUR OPTIM-1
Time left: 3589
------------------- QUERY 3 ----------------------
Solution found by parallel processing (step 1)
Query index 0 was solved
Query is NOT satisfied.
Spent 0.064071 on verification
@@@0.07,149668@@@
parallel: This job succeeded:
eval /usr/bin/time -f "@@@%e,%M@@@" /home/mcc/BenchKit/bin/verifypn -n -ltl\ tarjan\ --ltl-heur\ dist\ -q\ 0\ -l\ 0\ -d\ 119 /home/mcc/BenchKit/bin/tmp/tmp.59RyMQkF8r /home/mcc/BenchKit/bin/tmp/tmp.ZQDnMJbwuK --binary-query-io 1 -x 3 -n
FORMULA FlexibleBarrier-PT-18a-LTLFireability-10 FALSE TECHNIQUES EXPLICIT TARJAN WEAK_SKIP STUBBORN AUT_STUB HEURISTIC DIST_HEUR OPTIM-1
Time left: 3589
------------------- QUERY 4 ----------------------
Solution found by parallel processing (step 1)
Query index 0 was solved
Query is NOT satisfied.
Spent 0.077826 on verification
@@@0.09,149672@@@
parallel: This job succeeded:
eval /usr/bin/time -f "@@@%e,%M@@@" /home/mcc/BenchKit/bin/verifypn -n -ltl\ tarjan\ --ltl-heur\ dist\ -q\ 0\ -l\ 0\ -d\ 119 /home/mcc/BenchKit/bin/tmp/tmp.59RyMQkF8r /home/mcc/BenchKit/bin/tmp/tmp.ZQDnMJbwuK --binary-query-io 1 -x 4 -n
FORMULA FlexibleBarrier-PT-18a-LTLFireability-15 FALSE TECHNIQUES EXPLICIT TARJAN WEAK_SKIP STUBBORN AUT_STUB HEURISTIC DIST_HEUR OPTIM-1
Time left: 3588
------------------- QUERY 5 ----------------------
Solution found by parallel processing (step 1)
Query index 0 was solved
Query is NOT satisfied.
Spent 0.063634 on verification
@@@0.08,149556@@@
parallel: This job succeeded:
eval /usr/bin/time -f "@@@%e,%M@@@" /home/mcc/BenchKit/bin/verifypn -n -ltl\ tarjan\ --ltl-heur\ fire-count\ -q\ 0\ -l\ 0\ -d\ 119 /home/mcc/BenchKit/bin/tmp/tmp.59RyMQkF8r /home/mcc/BenchKit/bin/tmp/tmp.ZQDnMJbwuK --binary-query-io 1 -x 5 -n
FORMULA FlexibleBarrier-PT-18a-LTLFireability-03 FALSE TECHNIQUES EXPLICIT TARJAN WEAK_SKIP STUBBORN AUT_STUB HEURISTIC LOGFIRECOUNT_HEUR(5000) OPTIM-1
Time left: 3588
------------------- QUERY 6 ----------------------
Solution found by parallel processing (step 1)
Query index 0 was solved
Query is NOT satisfied.
FORMULA FlexibleBarrier-PT-18a-LTLFireability-14 FALSE TECHNIQUES EXPLICIT TARJAN WEAK_SKIP OPTIM-1
Query index 0 was solved
Query is NOT satisfied.
Spent 0.06288 on verification
@@@0.08,150268@@@
parallel: This job succeeded:
eval /usr/bin/time -f "@@@%e,%M@@@" /home/mcc/BenchKit/bin/verifypn -n -ltl\ tarjan\ --ltl-heur\ aut\ -s\ DFS\ -p\ -q\ 0\ -l\ 0\ -d\ 119 /home/mcc/BenchKit/bin/tmp/tmp.59RyMQkF8r /home/mcc/BenchKit/bin/tmp/tmp.ZQDnMJbwuK --binary-query-io 1 -x 6 -n
FORMULA FlexibleBarrier-PT-18a-LTLFireability-14 FALSE TECHNIQUES EXPLICIT TARJAN WEAK_SKIP STUBBORN AUT_STUB HEURISTIC DIST_HEUR OPTIM-1
Time left: 3588
------------------- QUERY 7 ----------------------
Solution found by parallel processing (step 1)
Query index 0 was solved
Query is NOT satisfied.
Spent 0.06855 on verification
@@@0.08,149808@@@
parallel: This job succeeded:
eval /usr/bin/time -f "@@@%e,%M@@@" /home/mcc/BenchKit/bin/verifypn -n -ltl\ tarjan\ --ltl-heur\ fire-count\ -q\ 0\ -l\ 0\ -d\ 119 /home/mcc/BenchKit/bin/tmp/tmp.59RyMQkF8r /home/mcc/BenchKit/bin/tmp/tmp.ZQDnMJbwuK --binary-query-io 1 -x 7 -n
FORMULA FlexibleBarrier-PT-18a-LTLFireability-12 FALSE TECHNIQUES EXPLICIT TARJAN WEAK_SKIP STUBBORN AUT_STUB HEURISTIC LOGFIRECOUNT_HEUR(5000) OPTIM-1
Time left: 3587
------------------- QUERY 8 ----------------------
Solution found by parallel processing (step 1)
Query index 0 was solved
Query is NOT satisfied.
Spent 0.055305 on verification
@@@0.08,149676@@@
parallel: This job succeeded:
eval /usr/bin/time -f "@@@%e,%M@@@" /home/mcc/BenchKit/bin/verifypn -n -ltl\ tarjan\ --ltl-heur\ dist\ -q\ 0\ -l\ 0\ -d\ 119 /home/mcc/BenchKit/bin/tmp/tmp.59RyMQkF8r /home/mcc/BenchKit/bin/tmp/tmp.ZQDnMJbwuK --binary-query-io 1 -x 8 -n
FORMULA FlexibleBarrier-PT-18a-LTLFireability-00 FALSE TECHNIQUES EXPLICIT TARJAN WEAK_SKIP STUBBORN AUT_STUB HEURISTIC DIST_HEUR OPTIM-1
Time left: 3587
------------------- QUERY 9 ----------------------
Solution found by parallel processing (step 1)
Query index 0 was solved
Query is NOT satisfied.
Spent 0.055009 on verification
@@@0.07,149548@@@
parallel: This job succeeded:
eval /usr/bin/time -f "@@@%e,%M@@@" /home/mcc/BenchKit/bin/verifypn -n -ltl\ tarjan\ --ltl-heur\ dist\ -q\ 0\ -l\ 0\ -d\ 119 /home/mcc/BenchKit/bin/tmp/tmp.59RyMQkF8r /home/mcc/BenchKit/bin/tmp/tmp.ZQDnMJbwuK --binary-query-io 1 -x 9 -n
FORMULA FlexibleBarrier-PT-18a-LTLFireability-07 FALSE TECHNIQUES EXPLICIT TARJAN WEAK_SKIP STUBBORN AUT_STUB HEURISTIC DIST_HEUR OPTIM-1
Time left: 3587
------------------- QUERY 10 ----------------------
Solution found by parallel processing (step 1)
Query index 0 was solved
Query is NOT satisfied.
Spent 0.055165 on verification
@@@0.07,149672@@@
parallel: This job succeeded:
eval /usr/bin/time -f "@@@%e,%M@@@" /home/mcc/BenchKit/bin/verifypn -n -ltl\ tarjan\ --ltl-heur\ dist\ -q\ 0\ -l\ 0\ -d\ 119 /home/mcc/BenchKit/bin/tmp/tmp.59RyMQkF8r /home/mcc/BenchKit/bin/tmp/tmp.ZQDnMJbwuK --binary-query-io 1 -x 10 -n
FORMULA FlexibleBarrier-PT-18a-LTLFireability-09 FALSE TECHNIQUES EXPLICIT TARJAN WEAK_SKIP STUBBORN AUT_STUB HEURISTIC DIST_HEUR OPTIM-1
Time left: 3587
------------------- QUERY 11 ----------------------
Solution found by parallel processing (step 1)
Query index 0 was solved
Query is NOT satisfied.
Spent 0.056207 on verification
@@@0.07,149520@@@
parallel: This job succeeded:
eval /usr/bin/time -f "@@@%e,%M@@@" /home/mcc/BenchKit/bin/verifypn -n -ltl\ tarjan\ --ltl-heur\ dist\ -q\ 0\ -l\ 0\ -d\ 119 /home/mcc/BenchKit/bin/tmp/tmp.59RyMQkF8r /home/mcc/BenchKit/bin/tmp/tmp.ZQDnMJbwuK --binary-query-io 1 -x 11 -n
FORMULA FlexibleBarrier-PT-18a-LTLFireability-06 FALSE TECHNIQUES EXPLICIT TARJAN WEAK_SKIP STUBBORN AUT_STUB HEURISTIC DIST_HEUR OPTIM-1
Time left: 3586
------------------- QUERY 12 ----------------------
Solution found by parallel processing (step 1)
Query index 0 was solved
Query is NOT satisfied.
Spent 5.63969 on verification
@@@5.69,251280@@@
parallel: This job succeeded:
eval /usr/bin/time -f "@@@%e,%M@@@" /home/mcc/BenchKit/bin/verifypn -n -ltl\ tarjan\ --ltl-heur\ aut\ -s\ DFS\ -p\ -q\ 0\ -l\ 0\ -d\ 119 /home/mcc/BenchKit/bin/tmp/tmp.59RyMQkF8r /home/mcc/BenchKit/bin/tmp/tmp.ZQDnMJbwuK --binary-query-io 1 -x 12 -n
FORMULA FlexibleBarrier-PT-18a-LTLFireability-01 FALSE TECHNIQUES EXPLICIT TARJAN WEAK_SKIP OPTIM-1
Time left: 3580
------------------- QUERY 13 ----------------------
Solution found by parallel processing (step 1)
Query index 0 was solved
Query is NOT satisfied.
Spent 0.054242 on verification
@@@0.07,149892@@@
parallel: This job succeeded:
eval /usr/bin/time -f "@@@%e,%M@@@" /home/mcc/BenchKit/bin/verifypn -n -ltl\ tarjan\ --ltl-heur\ dist\ -q\ 0\ -l\ 0\ -d\ 119 /home/mcc/BenchKit/bin/tmp/tmp.59RyMQkF8r /home/mcc/BenchKit/bin/tmp/tmp.ZQDnMJbwuK --binary-query-io 1 -x 13 -n
FORMULA FlexibleBarrier-PT-18a-LTLFireability-04 FALSE TECHNIQUES EXPLICIT TARJAN WEAK_SKIP STUBBORN AUT_STUB HEURISTIC DIST_HEUR OPTIM-1
Time left: 3580
------------------- QUERY 14 ----------------------
Solution found by parallel processing (step 1)
Query index 0 was solved
Query is NOT satisfied.
Spent 0.065323 on verification
@@@0.08,149748@@@
parallel: This job succeeded:
eval /usr/bin/time -f "@@@%e,%M@@@" /home/mcc/BenchKit/bin/verifypn -n -ltl\ tarjan\ --ltl-heur\ fire-count\ -q\ 0\ -l\ 0\ -d\ 119 /home/mcc/BenchKit/bin/tmp/tmp.59RyMQkF8r /home/mcc/BenchKit/bin/tmp/tmp.ZQDnMJbwuK --binary-query-io 1 -x 14 -n
FORMULA FlexibleBarrier-PT-18a-LTLFireability-13 FALSE TECHNIQUES EXPLICIT TARJAN WEAK_SKIP STUBBORN AUT_STUB HEURISTIC LOGFIRECOUNT_HEUR(5000) OPTIM-1
Time left: 3580
------------------- QUERY 15 ----------------------
No solution found
Command terminated by signal 9
@@@208.95,6877340@@@
Time left: 3279
------------------- QUERY 16 ----------------------
Solution found by parallel processing (step 1)
Query index 0 was solved
Query is satisfied.
Spent 0.019921 on verification
@@@0.04,24036@@@
parallel: This job succeeded:
eval /usr/bin/time -f "@@@%e,%M@@@" /home/mcc/BenchKit/bin/verifypn -n -ltl\ ndfs\ -q\ 0\ -l\ 0\ -d\ 119 /home/mcc/BenchKit/bin/tmp/tmp.59RyMQkF8r /home/mcc/BenchKit/bin/tmp/tmp.ZQDnMJbwuK --binary-query-io 1 -x 16 -n
FORMULA FlexibleBarrier-PT-18a-LTLFireability-02 TRUE TECHNIQUES EXPLICIT NDFS WEAK_SKIP HEURISTIC AUTOMATON_HEUR OPTIM-1
Time left: 3279
---------------------------------------------------
Step 2: Sequential processing
---------------------------------------------------
Remaining 1 queries are verified sequentially.
Each query is verified for a dynamic timeout (at least 598 seconds)
Time left: 3279
------------------- QUERY 15 ----------------------
Running query 15 for 3279 seconds. Remaining: 1 queries and 3279 seconds
No solution found
terminate called after throwing an instance of 'std::bad_alloc'
what(): std::bad_alloc
Command terminated by signal 6
@@@763.85,13788464@@@
Time left: 2514
Time left: 2514
---------------------------------------------------
Step 4: Random Parallel processing
---------------------------------------------------
Doing random parallel verification of individual queries (1 in total)
Each query is verified by 4 parallel strategies for 2514 seconds
------------------- QUERY 15 ----------------------
No solution found
Command terminated by signal 9
@@@149.47,4346256@@@
Command terminated by signal 9
@@@211.22,5597272@@@
Command terminated by signal 9
@@@312.72,8076672@@@
terminate called after throwing an instance of 'std::bad_alloc'
what(): std::bad_alloc
Command terminated by signal 6
@@@487.30,14955972@@@
Time left: 2027
Time left: 2027
---------------------------------------------------
Step 4: Random Parallel processing
---------------------------------------------------
Doing random parallel verification of individual queries (1 in total)
Each query is verified by 4 parallel strategies for 2027 seconds
------------------- QUERY 15 ----------------------
No solution found
Command terminated by signal 9
@@@131.29,4175088@@@
Command terminated by signal 9
@@@181.89,5546896@@@
Command terminated by signal 9
@@@278.46,8100280@@@
terminate called after throwing an instance of 'std::bad_alloc'
what(): std::bad_alloc
Command terminated by signal 6
@@@461.32,14955996@@@
Time left: 1565
Time left: 1565
---------------------------------------------------
Step 4: Random Parallel processing
---------------------------------------------------
Doing random parallel verification of individual queries (1 in total)
Each query is verified by 4 parallel strategies for 1565 seconds
------------------- QUERY 15 ----------------------
No solution found
Command terminated by signal 9
@@@159.28,4859356@@@
Command terminated by signal 9
@@@220.00,5900976@@@
Command terminated by signal 9
@@@320.79,8366672@@@
terminate called after throwing an instance of 'std::bad_alloc'
what(): std::bad_alloc
Command terminated by signal 6
@@@510.30,14955980@@@
Time left: 1055
Time left: 1055
---------------------------------------------------
Step 4: Random Parallel processing
---------------------------------------------------
Doing random parallel verification of individual queries (1 in total)
Each query is verified by 4 parallel strategies for 1055 seconds
------------------- QUERY 15 ----------------------
No solution found
Command terminated by signal 9
@@@134.35,4096140@@@
Command terminated by signal 9
@@@183.59,5429464@@@
Command terminated by signal 9
@@@276.91,8087208@@@
terminate called after throwing an instance of 'std::bad_alloc'
what(): std::bad_alloc
Command terminated by signal 6
@@@458.91,14956072@@@
Time left: 595
Time left: 595
---------------------------------------------------
Step 4: Random Parallel processing
---------------------------------------------------
Doing random parallel verification of individual queries (1 in total)
Each query is verified by 4 parallel strategies for 595 seconds
------------------- QUERY 15 ----------------------
No solution found
Command terminated by signal 9
@@@146.96,4196200@@@
Command terminated by signal 9
@@@203.57,5494052@@@
Command terminated by signal 9
@@@297.28,8163404@@@
terminate called after throwing an instance of 'std::bad_alloc'
what(): std::bad_alloc
Command terminated by signal 6
@@@477.30,14955840@@@
Time left: 118
Time left: 118
---------------------------------------------------
Step 4: Random Parallel processing
---------------------------------------------------
Doing random parallel verification of individual queries (1 in total)
Each query is verified by 4 parallel strategies for 118 seconds
------------------- QUERY 15 ----------------------
No solution found
Time left: -3
Out of time, terminating!
terminated-with-cleanup
BK_STOP 1678677965384
--------------------
content from stderr:
Sequence of Actions to be Executed by the VM
This is useful if one wants to reexecute the tool in the VM from the submitted image disk.
set -x
# this is for BenchKit: configuration of major elements for the test
export BK_INPUT="FlexibleBarrier-PT-18a"
export BK_EXAMINATION="LTLFireability"
export BK_TOOL="gold2022"
export BK_RESULT_DIR="/tmp/BK_RESULTS/OUTPUTS"
export BK_TIME_CONFINEMENT="3600"
export BK_MEMORY_CONFINEMENT="16384"
export BK_BIN_PATH="/home/mcc/BenchKit/bin/"
# this is specific to your benchmark or test
export BIN_DIR="$HOME/BenchKit/bin"
# remove the execution directoty if it exists (to avoid increse of .vmdk images)
if [ -d execution ] ; then
rm -rf execution
fi
# this is for BenchKit: explicit launching of the test
echo "====================================================================="
echo " Generated by BenchKit 2-5348"
echo " Executing tool gold2022"
echo " Input is FlexibleBarrier-PT-18a, examination is LTLFireability"
echo " Time confinement is $BK_TIME_CONFINEMENT seconds"
echo " Memory confinement is 16384 MBytes"
echo " Number of cores is 4"
echo " Run identifier is r190-tall-167838875700418"
echo "====================================================================="
echo
echo "--------------------"
echo "preparation of the directory to be used:"
tar xzf /home/mcc/BenchKit/INPUTS/FlexibleBarrier-PT-18a.tgz
mv FlexibleBarrier-PT-18a execution
cd execution
if [ "LTLFireability" = "ReachabilityDeadlock" ] || [ "LTLFireability" = "UpperBounds" ] || [ "LTLFireability" = "QuasiLiveness" ] || [ "LTLFireability" = "StableMarking" ] || [ "LTLFireability" = "Liveness" ] || [ "LTLFireability" = "OneSafe" ] || [ "LTLFireability" = "StateSpace" ]; then
rm -f GenericPropertiesVerdict.xml
fi
pwd
ls -lh
echo
echo "--------------------"
echo "content from stdout:"
echo
echo "=== Data for post analysis generated by BenchKit (invocation template)"
echo
if [ "LTLFireability" = "UpperBounds" ] ; then
echo "The expected result is a vector of positive values"
echo NUM_VECTOR
elif [ "LTLFireability" != "StateSpace" ] ; then
echo "The expected result is a vector of booleans"
echo BOOL_VECTOR
else
echo "no data necessary for post analysis"
fi
echo
if [ -f "LTLFireability.txt" ] ; then
echo "here is the order used to build the result vector(from text file)"
for x in $(grep Property LTLFireability.txt | cut -d ' ' -f 2 | sort -u) ; do
echo "FORMULA_NAME $x"
done
elif [ -f "LTLFireability.xml" ] ; then # for cunf (txt files deleted;-)
echo echo "here is the order used to build the result vector(from xml file)"
for x in $(grep '
echo "FORMULA_NAME $x"
done
elif [ "LTLFireability" = "ReachabilityDeadlock" ] || [ "LTLFireability" = "QuasiLiveness" ] || [ "LTLFireability" = "StableMarking" ] || [ "LTLFireability" = "Liveness" ] || [ "LTLFireability" = "OneSafe" ] ; then
echo "FORMULA_NAME LTLFireability"
fi
echo
echo "=== Now, execution of the tool begins"
echo
echo -n "BK_START "
date -u +%s%3N
echo
timeout -s 9 $BK_TIME_CONFINEMENT bash -c "/home/mcc/BenchKit/BenchKit_head.sh 2> STDERR ; echo ; echo -n \"BK_STOP \" ; date -u +%s%3N"
if [ $? -eq 137 ] ; then
echo
echo "BK_TIME_CONFINEMENT_REACHED"
fi
echo
echo "--------------------"
echo "content from stderr:"
echo
cat STDERR ;