

About the Execution of 2022-gold for BusinessProcesses-PT-07
| Execution Summary | |||||
| Max Memory Used (MB) |
Time wait (ms) | CPU Usage (ms) | I/O Wait (ms) | Computed Result | Execution Status |
| 16225.728 | 3593058.00 | 5011956.00 | 1021.20 | FFTFF?FFFFFFFFTF | normal |
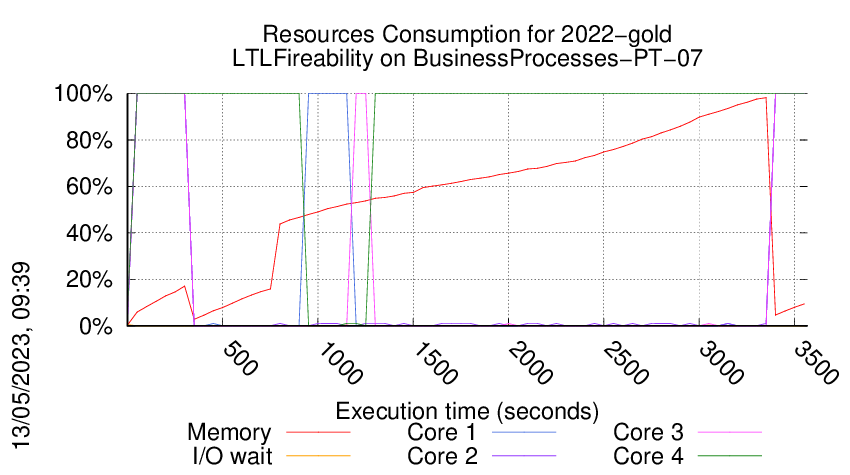
Execution Chart
We display below the execution chart for this examination (boot time has been removed).
Trace from the execution
Formatting '/mnt/tpsp/fkordon/mcc2023-input.r062-tajo-167813711200376.qcow2', fmt=qcow2 size=4294967296 backing_file='/mnt/tpsp/fkordon/mcc2023-input.qcow2' encryption=off cluster_size=65536 lazy_refcounts=off
Waiting for the VM to be ready (probing ssh)
.......................
=====================================================================
Generated by BenchKit 2-5348
Executing tool gold2022
Input is BusinessProcesses-PT-07, examination is LTLFireability
Time confinement is 3600 seconds
Memory confinement is 16384 MBytes
Number of cores is 4
Run identifier is r062-tajo-167813711200376
=====================================================================
--------------------
preparation of the directory to be used:
/home/mcc/execution
total 540K
-rw-r--r-- 1 mcc users 8.4K Feb 25 16:44 CTLCardinality.txt
-rw-r--r-- 1 mcc users 96K Feb 25 16:44 CTLCardinality.xml
-rw-r--r-- 1 mcc users 4.5K Feb 25 16:42 CTLFireability.txt
-rw-r--r-- 1 mcc users 39K Feb 25 16:42 CTLFireability.xml
-rw-r--r-- 1 mcc users 6 Mar 5 18:22 equiv_col
-rw-r--r-- 1 mcc users 4.2K Jan 29 11:40 GenericPropertiesDefinition.xml
-rw-r--r-- 1 mcc users 6.8K Jan 29 11:40 GenericPropertiesVerdict.xml
-rw-r--r-- 1 mcc users 3 Mar 5 18:22 instance
-rw-r--r-- 1 mcc users 6 Mar 5 18:22 iscolored
-rw-r--r-- 1 mcc users 3.8K Feb 25 15:38 LTLCardinality.txt
-rw-r--r-- 1 mcc users 26K Feb 25 15:38 LTLCardinality.xml
-rw-r--r-- 1 mcc users 2.3K Feb 25 15:38 LTLFireability.txt
-rw-r--r-- 1 mcc users 18K Feb 25 15:38 LTLFireability.xml
-rw-r--r-- 1 mcc users 100K Mar 5 18:22 model.pnml
-rw-r--r-- 1 mcc users 9.9K Feb 25 16:44 ReachabilityCardinality.txt
-rw-r--r-- 1 mcc users 106K Feb 25 16:44 ReachabilityCardinality.xml
-rw-r--r-- 1 mcc users 7.4K Feb 25 16:44 ReachabilityFireability.txt
-rw-r--r-- 1 mcc users 62K Feb 25 16:44 ReachabilityFireability.xml
-rw-r--r-- 1 mcc users 1.7K Feb 25 15:38 UpperBounds.txt
-rw-r--r-- 1 mcc users 3.8K Feb 25 15:38 UpperBounds.xml
--------------------
content from stdout:
=== Data for post analysis generated by BenchKit (invocation template)
The expected result is a vector of booleans
BOOL_VECTOR
here is the order used to build the result vector(from text file)
FORMULA_NAME BusinessProcesses-PT-07-LTLFireability-00
FORMULA_NAME BusinessProcesses-PT-07-LTLFireability-01
FORMULA_NAME BusinessProcesses-PT-07-LTLFireability-02
FORMULA_NAME BusinessProcesses-PT-07-LTLFireability-03
FORMULA_NAME BusinessProcesses-PT-07-LTLFireability-04
FORMULA_NAME BusinessProcesses-PT-07-LTLFireability-05
FORMULA_NAME BusinessProcesses-PT-07-LTLFireability-06
FORMULA_NAME BusinessProcesses-PT-07-LTLFireability-07
FORMULA_NAME BusinessProcesses-PT-07-LTLFireability-08
FORMULA_NAME BusinessProcesses-PT-07-LTLFireability-09
FORMULA_NAME BusinessProcesses-PT-07-LTLFireability-10
FORMULA_NAME BusinessProcesses-PT-07-LTLFireability-11
FORMULA_NAME BusinessProcesses-PT-07-LTLFireability-12
FORMULA_NAME BusinessProcesses-PT-07-LTLFireability-13
FORMULA_NAME BusinessProcesses-PT-07-LTLFireability-14
FORMULA_NAME BusinessProcesses-PT-07-LTLFireability-15
=== Now, execution of the tool begins
BK_START 1678905883074
gold2022
Got BK_BIN_PATH=/home/mcc/BenchKit/bin/
---> gold2022 --- TAPAAL v5
Setting MODEL_PATH=.
Setting VERIFYPN=/home/mcc/BenchKit/bin/verifypn
Got BK_TIME_CONFINEMENT=3600
Setting TEMPDIR=/home/mcc/BenchKit/bin/tmp
Got BK_MEMORY_CONFINEMENT=16384
Limiting to 16265216 kB
Total timeout: 3590
Time left: 3590
*************************************
* TAPAAL verifying LTLFireability *
*************************************
TEMPDIR=/home/mcc/BenchKit/bin/tmp
QF=/home/mcc/BenchKit/bin/tmp/tmp.NpHHmhs9Jm
MF=/home/mcc/BenchKit/bin/tmp/tmp.str9vboOfr
Time left: 3590
---------------------------------------------------
Step -1: Stripping Colors
---------------------------------------------------
Verifying stripped models (16 in total)
/home/mcc/BenchKit/bin/verifypn -n -c -q 718 -ltl -l 29 -d 299 -z 4 -x 1,2,3,4,5,6,7,8,9,10,11,12,13,14,15,16 ./model.pnml ./LTLFireability.xml
CPN OverApproximation is only usable on colored models
Time left: 3590
---------------------------------------------------
Step 0: Parallel Simplification
---------------------------------------------------
Doing parallel simplification (16 in total)
Total simplification timout is 718 -- reduction timeout is 299
timeout 1017 /home/mcc/BenchKit/bin/verifypn -n -ltl -q 718 -l 29 -d 299 -z 4 -s OverApprox --binary-query-io 2 --write-simplified /home/mcc/BenchKit/bin/tmp/tmp.NpHHmhs9Jm --write-reduced /home/mcc/BenchKit/bin/tmp/tmp.str9vboOfr -x 1,2,3,4,5,6,7,8,9,10,11,12,13,14,15,16 ./model.pnml ./LTLFireability.xml
FORMULA BusinessProcesses-PT-07-LTLFireability-04 FALSE TECHNIQUES COLLATERAL_PROCESSING STRUCTURAL_REDUCTION QUERY_REDUCTION SAT_SMT LP_APPROX
Query index 4 was solved
Query is NOT satisfied.
FORMULA BusinessProcesses-PT-07-LTLFireability-12 FALSE TECHNIQUES COLLATERAL_PROCESSING STRUCTURAL_REDUCTION QUERY_REDUCTION SAT_SMT LP_APPROX
Query index 12 was solved
Query is NOT satisfied.
Solution found by parallel simplification (step 0)
Solution found by parallel simplification (step 0)
Time left: 3590
---------------------------------------------------
Step 1: Parallel processing
---------------------------------------------------
Doing parallel verification of individual queries (14 in total)
Each query is verified by 4 parallel strategies for 299 seconds
------------------- QUERY 1 ----------------------
Solution found by parallel processing (step 1)
Query index 0 was solved
Query is NOT satisfied.
Spent 0.066732 on verification
@@@0.07,149524@@@
parallel: This job succeeded:
eval /usr/bin/time -f "@@@%e,%M@@@" /home/mcc/BenchKit/bin/verifypn -n -ltl\ tarjan\ --ltl-heur\ dist\ -q\ 0\ -l\ 0\ -d\ 119 /home/mcc/BenchKit/bin/tmp/tmp.str9vboOfr /home/mcc/BenchKit/bin/tmp/tmp.NpHHmhs9Jm --binary-query-io 1 -x 1 -n
FORMULA BusinessProcesses-PT-07-LTLFireability-08 FALSE TECHNIQUES EXPLICIT TARJAN WEAK_SKIP STUBBORN AUT_STUB HEURISTIC DIST_HEUR OPTIM-1
Time left: 3590
------------------- QUERY 2 ----------------------
Solution found by parallel processing (step 1)
Query index 0 was solved
Query is NOT satisfied.
Spent 0.013081 on verification
@@@0.02,21956@@@
parallel: This job succeeded:
eval /usr/bin/time -f "@@@%e,%M@@@" /home/mcc/BenchKit/bin/verifypn -n -ltl\ ndfs\ -q\ 0\ -l\ 0\ -d\ 119 /home/mcc/BenchKit/bin/tmp/tmp.str9vboOfr /home/mcc/BenchKit/bin/tmp/tmp.NpHHmhs9Jm --binary-query-io 1 -x 2 -n
FORMULA BusinessProcesses-PT-07-LTLFireability-09 FALSE TECHNIQUES EXPLICIT NDFS WEAK_SKIP HEURISTIC AUTOMATON_HEUR OPTIM-1
Time left: 3589
------------------- QUERY 3 ----------------------
Solution found by parallel processing (step 1)
Query index 0 was solved
Query is NOT satisfied.
Spent 0.072813 on verification
@@@0.09,149668@@@
parallel: This job succeeded:
eval /usr/bin/time -f "@@@%e,%M@@@" /home/mcc/BenchKit/bin/verifypn -n -ltl\ tarjan\ --ltl-heur\ aut\ -s\ DFS\ -p\ -q\ 0\ -l\ 0\ -d\ 119 /home/mcc/BenchKit/bin/tmp/tmp.str9vboOfr /home/mcc/BenchKit/bin/tmp/tmp.NpHHmhs9Jm --binary-query-io 1 -x 3 -n
FORMULA BusinessProcesses-PT-07-LTLFireability-10 FALSE TECHNIQUES EXPLICIT TARJAN WEAK_SKIP OPTIM-1
Time left: 3589
------------------- QUERY 4 ----------------------
Solution found by parallel processing (step 1)
Query index 0 was solved
Query is NOT satisfied.
Spent 0.020433 on verification
@@@0.07,22900@@@
parallel: This job succeeded:
eval /usr/bin/time -f "@@@%e,%M@@@" /home/mcc/BenchKit/bin/verifypn -n -ltl\ ndfs\ -q\ 0\ -l\ 0\ -d\ 119 /home/mcc/BenchKit/bin/tmp/tmp.str9vboOfr /home/mcc/BenchKit/bin/tmp/tmp.NpHHmhs9Jm --binary-query-io 1 -x 4 -n
FORMULA BusinessProcesses-PT-07-LTLFireability-15 FALSE TECHNIQUES EXPLICIT NDFS WEAK_SKIP HEURISTIC AUTOMATON_HEUR OPTIM-1
Time left: 3588
------------------- QUERY 5 ----------------------
Solution found by parallel processing (step 1)
Query index 0 was solved
Query is NOT satisfied.
FORMULA BusinessProcesses-PT-07-LTLFireability-07 FALSE TECHNIQUES EXPLICIT TARJAN WEAK_SKIP STUBBORN AUT_STUB HEURISTIC DIST_HEUR OPTIM-1
Query index 0 was solved
Query is NOT satisfied.
Spent 0.088281 on verification
FORMULA BusinessProcesses-PT-07-LTLFireability-07 FALSE TECHNIQUES EXPLICIT TARJAN WEAK_SKIP OPTIM-1
Query index 0 was solved
Query is NOT satisfied.
Spent 0.076393 on verification
@@@0.09,149400@@@
Spent 0.057768 on verification
@@@0.10,149460@@@
parallel: This job succeeded:
eval /usr/bin/time -f "@@@%e,%M@@@" /home/mcc/BenchKit/bin/verifypn -n -ltl\ tarjan\ --ltl-heur\ dist\ -q\ 0\ -l\ 0\ -d\ 119 /home/mcc/BenchKit/bin/tmp/tmp.str9vboOfr /home/mcc/BenchKit/bin/tmp/tmp.NpHHmhs9Jm --binary-query-io 1 -x 5 -n
parallel: This job succeeded:
eval /usr/bin/time -f "@@@%e,%M@@@" /home/mcc/BenchKit/bin/verifypn -n -ltl\ tarjan\ --ltl-heur\ aut\ -s\ DFS\ -p\ -q\ 0\ -l\ 0\ -d\ 119 /home/mcc/BenchKit/bin/tmp/tmp.str9vboOfr /home/mcc/BenchKit/bin/tmp/tmp.NpHHmhs9Jm --binary-query-io 1 -x 5 -n
FORMULA BusinessProcesses-PT-07-LTLFireability-07 FALSE TECHNIQUES EXPLICIT NDFS WEAK_SKIP HEURISTIC AUTOMATON_HEUR OPTIM-1
Time left: 3588
------------------- QUERY 6 ----------------------
Solution found by parallel processing (step 1)
Query index 0 was solved
Query is satisfied.
Spent 0.038443 on verification
FORMULA BusinessProcesses-PT-07-LTLFireability-02 TRUE TECHNIQUES EXPLICIT TARJAN WEAK_SKIP STUBBORN AUT_STUB HEURISTIC LOGFIRECOUNT_HEUR(5000) OPTIM-1
Query index 0 was solved
Query is satisfied.
Spent 0.06839 on verification
@@@0.08,150176@@@
@@@0.06,22560@@@
FORMULA BusinessProcesses-PT-07-LTLFireability-02 TRUE TECHNIQUES EXPLICIT TARJAN WEAK_SKIP STUBBORN AUT_STUB HEURISTIC DIST_HEUR OPTIM-1
Query index 0 was solved
Query is satisfied.
parallel: This job succeeded:
eval /usr/bin/time -f "@@@%e,%M@@@" /home/mcc/BenchKit/bin/verifypn -n -ltl\ ndfs\ -q\ 0\ -l\ 0\ -d\ 119 /home/mcc/BenchKit/bin/tmp/tmp.str9vboOfr /home/mcc/BenchKit/bin/tmp/tmp.NpHHmhs9Jm --binary-query-io 1 -x 6 -n
FORMULA BusinessProcesses-PT-07-LTLFireability-02 TRUE TECHNIQUES EXPLICIT NDFS WEAK_SKIP HEURISTIC AUTOMATON_HEUR OPTIM-1
Time left: 3588
------------------- QUERY 7 ----------------------
Solution found by parallel processing (step 1)
Query index 0 was solved
Query is NOT satisfied.
Spent 0.017588 on verification
@@@0.04,22052@@@
parallel: This job succeeded:
eval /usr/bin/time -f "@@@%e,%M@@@" /home/mcc/BenchKit/bin/verifypn -n -ltl\ ndfs\ -q\ 0\ -l\ 0\ -d\ 119 /home/mcc/BenchKit/bin/tmp/tmp.str9vboOfr /home/mcc/BenchKit/bin/tmp/tmp.NpHHmhs9Jm --binary-query-io 1 -x 7 -n
FORMULA BusinessProcesses-PT-07-LTLFireability-06 FALSE TECHNIQUES EXPLICIT NDFS WEAK_SKIP HEURISTIC AUTOMATON_HEUR OPTIM-1
Time left: 3587
------------------- QUERY 8 ----------------------
Solution found by parallel processing (step 1)
Query index 0 was solved
Query is NOT satisfied.
Spent 0.015739 on verification
@@@0.03,21888@@@
parallel: This job succeeded:
eval /usr/bin/time -f "@@@%e,%M@@@" /home/mcc/BenchKit/bin/verifypn -n -ltl\ ndfs\ -q\ 0\ -l\ 0\ -d\ 119 /home/mcc/BenchKit/bin/tmp/tmp.str9vboOfr /home/mcc/BenchKit/bin/tmp/tmp.NpHHmhs9Jm --binary-query-io 1 -x 8 -n
FORMULA BusinessProcesses-PT-07-LTLFireability-01 FALSE TECHNIQUES EXPLICIT NDFS WEAK_SKIP HEURISTIC AUTOMATON_HEUR OPTIM-1
Time left: 3587
------------------- QUERY 9 ----------------------
Solution found by parallel processing (step 1)
Query index 0 was solved
Query is NOT satisfied.
Spent 0.140395 on verification
@@@0.14,149508@@@
FORMULA BusinessProcesses-PT-07-LTLFireability-13 FALSE TECHNIQUES EXPLICIT TARJAN WEAK_SKIP STUBBORN AUT_STUB HEURISTIC DIST_HEUR OPTIM-1
Query index 0 was solved
Query is NOT satisfied.
Spent 0.152542 on verification
@@@0.16,149604@@@
parallel: This job succeeded:
eval /usr/bin/time -f "@@@%e,%M@@@" /home/mcc/BenchKit/bin/verifypn -n -ltl\ tarjan\ --ltl-heur\ dist\ -q\ 0\ -l\ 0\ -d\ 119 /home/mcc/BenchKit/bin/tmp/tmp.str9vboOfr /home/mcc/BenchKit/bin/tmp/tmp.NpHHmhs9Jm --binary-query-io 1 -x 9 -n
parallel: This job succeeded:
eval /usr/bin/time -f "@@@%e,%M@@@" /home/mcc/BenchKit/bin/verifypn -n -ltl\ tarjan\ --ltl-heur\ fire-count\ -q\ 0\ -l\ 0\ -d\ 119 /home/mcc/BenchKit/bin/tmp/tmp.str9vboOfr /home/mcc/BenchKit/bin/tmp/tmp.NpHHmhs9Jm --binary-query-io 1 -x 9 -n
FORMULA BusinessProcesses-PT-07-LTLFireability-13 FALSE TECHNIQUES EXPLICIT TARJAN WEAK_SKIP STUBBORN AUT_STUB HEURISTIC LOGFIRECOUNT_HEUR(5000) OPTIM-1
Time left: 3587
------------------- QUERY 10 ----------------------
Solution found by parallel processing (step 1)
Query index 0 was solved
Query is NOT satisfied.
Spent 0.031501 on verification
@@@0.07,22272@@@
parallel: This job succeeded:
eval /usr/bin/time -f "@@@%e,%M@@@" /home/mcc/BenchKit/bin/verifypn -n -ltl\ ndfs\ -q\ 0\ -l\ 0\ -d\ 119 /home/mcc/BenchKit/bin/tmp/tmp.str9vboOfr /home/mcc/BenchKit/bin/tmp/tmp.NpHHmhs9Jm --binary-query-io 1 -x 10 -n
FORMULA BusinessProcesses-PT-07-LTLFireability-00 FALSE TECHNIQUES EXPLICIT NDFS WEAK_SKIP HEURISTIC AUTOMATON_HEUR OPTIM-1
Time left: 3586
------------------- QUERY 11 ----------------------
Solution found by parallel processing (step 1)
Query index 0 was solved
Query is NOT satisfied.
Spent 0.07016 on verification
@@@0.08,149736@@@
FORMULA BusinessProcesses-PT-07-LTLFireability-03 FALSE TECHNIQUES EXPLICIT NDFS WEAK_SKIP HEURISTIC AUTOMATON_HEUR OPTIM-1
Query index 0 was solved
Query is NOT satisfied.
Spent 0.018354 on verification
@@@0.05,22092@@@
parallel: This job succeeded:
eval /usr/bin/time -f "@@@%e,%M@@@" /home/mcc/BenchKit/bin/verifypn -n -ltl\ ndfs\ -q\ 0\ -l\ 0\ -d\ 119 /home/mcc/BenchKit/bin/tmp/tmp.str9vboOfr /home/mcc/BenchKit/bin/tmp/tmp.NpHHmhs9Jm --binary-query-io 1 -x 11 -n
FORMULA BusinessProcesses-PT-07-LTLFireability-03 FALSE TECHNIQUES EXPLICIT TARJAN WEAK_SKIP STUBBORN AUT_STUB HEURISTIC DIST_HEUR OPTIM-1
Time left: 3586
------------------- QUERY 12 ----------------------
Solution found by parallel processing (step 1)
Query index 0 was solved
Query is satisfied.
Spent 0.023173 on verification
@@@0.04,23204@@@
parallel: This job succeeded:
eval /usr/bin/time -f "@@@%e,%M@@@" /home/mcc/BenchKit/bin/verifypn -n -ltl\ ndfs\ -q\ 0\ -l\ 0\ -d\ 119 /home/mcc/BenchKit/bin/tmp/tmp.str9vboOfr /home/mcc/BenchKit/bin/tmp/tmp.NpHHmhs9Jm --binary-query-io 1 -x 12 -n
FORMULA BusinessProcesses-PT-07-LTLFireability-14 TRUE TECHNIQUES EXPLICIT NDFS WEAK_SKIP HEURISTIC AUTOMATON_HEUR OPTIM-1
Time left: 3586
------------------- QUERY 13 ----------------------
Solution found by parallel processing (step 1)
Query index 0 was solved
Query is NOT satisfied.
Spent 0.019611 on verification
@@@0.05,23316@@@
parallel: This job succeeded:
eval /usr/bin/time -f "@@@%e,%M@@@" /home/mcc/BenchKit/bin/verifypn -n -ltl\ ndfs\ -q\ 0\ -l\ 0\ -d\ 119 /home/mcc/BenchKit/bin/tmp/tmp.str9vboOfr /home/mcc/BenchKit/bin/tmp/tmp.NpHHmhs9Jm --binary-query-io 1 -x 13 -n
FORMULA BusinessProcesses-PT-07-LTLFireability-11 FALSE TECHNIQUES EXPLICIT NDFS WEAK_SKIP HEURISTIC AUTOMATON_HEUR OPTIM-1
Time left: 3585
------------------- QUERY 14 ----------------------
No solution found
Time left: 3283
---------------------------------------------------
Step 2: Sequential processing
---------------------------------------------------
Remaining 1 queries are verified sequentially.
Each query is verified for a dynamic timeout (at least 598 seconds)
Time left: 3283
------------------- QUERY 14 ----------------------
Running query 14 for 3283 seconds. Remaining: 1 queries and 3283 seconds
No solution found
Command terminated by signal 9
@@@3110.85,16145444@@@
Time left: 172
Time left: 172
---------------------------------------------------
Step 4: Random Parallel processing
---------------------------------------------------
Doing random parallel verification of individual queries (1 in total)
Each query is verified by 4 parallel strategies for 172 seconds
------------------- QUERY 14 ----------------------
No solution found
Time left: -3
Out of time, terminating!
terminated-with-cleanup
BK_STOP 1678909476132
--------------------
content from stderr:
Sequence of Actions to be Executed by the VM
This is useful if one wants to reexecute the tool in the VM from the submitted image disk.
set -x
# this is for BenchKit: configuration of major elements for the test
export BK_INPUT="BusinessProcesses-PT-07"
export BK_EXAMINATION="LTLFireability"
export BK_TOOL="gold2022"
export BK_RESULT_DIR="/tmp/BK_RESULTS/OUTPUTS"
export BK_TIME_CONFINEMENT="3600"
export BK_MEMORY_CONFINEMENT="16384"
export BK_BIN_PATH="/home/mcc/BenchKit/bin/"
# this is specific to your benchmark or test
export BIN_DIR="$HOME/BenchKit/bin"
# remove the execution directoty if it exists (to avoid increse of .vmdk images)
if [ -d execution ] ; then
rm -rf execution
fi
# this is for BenchKit: explicit launching of the test
echo "====================================================================="
echo " Generated by BenchKit 2-5348"
echo " Executing tool gold2022"
echo " Input is BusinessProcesses-PT-07, examination is LTLFireability"
echo " Time confinement is $BK_TIME_CONFINEMENT seconds"
echo " Memory confinement is 16384 MBytes"
echo " Number of cores is 4"
echo " Run identifier is r062-tajo-167813711200376"
echo "====================================================================="
echo
echo "--------------------"
echo "preparation of the directory to be used:"
tar xzf /home/mcc/BenchKit/INPUTS/BusinessProcesses-PT-07.tgz
mv BusinessProcesses-PT-07 execution
cd execution
if [ "LTLFireability" = "ReachabilityDeadlock" ] || [ "LTLFireability" = "UpperBounds" ] || [ "LTLFireability" = "QuasiLiveness" ] || [ "LTLFireability" = "StableMarking" ] || [ "LTLFireability" = "Liveness" ] || [ "LTLFireability" = "OneSafe" ] || [ "LTLFireability" = "StateSpace" ]; then
rm -f GenericPropertiesVerdict.xml
fi
pwd
ls -lh
echo
echo "--------------------"
echo "content from stdout:"
echo
echo "=== Data for post analysis generated by BenchKit (invocation template)"
echo
if [ "LTLFireability" = "UpperBounds" ] ; then
echo "The expected result is a vector of positive values"
echo NUM_VECTOR
elif [ "LTLFireability" != "StateSpace" ] ; then
echo "The expected result is a vector of booleans"
echo BOOL_VECTOR
else
echo "no data necessary for post analysis"
fi
echo
if [ -f "LTLFireability.txt" ] ; then
echo "here is the order used to build the result vector(from text file)"
for x in $(grep Property LTLFireability.txt | cut -d ' ' -f 2 | sort -u) ; do
echo "FORMULA_NAME $x"
done
elif [ -f "LTLFireability.xml" ] ; then # for cunf (txt files deleted;-)
echo echo "here is the order used to build the result vector(from xml file)"
for x in $(grep '
echo "FORMULA_NAME $x"
done
elif [ "LTLFireability" = "ReachabilityDeadlock" ] || [ "LTLFireability" = "QuasiLiveness" ] || [ "LTLFireability" = "StableMarking" ] || [ "LTLFireability" = "Liveness" ] || [ "LTLFireability" = "OneSafe" ] ; then
echo "FORMULA_NAME LTLFireability"
fi
echo
echo "=== Now, execution of the tool begins"
echo
echo -n "BK_START "
date -u +%s%3N
echo
timeout -s 9 $BK_TIME_CONFINEMENT bash -c "/home/mcc/BenchKit/BenchKit_head.sh 2> STDERR ; echo ; echo -n \"BK_STOP \" ; date -u +%s%3N"
if [ $? -eq 137 ] ; then
echo
echo "BK_TIME_CONFINEMENT_REACHED"
fi
echo
echo "--------------------"
echo "content from stderr:"
echo
cat STDERR ;