

About the Execution of 2022-gold for BART-COL-040
| Execution Summary | |||||
| Max Memory Used (MB) |
Time wait (ms) | CPU Usage (ms) | I/O Wait (ms) | Computed Result | Execution Status |
| 16221.884 | 3593137.00 | 7379652.00 | 437.60 | FFFF?FFFFFFFFFFF | normal |
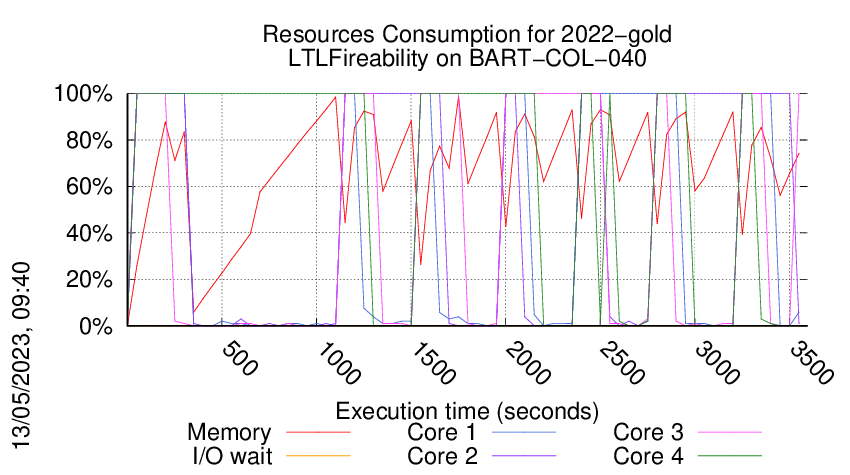
Execution Chart
We display below the execution chart for this examination (boot time has been removed).
Trace from the execution
Formatting '/data/fkordon/mcc2023-input.r030-oct2-167813615200550.qcow2', fmt=qcow2 cluster_size=65536 extended_l2=off compression_type=zlib size=4294967296 backing_file=/data/fkordon/mcc2023-input.qcow2 backing_fmt=qcow2 lazy_refcounts=off refcount_bits=16
Waiting for the VM to be ready (probing ssh)
......................................................................................................................................................................................................................................................................................................................................................................................................................................................
=====================================================================
Generated by BenchKit 2-5348
Executing tool gold2022
Input is BART-COL-040, examination is LTLFireability
Time confinement is 3600 seconds
Memory confinement is 16384 MBytes
Number of cores is 4
Run identifier is r030-oct2-167813615200550
=====================================================================
--------------------
preparation of the directory to be used:
/home/mcc/execution
total 684K
-rw-r--r-- 1 mcc users 9.4K Feb 26 06:43 CTLCardinality.txt
-rw-r--r-- 1 mcc users 97K Feb 26 06:43 CTLCardinality.xml
-rw-r--r-- 1 mcc users 5.1K Feb 26 04:27 CTLFireability.txt
-rw-r--r-- 1 mcc users 42K Feb 26 04:27 CTLFireability.xml
-rw-r--r-- 1 mcc users 5 Mar 5 18:22 equiv_pt
-rw-r--r-- 1 mcc users 4.2K Jan 29 11:40 GenericPropertiesDefinition.xml
-rw-r--r-- 1 mcc users 6.4K Jan 29 11:40 GenericPropertiesVerdict.xml
-rw-r--r-- 1 mcc users 4 Mar 5 18:22 instance
-rw-r--r-- 1 mcc users 5 Mar 5 18:22 iscolored
-rw-r--r-- 1 mcc users 3.9K Feb 25 15:35 LTLCardinality.txt
-rw-r--r-- 1 mcc users 25K Feb 25 15:35 LTLCardinality.xml
-rw-r--r-- 1 mcc users 2.4K Feb 25 15:35 LTLFireability.txt
-rw-r--r-- 1 mcc users 17K Feb 25 15:35 LTLFireability.xml
-rw-r--r-- 1 mcc users 207K Mar 5 18:22 model.pnml
-rw-r--r-- 1 mcc users 13K Feb 26 09:30 ReachabilityCardinality.txt
-rw-r--r-- 1 mcc users 113K Feb 26 09:30 ReachabilityCardinality.xml
-rw-r--r-- 1 mcc users 9.4K Feb 26 07:53 ReachabilityFireability.txt
-rw-r--r-- 1 mcc users 73K Feb 26 07:53 ReachabilityFireability.xml
-rw-r--r-- 1 mcc users 1.6K Feb 25 15:35 UpperBounds.txt
-rw-r--r-- 1 mcc users 3.7K Feb 25 15:35 UpperBounds.xml
--------------------
content from stdout:
=== Data for post analysis generated by BenchKit (invocation template)
The expected result is a vector of booleans
BOOL_VECTOR
here is the order used to build the result vector(from text file)
FORMULA_NAME BART-COL-040-LTLFireability-00
FORMULA_NAME BART-COL-040-LTLFireability-01
FORMULA_NAME BART-COL-040-LTLFireability-02
FORMULA_NAME BART-COL-040-LTLFireability-03
FORMULA_NAME BART-COL-040-LTLFireability-04
FORMULA_NAME BART-COL-040-LTLFireability-05
FORMULA_NAME BART-COL-040-LTLFireability-06
FORMULA_NAME BART-COL-040-LTLFireability-07
FORMULA_NAME BART-COL-040-LTLFireability-08
FORMULA_NAME BART-COL-040-LTLFireability-09
FORMULA_NAME BART-COL-040-LTLFireability-10
FORMULA_NAME BART-COL-040-LTLFireability-11
FORMULA_NAME BART-COL-040-LTLFireability-12
FORMULA_NAME BART-COL-040-LTLFireability-13
FORMULA_NAME BART-COL-040-LTLFireability-14
FORMULA_NAME BART-COL-040-LTLFireability-15
=== Now, execution of the tool begins
BK_START 1678449743481
gold2022
Got BK_BIN_PATH=/home/mcc/BenchKit/bin/
---> gold2022 --- TAPAAL v5
Setting MODEL_PATH=.
Setting VERIFYPN=/home/mcc/BenchKit/bin/verifypn
Got BK_TIME_CONFINEMENT=3600
Setting TEMPDIR=/home/mcc/BenchKit/bin/tmp
Got BK_MEMORY_CONFINEMENT=16384
Limiting to 16265216 kB
Total timeout: 3590
Time left: 3590
*************************************
* TAPAAL verifying LTLFireability *
*************************************
TEMPDIR=/home/mcc/BenchKit/bin/tmp
QF=/home/mcc/BenchKit/bin/tmp/tmp.bli1k7beRh
MF=/home/mcc/BenchKit/bin/tmp/tmp.5T61nzVczy
Time left: 3590
---------------------------------------------------
Step -1: Stripping Colors
---------------------------------------------------
Verifying stripped models (16 in total)
/home/mcc/BenchKit/bin/verifypn -n -c -q 718 -ltl -l 29 -d 299 -z 4 -x 1,2,3,4,5,6,7,8,9,10,11,12,13,14,15,16 ./model.pnml ./LTLFireability.xml
Warning: CPN OverApproximation is only available for Reachability queries without deadlock, negated fireability and UpperBounds, skipping BART-COL-040-LTLFireability-15
Warning: CPN OverApproximation is only available for Reachability queries without deadlock, negated fireability and UpperBounds, skipping BART-COL-040-LTLFireability-14
Warning: CPN OverApproximation is only available for Reachability queries without deadlock, negated fireability and UpperBounds, skipping BART-COL-040-LTLFireability-13
Warning: CPN OverApproximation is only available for Reachability queries without deadlock, negated fireability and UpperBounds, skipping BART-COL-040-LTLFireability-12
Warning: CPN OverApproximation is only available for Reachability queries without deadlock, negated fireability and UpperBounds, skipping BART-COL-040-LTLFireability-11
Warning: CPN OverApproximation is only available for Reachability queries without deadlock, negated fireability and UpperBounds, skipping BART-COL-040-LTLFireability-10
Warning: CPN OverApproximation is only available for Reachability queries without deadlock, negated fireability and UpperBounds, skipping BART-COL-040-LTLFireability-09
Warning: CPN OverApproximation is only available for Reachability queries without deadlock, negated fireability and UpperBounds, skipping BART-COL-040-LTLFireability-08
Warning: CPN OverApproximation is only available for Reachability queries without deadlock, negated fireability and UpperBounds, skipping BART-COL-040-LTLFireability-07
Warning: CPN OverApproximation is only available for Reachability queries without deadlock, negated fireability and UpperBounds, skipping BART-COL-040-LTLFireability-06
Warning: CPN OverApproximation is only available for Reachability queries without deadlock, negated fireability and UpperBounds, skipping BART-COL-040-LTLFireability-05
Warning: CPN OverApproximation is only available for Reachability queries without deadlock, negated fireability and UpperBounds, skipping BART-COL-040-LTLFireability-04
Warning: CPN OverApproximation is only available for Reachability queries without deadlock, negated fireability and UpperBounds, skipping BART-COL-040-LTLFireability-03
Warning: CPN OverApproximation is only available for Reachability queries without deadlock, negated fireability and UpperBounds, skipping BART-COL-040-LTLFireability-02
Warning: CPN OverApproximation is only available for Reachability queries without deadlock, negated fireability and UpperBounds, skipping BART-COL-040-LTLFireability-01
Warning: CPN OverApproximation is only available for Reachability queries without deadlock, negated fireability and UpperBounds, skipping BART-COL-040-LTLFireability-00
WARNING: Could not run CPN over-approximation on any queries, terminating.
Time left: 3590
---------------------------------------------------
Step 0: Parallel Simplification
---------------------------------------------------
Doing parallel simplification (16 in total)
Total simplification timout is 718 -- reduction timeout is 299
timeout 1017 /home/mcc/BenchKit/bin/verifypn -n -ltl -q 718 -l 29 -d 299 -z 4 -s OverApprox --binary-query-io 2 --write-simplified /home/mcc/BenchKit/bin/tmp/tmp.bli1k7beRh --write-reduced /home/mcc/BenchKit/bin/tmp/tmp.5T61nzVczy -x 1,2,3,4,5,6,7,8,9,10,11,12,13,14,15,16 ./model.pnml ./LTLFireability.xml
FORMULA BART-COL-040-LTLFireability-02 FALSE TECHNIQUES COLLATERAL_PROCESSING STRUCTURAL_REDUCTION QUERY_REDUCTION SAT_SMT LP_APPROX UNFOLDING_TO_PT
Query index 2 was solved
Query is NOT satisfied.
FORMULA BART-COL-040-LTLFireability-05 FALSE TECHNIQUES COLLATERAL_PROCESSING STRUCTURAL_REDUCTION QUERY_REDUCTION SAT_SMT LP_APPROX UNFOLDING_TO_PT
Query index 5 was solved
Query is NOT satisfied.
FORMULA BART-COL-040-LTLFireability-08 FALSE TECHNIQUES COLLATERAL_PROCESSING STRUCTURAL_REDUCTION QUERY_REDUCTION SAT_SMT LP_APPROX UNFOLDING_TO_PT
Query index 8 was solved
Query is NOT satisfied.
Solution found by parallel simplification (step 0)
Solution found by parallel simplification (step 0)
Solution found by parallel simplification (step 0)
Time left: 3588
---------------------------------------------------
Step 1: Parallel processing
---------------------------------------------------
Doing parallel verification of individual queries (13 in total)
Each query is verified by 4 parallel strategies for 299 seconds
------------------- QUERY 1 ----------------------
Solution found by parallel processing (step 1)
Query index 0 was solved
Query is NOT satisfied.
Spent 0.004075 on verification
@@@0.04,7372@@@
parallel: This job succeeded:
eval /usr/bin/time -f "@@@%e,%M@@@" /home/mcc/BenchKit/bin/verifypn -n -ltl\ tarjan\ --ltl-heur\ dist\ -q\ 0\ -l\ 0\ -d\ 119 /home/mcc/BenchKit/bin/tmp/tmp.5T61nzVczy /home/mcc/BenchKit/bin/tmp/tmp.bli1k7beRh --binary-query-io 1 -x 1 -n
FORMULA BART-COL-040-LTLFireability-00 FALSE TECHNIQUES COLLATERAL_PROCESSING STRUCTURAL_REDUCTION QUERY_REDUCTION SAT_SMT EXPLICIT STATE_COMPRESSION STUBBORN_SETS
Time left: 3587
------------------- QUERY 2 ----------------------
Solution found by parallel processing (step 1)
Query index 0 was solved
Query is NOT satisfied.
Spent 0.011854 on verification
@@@0.02,21864@@@
parallel: This job succeeded:
eval /usr/bin/time -f "@@@%e,%M@@@" /home/mcc/BenchKit/bin/verifypn -n -ltl\ ndfs\ -q\ 0\ -l\ 0\ -d\ 119 /home/mcc/BenchKit/bin/tmp/tmp.5T61nzVczy /home/mcc/BenchKit/bin/tmp/tmp.bli1k7beRh --binary-query-io 1 -x 2 -n
FORMULA BART-COL-040-LTLFireability-06 FALSE TECHNIQUES EXPLICIT NDFS WEAK_SKIP HEURISTIC AUTOMATON_HEUR OPTIM-1
Time left: 3587
------------------- QUERY 3 ----------------------
No solution found
Command terminated by signal 9
@@@217.01,5836764@@@
Time left: 3285
------------------- QUERY 4 ----------------------
Solution found by parallel processing (step 1)
Query index 0 was solved
Query is NOT satisfied.
Spent 0.026043 on verification
@@@0.36,21612@@@
parallel: This job succeeded:
eval /usr/bin/time -f "@@@%e,%M@@@" /home/mcc/BenchKit/bin/verifypn -n -ltl\ ndfs\ -q\ 0\ -l\ 0\ -d\ 119 /home/mcc/BenchKit/bin/tmp/tmp.5T61nzVczy /home/mcc/BenchKit/bin/tmp/tmp.bli1k7beRh --binary-query-io 1 -x 4 -n
FORMULA BART-COL-040-LTLFireability-13 FALSE TECHNIQUES EXPLICIT NDFS WEAK_SKIP HEURISTIC AUTOMATON_HEUR OPTIM-1
Time left: 3285
------------------- QUERY 5 ----------------------
Solution found by parallel processing (step 1)
Query index 0 was solved
Query is NOT satisfied.
Spent 0.068246 on verification
@@@1.06,149356@@@
parallel: This job succeeded:
eval /usr/bin/time -f "@@@%e,%M@@@" /home/mcc/BenchKit/bin/verifypn -n -ltl\ tarjan\ --ltl-heur\ fire-count\ -q\ 0\ -l\ 0\ -d\ 119 /home/mcc/BenchKit/bin/tmp/tmp.5T61nzVczy /home/mcc/BenchKit/bin/tmp/tmp.bli1k7beRh --binary-query-io 1 -x 5 -n
FORMULA BART-COL-040-LTLFireability-11 FALSE TECHNIQUES EXPLICIT TARJAN WEAK_SKIP STUBBORN AUT_STUB HEURISTIC LOGFIRECOUNT_HEUR(5000) OPTIM-1
Time left: 3283
------------------- QUERY 6 ----------------------
Solution found by parallel processing (step 1)
Query index 0 was solved
Query is NOT satisfied.
Spent 0.017742 on verification
@@@0.07,21500@@@
parallel: This job succeeded:
eval /usr/bin/time -f "@@@%e,%M@@@" /home/mcc/BenchKit/bin/verifypn -n -ltl\ ndfs\ -q\ 0\ -l\ 0\ -d\ 119 /home/mcc/BenchKit/bin/tmp/tmp.5T61nzVczy /home/mcc/BenchKit/bin/tmp/tmp.bli1k7beRh --binary-query-io 1 -x 6 -n
FORMULA BART-COL-040-LTLFireability-09 FALSE TECHNIQUES EXPLICIT NDFS WEAK_SKIP HEURISTIC AUTOMATON_HEUR OPTIM-1
Time left: 3283
------------------- QUERY 7 ----------------------
Solution found by parallel processing (step 1)
Query index 0 was solved
Query is NOT satisfied.
Spent 0.068653 on verification
@@@0.07,149188@@@
parallel: This job succeeded:
eval /usr/bin/time -f "@@@%e,%M@@@" /home/mcc/BenchKit/bin/verifypn -n -ltl\ tarjan\ --ltl-heur\ dist\ -q\ 0\ -l\ 0\ -d\ 119 /home/mcc/BenchKit/bin/tmp/tmp.5T61nzVczy /home/mcc/BenchKit/bin/tmp/tmp.bli1k7beRh --binary-query-io 1 -x 7 -n
FORMULA BART-COL-040-LTLFireability-03 FALSE TECHNIQUES EXPLICIT TARJAN WEAK_SKIP STUBBORN AUT_STUB HEURISTIC DIST_HEUR OPTIM-1
Time left: 3283
------------------- QUERY 8 ----------------------
Solution found by parallel processing (step 1)
Query index 0 was solved
Query is NOT satisfied.
Spent 0.044428 on verification
@@@0.05,21468@@@
parallel: This job succeeded:
eval /usr/bin/time -f "@@@%e,%M@@@" /home/mcc/BenchKit/bin/verifypn -n -ltl\ ndfs\ -q\ 0\ -l\ 0\ -d\ 119 /home/mcc/BenchKit/bin/tmp/tmp.5T61nzVczy /home/mcc/BenchKit/bin/tmp/tmp.bli1k7beRh --binary-query-io 1 -x 8 -n
FORMULA BART-COL-040-LTLFireability-12 FALSE TECHNIQUES EXPLICIT NDFS WEAK_SKIP HEURISTIC AUTOMATON_HEUR OPTIM-1
Time left: 3282
------------------- QUERY 9 ----------------------
Solution found by parallel processing (step 1)
Query index 0 was solved
Query is NOT satisfied.
Spent 0.026919 on verification
@@@0.05,23112@@@
parallel: This job succeeded:
eval /usr/bin/time -f "@@@%e,%M@@@" /home/mcc/BenchKit/bin/verifypn -n -ltl\ ndfs\ -q\ 0\ -l\ 0\ -d\ 119 /home/mcc/BenchKit/bin/tmp/tmp.5T61nzVczy /home/mcc/BenchKit/bin/tmp/tmp.bli1k7beRh --binary-query-io 1 -x 9 -n
FORMULA BART-COL-040-LTLFireability-15 FALSE TECHNIQUES EXPLICIT NDFS WEAK_SKIP HEURISTIC AUTOMATON_HEUR OPTIM-1
Time left: 3282
------------------- QUERY 10 ----------------------
Solution found by parallel processing (step 1)
Query index 0 was solved
Query is NOT satisfied.
Spent 0.068198 on verification
@@@0.07,150140@@@
FORMULA BART-COL-040-LTLFireability-10 FALSE TECHNIQUES EXPLICIT TARJAN WEAK_SKIP STUBBORN AUT_STUB HEURISTIC DIST_HEUR OPTIM-1
Query index 0 was solved
Query is NOT satisfied.
parallel: This job succeeded:
eval /usr/bin/time -f "@@@%e,%M@@@" /home/mcc/BenchKit/bin/verifypn -n -ltl\ tarjan\ --ltl-heur\ aut\ -s\ DFS\ -p\ -q\ 0\ -l\ 0\ -d\ 119 /home/mcc/BenchKit/bin/tmp/tmp.5T61nzVczy /home/mcc/BenchKit/bin/tmp/tmp.bli1k7beRh --binary-query-io 1 -x 10 -n
FORMULA BART-COL-040-LTLFireability-10 FALSE TECHNIQUES EXPLICIT TARJAN WEAK_SKIP OPTIM-1
Time left: 3282
------------------- QUERY 11 ----------------------
Solution found by parallel processing (step 1)
Query index 0 was solved
Query is NOT satisfied.
Spent 0.077537 on verification
@@@0.08,149848@@@
parallel: This job succeeded:
eval /usr/bin/time -f "@@@%e,%M@@@" /home/mcc/BenchKit/bin/verifypn -n -ltl\ tarjan\ --ltl-heur\ aut\ -s\ DFS\ -p\ -q\ 0\ -l\ 0\ -d\ 119 /home/mcc/BenchKit/bin/tmp/tmp.5T61nzVczy /home/mcc/BenchKit/bin/tmp/tmp.bli1k7beRh --binary-query-io 1 -x 11 -n
FORMULA BART-COL-040-LTLFireability-07 FALSE TECHNIQUES EXPLICIT TARJAN WEAK_SKIP OPTIM-1
Time left: 3281
------------------- QUERY 12 ----------------------
Solution found by parallel processing (step 1)
Query index 0 was solved
Query is NOT satisfied.
Spent 2.2033 on verification
@@@2.21,173860@@@
parallel: This job succeeded:
eval /usr/bin/time -f "@@@%e,%M@@@" /home/mcc/BenchKit/bin/verifypn -n -ltl\ tarjan\ --ltl-heur\ aut\ -s\ DFS\ -p\ -q\ 0\ -l\ 0\ -d\ 119 /home/mcc/BenchKit/bin/tmp/tmp.5T61nzVczy /home/mcc/BenchKit/bin/tmp/tmp.bli1k7beRh --binary-query-io 1 -x 12 -n
FORMULA BART-COL-040-LTLFireability-14 FALSE TECHNIQUES EXPLICIT TARJAN WEAK_SKIP OPTIM-1
Time left: 3279
------------------- QUERY 13 ----------------------
Solution found by parallel processing (step 1)
Query index 0 was solved
Query is NOT satisfied.
Spent 0.022224 on verification
@@@0.03,23404@@@
parallel: This job succeeded:
eval /usr/bin/time -f "@@@%e,%M@@@" /home/mcc/BenchKit/bin/verifypn -n -ltl\ ndfs\ -q\ 0\ -l\ 0\ -d\ 119 /home/mcc/BenchKit/bin/tmp/tmp.5T61nzVczy /home/mcc/BenchKit/bin/tmp/tmp.bli1k7beRh --binary-query-io 1 -x 13 -n
FORMULA BART-COL-040-LTLFireability-01 FALSE TECHNIQUES EXPLICIT NDFS WEAK_SKIP HEURISTIC AUTOMATON_HEUR OPTIM-1
Time left: 3279
---------------------------------------------------
Step 2: Sequential processing
---------------------------------------------------
Remaining 1 queries are verified sequentially.
Each query is verified for a dynamic timeout (at least 598 seconds)
Time left: 3279
------------------- QUERY 3 ----------------------
Running query 3 for 3279 seconds. Remaining: 1 queries and 3279 seconds
No solution found
Command terminated by signal 9
@@@792.00,16146220@@@
Time left: 2486
Time left: 2486
---------------------------------------------------
Step 4: Random Parallel processing
---------------------------------------------------
Doing random parallel verification of individual queries (1 in total)
Each query is verified by 4 parallel strategies for 2486 seconds
------------------- QUERY 3 ----------------------
No solution found
Command terminated by signal 9
@@@112.68,4359664@@@
Command terminated by signal 9
@@@157.85,5937660@@@
Command terminated by signal 9
@@@215.62,10446244@@@
terminate called after throwing an instance of 'std::bad_alloc'
what(): std::bad_alloc
Command terminated by signal 6
@@@421.34,15252932@@@
Time left: 2065
Time left: 2065
---------------------------------------------------
Step 4: Random Parallel processing
---------------------------------------------------
Doing random parallel verification of individual queries (1 in total)
Each query is verified by 4 parallel strategies for 2065 seconds
------------------- QUERY 3 ----------------------
No solution found
Command terminated by signal 9
@@@114.90,4348984@@@
Command terminated by signal 9
@@@162.32,5765948@@@
Command terminated by signal 9
@@@225.36,10446848@@@
terminate called after throwing an instance of 'std::bad_alloc'
what(): std::bad_alloc
Command terminated by signal 6
@@@433.38,15247464@@@
Time left: 1631
Time left: 1631
---------------------------------------------------
Step 4: Random Parallel processing
---------------------------------------------------
Doing random parallel verification of individual queries (1 in total)
Each query is verified by 4 parallel strategies for 1631 seconds
------------------- QUERY 3 ----------------------
No solution found
Command terminated by signal 9
@@@110.02,4261856@@@
Command terminated by signal 9
@@@155.09,5837200@@@
Command terminated by signal 9
@@@197.23,8443692@@@
terminate called after throwing an instance of 'std::bad_alloc'
what(): std::bad_alloc
Command terminated by signal 6
@@@393.50,15250128@@@
Time left: 1237
Time left: 1237
---------------------------------------------------
Step 4: Random Parallel processing
---------------------------------------------------
Doing random parallel verification of individual queries (1 in total)
Each query is verified by 4 parallel strategies for 1237 seconds
------------------- QUERY 3 ----------------------
No solution found
Command terminated by signal 9
@@@111.51,4231212@@@
Command terminated by signal 9
@@@158.56,5597916@@@
Command terminated by signal 9
@@@199.89,8519828@@@
terminate called after throwing an instance of 'std::bad_alloc'
what(): std::bad_alloc
Command terminated by signal 6
@@@406.22,15253800@@@
Time left: 830
Time left: 830
---------------------------------------------------
Step 4: Random Parallel processing
---------------------------------------------------
Doing random parallel verification of individual queries (1 in total)
Each query is verified by 4 parallel strategies for 830 seconds
------------------- QUERY 3 ----------------------
No solution found
Command terminated by signal 9
@@@109.20,4263276@@@
Command terminated by signal 9
@@@156.39,5773684@@@
Command terminated by signal 9
@@@224.49,10445876@@@
terminate called after throwing an instance of 'std::bad_alloc'
what(): std::bad_alloc
Command terminated by signal 6
@@@449.30,15252144@@@
Time left: 381
Time left: 381
---------------------------------------------------
Step 4: Random Parallel processing
---------------------------------------------------
Doing random parallel verification of individual queries (1 in total)
Each query is verified by 4 parallel strategies for 381 seconds
------------------- QUERY 3 ----------------------
No solution found
Command terminated by signal 9
@@@118.56,4302432@@@
Command terminated by signal 9
@@@165.84,5769608@@@
Command terminated by signal 9
@@@213.80,9920760@@@
Time left: -3
Out of time, terminating!
terminated-with-cleanup
BK_STOP 1678453336618
--------------------
content from stderr:
Sequence of Actions to be Executed by the VM
This is useful if one wants to reexecute the tool in the VM from the submitted image disk.
set -x
# this is for BenchKit: configuration of major elements for the test
export BK_INPUT="BART-COL-040"
export BK_EXAMINATION="LTLFireability"
export BK_TOOL="gold2022"
export BK_RESULT_DIR="/tmp/BK_RESULTS/OUTPUTS"
export BK_TIME_CONFINEMENT="3600"
export BK_MEMORY_CONFINEMENT="16384"
export BK_BIN_PATH="/home/mcc/BenchKit/bin/"
# this is specific to your benchmark or test
export BIN_DIR="$HOME/BenchKit/bin"
# remove the execution directoty if it exists (to avoid increse of .vmdk images)
if [ -d execution ] ; then
rm -rf execution
fi
# this is for BenchKit: explicit launching of the test
echo "====================================================================="
echo " Generated by BenchKit 2-5348"
echo " Executing tool gold2022"
echo " Input is BART-COL-040, examination is LTLFireability"
echo " Time confinement is $BK_TIME_CONFINEMENT seconds"
echo " Memory confinement is 16384 MBytes"
echo " Number of cores is 4"
echo " Run identifier is r030-oct2-167813615200550"
echo "====================================================================="
echo
echo "--------------------"
echo "preparation of the directory to be used:"
tar xzf /home/mcc/BenchKit/INPUTS/BART-COL-040.tgz
mv BART-COL-040 execution
cd execution
if [ "LTLFireability" = "ReachabilityDeadlock" ] || [ "LTLFireability" = "UpperBounds" ] || [ "LTLFireability" = "QuasiLiveness" ] || [ "LTLFireability" = "StableMarking" ] || [ "LTLFireability" = "Liveness" ] || [ "LTLFireability" = "OneSafe" ] || [ "LTLFireability" = "StateSpace" ]; then
rm -f GenericPropertiesVerdict.xml
fi
pwd
ls -lh
echo
echo "--------------------"
echo "content from stdout:"
echo
echo "=== Data for post analysis generated by BenchKit (invocation template)"
echo
if [ "LTLFireability" = "UpperBounds" ] ; then
echo "The expected result is a vector of positive values"
echo NUM_VECTOR
elif [ "LTLFireability" != "StateSpace" ] ; then
echo "The expected result is a vector of booleans"
echo BOOL_VECTOR
else
echo "no data necessary for post analysis"
fi
echo
if [ -f "LTLFireability.txt" ] ; then
echo "here is the order used to build the result vector(from text file)"
for x in $(grep Property LTLFireability.txt | cut -d ' ' -f 2 | sort -u) ; do
echo "FORMULA_NAME $x"
done
elif [ -f "LTLFireability.xml" ] ; then # for cunf (txt files deleted;-)
echo echo "here is the order used to build the result vector(from xml file)"
for x in $(grep '
echo "FORMULA_NAME $x"
done
elif [ "LTLFireability" = "ReachabilityDeadlock" ] || [ "LTLFireability" = "QuasiLiveness" ] || [ "LTLFireability" = "StableMarking" ] || [ "LTLFireability" = "Liveness" ] || [ "LTLFireability" = "OneSafe" ] ; then
echo "FORMULA_NAME LTLFireability"
fi
echo
echo "=== Now, execution of the tool begins"
echo
echo -n "BK_START "
date -u +%s%3N
echo
timeout -s 9 $BK_TIME_CONFINEMENT bash -c "/home/mcc/BenchKit/BenchKit_head.sh 2> STDERR ; echo ; echo -n \"BK_STOP \" ; date -u +%s%3N"
if [ $? -eq 137 ] ; then
echo
echo "BK_TIME_CONFINEMENT_REACHED"
fi
echo
echo "--------------------"
echo "content from stderr:"
echo
cat STDERR ;