

About the Execution of 2022-gold for PGCD-COL-D02N100
| Execution Summary | |||||
| Max Memory Used (MB) |
Time wait (ms) | CPU Usage (ms) | I/O Wait (ms) | Computed Result | Execution Status |
| 16225.252 | 3592586.00 | 8549527.00 | 12950.90 | FT??T??FF?T?FF?T | normal |
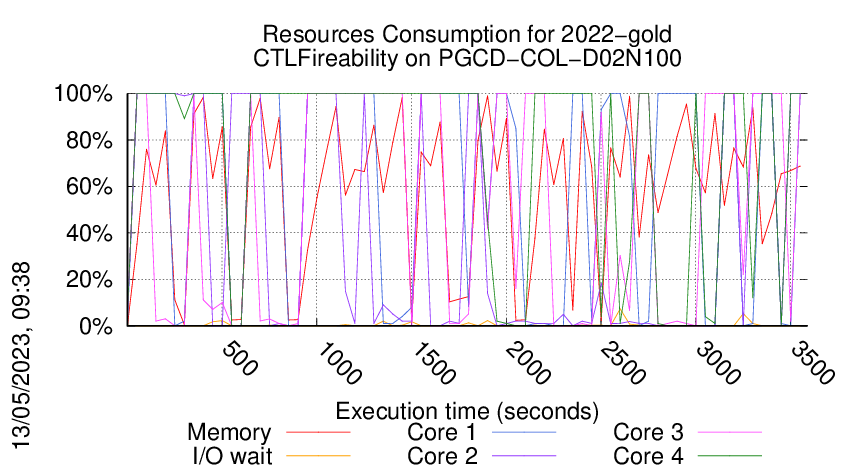
Execution Chart
We display below the execution chart for this examination (boot time has been removed).
Trace from the execution
Formatting '/data/fkordon/mcc2023-input.r542-tall-167987257100296.qcow2', fmt=qcow2 size=4294967296 backing_file=/data/fkordon/mcc2023-input.qcow2 cluster_size=65536 lazy_refcounts=off refcount_bits=16
Waiting for the VM to be ready (probing ssh)
.............
=====================================================================
Generated by BenchKit 2-5348
Executing tool gold2022
Input is PGCD-COL-D02N100, examination is CTLFireability
Time confinement is 3600 seconds
Memory confinement is 16384 MBytes
Number of cores is 4
Run identifier is r542-tall-167987257100296
=====================================================================
--------------------
preparation of the directory to be used:
/home/mcc/execution
total 380K
-rw-r--r-- 1 mcc users 5.8K Mar 23 15:25 CTLCardinality.txt
-rw-r--r-- 1 mcc users 59K Mar 23 15:25 CTLCardinality.xml
-rw-r--r-- 1 mcc users 4.7K Mar 23 15:21 CTLFireability.txt
-rw-r--r-- 1 mcc users 43K Mar 23 15:21 CTLFireability.xml
-rw-r--r-- 1 mcc users 5 Mar 26 22:42 equiv_pt
-rw-r--r-- 1 mcc users 8 Mar 26 22:42 instance
-rw-r--r-- 1 mcc users 5 Mar 26 22:42 iscolored
-rw-r--r-- 1 mcc users 3.3K Mar 23 07:07 LTLCardinality.txt
-rw-r--r-- 1 mcc users 24K Mar 23 07:07 LTLCardinality.xml
-rw-r--r-- 1 mcc users 2.0K Mar 23 07:07 LTLFireability.txt
-rw-r--r-- 1 mcc users 17K Mar 23 07:07 LTLFireability.xml
-rw-r--r-- 1 mcc users 16K Mar 26 22:42 model.pnml
-rw-r--r-- 1 mcc users 1 Mar 26 22:42 NewModel
-rw-r--r-- 1 mcc users 7.5K Mar 23 15:28 ReachabilityCardinality.txt
-rw-r--r-- 1 mcc users 77K Mar 23 15:28 ReachabilityCardinality.xml
-rw-r--r-- 1 mcc users 7.7K Mar 23 15:27 ReachabilityFireability.txt
-rw-r--r-- 1 mcc users 71K Mar 23 15:27 ReachabilityFireability.xml
-rw-r--r-- 1 mcc users 1.6K Mar 23 07:07 UpperBounds.txt
-rw-r--r-- 1 mcc users 3.6K Mar 23 07:07 UpperBounds.xml
--------------------
content from stdout:
=== Data for post analysis generated by BenchKit (invocation template)
The expected result is a vector of booleans
BOOL_VECTOR
here is the order used to build the result vector(from text file)
FORMULA_NAME PGCD-COL-D02N100-CTLFireability-00
FORMULA_NAME PGCD-COL-D02N100-CTLFireability-01
FORMULA_NAME PGCD-COL-D02N100-CTLFireability-02
FORMULA_NAME PGCD-COL-D02N100-CTLFireability-03
FORMULA_NAME PGCD-COL-D02N100-CTLFireability-04
FORMULA_NAME PGCD-COL-D02N100-CTLFireability-05
FORMULA_NAME PGCD-COL-D02N100-CTLFireability-06
FORMULA_NAME PGCD-COL-D02N100-CTLFireability-07
FORMULA_NAME PGCD-COL-D02N100-CTLFireability-08
FORMULA_NAME PGCD-COL-D02N100-CTLFireability-09
FORMULA_NAME PGCD-COL-D02N100-CTLFireability-10
FORMULA_NAME PGCD-COL-D02N100-CTLFireability-11
FORMULA_NAME PGCD-COL-D02N100-CTLFireability-12
FORMULA_NAME PGCD-COL-D02N100-CTLFireability-13
FORMULA_NAME PGCD-COL-D02N100-CTLFireability-14
FORMULA_NAME PGCD-COL-D02N100-CTLFireability-15
=== Now, execution of the tool begins
BK_START 1680013936411
gold2022
Got BK_BIN_PATH=/home/mcc/BenchKit/bin/
---> gold2022 --- TAPAAL v5
Setting MODEL_PATH=.
Setting VERIFYPN=/home/mcc/BenchKit/bin/verifypn
Got BK_TIME_CONFINEMENT=3600
Setting TEMPDIR=/home/mcc/BenchKit/bin/tmp
Got BK_MEMORY_CONFINEMENT=16384
Limiting to 16265216 kB
Total timeout: 3590
Time left: 3590
*************************************
* TAPAAL verifying CTLFireability *
*************************************
TEMPDIR=/home/mcc/BenchKit/bin/tmp
QF=/home/mcc/BenchKit/bin/tmp/tmp.PHJRMqRJC4
MF=/home/mcc/BenchKit/bin/tmp/tmp.YCnItf0O0p
Time left: 3590
---------------------------------------------------
Step -1: Stripping Colors
---------------------------------------------------
Verifying stripped models (16 in total)
/home/mcc/BenchKit/bin/verifypn -n -c -q 718 -l 29 -d 299 -z 4 -x 1,2,3,4,5,6,7,8,9,10,11,12,13,14,15,16 ./model.pnml ./CTLFireability.xml
Warning: CPN OverApproximation is only available for Reachability queries without deadlock, negated fireability and UpperBounds, skipping PGCD-COL-D02N100-CTLFireability-15
Warning: CPN OverApproximation is only available for Reachability queries without deadlock, negated fireability and UpperBounds, skipping PGCD-COL-D02N100-CTLFireability-14
Warning: CPN OverApproximation is only available for Reachability queries without deadlock, negated fireability and UpperBounds, skipping PGCD-COL-D02N100-CTLFireability-13
Warning: CPN OverApproximation is only available for Reachability queries without deadlock, negated fireability and UpperBounds, skipping PGCD-COL-D02N100-CTLFireability-12
Warning: CPN OverApproximation is only available for Reachability queries without deadlock, negated fireability and UpperBounds, skipping PGCD-COL-D02N100-CTLFireability-11
Warning: CPN OverApproximation is only available for Reachability queries without deadlock, negated fireability and UpperBounds, skipping PGCD-COL-D02N100-CTLFireability-10
Warning: CPN OverApproximation is only available for Reachability queries without deadlock, negated fireability and UpperBounds, skipping PGCD-COL-D02N100-CTLFireability-09
Warning: CPN OverApproximation is only available for Reachability queries without deadlock, negated fireability and UpperBounds, skipping PGCD-COL-D02N100-CTLFireability-08
Warning: CPN OverApproximation is only available for Reachability queries without deadlock, negated fireability and UpperBounds, skipping PGCD-COL-D02N100-CTLFireability-07
Warning: CPN OverApproximation is only available for Reachability queries without deadlock, negated fireability and UpperBounds, skipping PGCD-COL-D02N100-CTLFireability-06
Warning: CPN OverApproximation is only available for Reachability queries without deadlock, negated fireability and UpperBounds, skipping PGCD-COL-D02N100-CTLFireability-05
Warning: CPN OverApproximation is only available for Reachability queries without deadlock, negated fireability and UpperBounds, skipping PGCD-COL-D02N100-CTLFireability-04
Warning: CPN OverApproximation is only available for Reachability queries without deadlock, negated fireability and UpperBounds, skipping PGCD-COL-D02N100-CTLFireability-03
Warning: CPN OverApproximation is only available for Reachability queries without deadlock, negated fireability and UpperBounds, skipping PGCD-COL-D02N100-CTLFireability-02
Warning: CPN OverApproximation is only available for Reachability queries without deadlock, negated fireability and UpperBounds, skipping PGCD-COL-D02N100-CTLFireability-01
Warning: CPN OverApproximation is only available for Reachability queries without deadlock, negated fireability and UpperBounds, skipping PGCD-COL-D02N100-CTLFireability-00
WARNING: Could not run CPN over-approximation on any queries, terminating.
Time left: 3590
---------------------------------------------------
Step 0: Parallel Simplification
---------------------------------------------------
Doing parallel simplification (16 in total)
Total simplification timout is 718 -- reduction timeout is 299
timeout 3590 /home/mcc/BenchKit/bin/verifypn -n -q 718 -l 29 -d 299 -z 4 -s OverApprox --binary-query-io 2 --write-simplified /home/mcc/BenchKit/bin/tmp/tmp.PHJRMqRJC4 --write-reduced /home/mcc/BenchKit/bin/tmp/tmp.YCnItf0O0p -x 1,2,3,4,5,6,7,8,9,10,11,12,13,14,15,16 ./model.pnml ./CTLFireability.xml
FORMULA PGCD-COL-D02N100-CTLFireability-08 FALSE TECHNIQUES COLLATERAL_PROCESSING STRUCTURAL_REDUCTION QUERY_REDUCTION SAT_SMT LP_APPROX UNFOLDING_TO_PT
Query index 8 was solved
Query is NOT satisfied.
Solution found by parallel simplification (step 0)
Time left: 3590
---------------------------------------------------
Step 1: Parallel processing
---------------------------------------------------
Doing parallel verification of individual queries (15 in total)
Each query is verified by 4 parallel strategies for 299 seconds
------------------- QUERY 1 ----------------------
No solution found
Command terminated by signal 9
@@@133.64,7508696@@@
Command terminated by signal 9
@@@236.43,14438884@@@
Time left: 3288
------------------- QUERY 2 ----------------------
Solution found by parallel processing (step 1)
Query index 0 was solved
Query is NOT satisfied.
Spent 0.067947 on verification
@@@0.09,59236@@@
parallel: This job succeeded:
eval /usr/bin/time -f "@@@%e,%M@@@" /home/mcc/BenchKit/bin/verifypn -n -s\ BFS\ -q\ 0\ -l\ 0\ -d\ 119 /home/mcc/BenchKit/bin/tmp/tmp.YCnItf0O0p /home/mcc/BenchKit/bin/tmp/tmp.PHJRMqRJC4 --binary-query-io 1 -x 2 -n
FORMULA PGCD-COL-D02N100-CTLFireability-00 FALSE TECHNIQUES COLLATERAL_PROCESSING EXPLICIT STATE_COMPRESSION SAT_SMT STUBBORN_SETS CTL_CZERO
Time left: 3287
------------------- QUERY 3 ----------------------
No solution found
Command terminated by signal 9
@@@53.65,8458248@@@
Command terminated by signal 9
@@@99.18,9348284@@@
Command terminated by signal 9
@@@228.64,15811008@@@
Time left: 2985
------------------- QUERY 4 ----------------------
No solution found
Command terminated by signal 9
@@@57.40,7007240@@@
Command terminated by signal 9
@@@97.79,8684528@@@
Command terminated by signal 9
@@@217.01,15819584@@@
Time left: 2684
------------------- QUERY 5 ----------------------
No solution found
Command terminated by signal 9
@@@208.37,8595296@@@
Time left: 2382
------------------- QUERY 6 ----------------------
Solution found by parallel processing (step 1)
Query index 0 was solved
Query is satisfied.
Spent 0.093716 on verification
@@@0.11,59308@@@
parallel: This job succeeded:
eval /usr/bin/time -f "@@@%e,%M@@@" /home/mcc/BenchKit/bin/verifypn -n -s\ BFS\ -q\ 0\ -l\ 0\ -d\ 119 /home/mcc/BenchKit/bin/tmp/tmp.YCnItf0O0p /home/mcc/BenchKit/bin/tmp/tmp.PHJRMqRJC4 --binary-query-io 1 -x 6 -n
FORMULA PGCD-COL-D02N100-CTLFireability-10 TRUE TECHNIQUES COLLATERAL_PROCESSING EXPLICIT STATE_COMPRESSION SAT_SMT STUBBORN_SETS CTL_CZERO
Time left: 2382
------------------- QUERY 7 ----------------------
No solution found
Command terminated by signal 9
@@@62.95,7154460@@@
Command terminated by signal 9
@@@108.90,9548652@@@
Command terminated by signal 9
@@@246.77,15838668@@@
Time left: 2080
------------------- QUERY 8 ----------------------
Solution found by parallel processing (step 1)
Query index 0 was solved
Query is satisfied.
Spent 0.068892 on verification
@@@0.08,59492@@@
parallel: This job succeeded:
eval /usr/bin/time -f "@@@%e,%M@@@" /home/mcc/BenchKit/bin/verifypn -n -s\ BestFS\ -q\ 0\ -l\ 0\ -d\ 119 /home/mcc/BenchKit/bin/tmp/tmp.YCnItf0O0p /home/mcc/BenchKit/bin/tmp/tmp.PHJRMqRJC4 --binary-query-io 1 -x 8 -n
FORMULA PGCD-COL-D02N100-CTLFireability-01 TRUE TECHNIQUES COLLATERAL_PROCESSING EXPLICIT STATE_COMPRESSION SAT_SMT STUBBORN_SETS CTL_CZERO
Time left: 2080
------------------- QUERY 9 ----------------------
Solution found by parallel processing (step 1)
Query index 0 was solved
Query is NOT satisfied.
Spent 0.078208 on verification
@@@0.08,59160@@@
parallel: This job succeeded:
eval /usr/bin/time -f "@@@%e,%M@@@" /home/mcc/BenchKit/bin/verifypn -n -s\ BestFS\ -q\ 0\ -l\ 0\ -d\ 119 /home/mcc/BenchKit/bin/tmp/tmp.YCnItf0O0p /home/mcc/BenchKit/bin/tmp/tmp.PHJRMqRJC4 --binary-query-io 1 -x 9 -n
FORMULA PGCD-COL-D02N100-CTLFireability-07 FALSE TECHNIQUES COLLATERAL_PROCESSING EXPLICIT STATE_COMPRESSION SAT_SMT STUBBORN_SETS CTL_CZERO
Time left: 2080
------------------- QUERY 10 ----------------------
Solution found by parallel processing (step 1)
Query index 0 was solved
Query is satisfied.
Spent 0.092903 on verification
@@@0.10,59244@@@
Query index 0 was solved
Query is satisfied.
Spent 0.087941 on verification
@@@0.09,59348@@@
parallel: This job succeeded:
eval /usr/bin/time -f "@@@%e,%M@@@" /home/mcc/BenchKit/bin/verifypn -n -tar\ -s\ RDFS\ -q\ 0\ -l\ 0\ -d\ 119 /home/mcc/BenchKit/bin/tmp/tmp.YCnItf0O0p /home/mcc/BenchKit/bin/tmp/tmp.PHJRMqRJC4 --binary-query-io 1 -x 10 -n
parallel: This job succeeded:
eval /usr/bin/time -f "@@@%e,%M@@@" /home/mcc/BenchKit/bin/verifypn -n -s\ BestFS\ -q\ 0\ -l\ 0\ -d\ 119 /home/mcc/BenchKit/bin/tmp/tmp.YCnItf0O0p /home/mcc/BenchKit/bin/tmp/tmp.PHJRMqRJC4 --binary-query-io 1 -x 10 -n
FORMULA PGCD-COL-D02N100-CTLFireability-15 TRUE TECHNIQUES COLLATERAL_PROCESSING EXPLICIT STATE_COMPRESSION SAT_SMT STUBBORN_SETS CTL_CZERO
Time left: 2079
------------------- QUERY 11 ----------------------
Solution found by parallel processing (step 1)
Query index 0 was solved
Query is NOT satisfied.
Spent 0.063202 on verification
@@@0.07,59336@@@
parallel: This job succeeded:
eval /usr/bin/time -f "@@@%e,%M@@@" /home/mcc/BenchKit/bin/verifypn -n -s\ BestFS\ -q\ 0\ -l\ 0\ -d\ 119 /home/mcc/BenchKit/bin/tmp/tmp.YCnItf0O0p /home/mcc/BenchKit/bin/tmp/tmp.PHJRMqRJC4 --binary-query-io 1 -x 11 -n
FORMULA PGCD-COL-D02N100-CTLFireability-12 FALSE TECHNIQUES COLLATERAL_PROCESSING EXPLICIT STATE_COMPRESSION SAT_SMT STUBBORN_SETS CTL_CZERO
Time left: 2079
------------------- QUERY 12 ----------------------
Solution found by parallel processing (step 1)
Query index 0 was solved
Query is satisfied.
Spent 0.04647 on verification
Query index 0 was solved
Query is satisfied.
Spent 0.05897 on verification
@@@0.06,59308@@@
@@@0.06,59228@@@
parallel: This job succeeded:
eval /usr/bin/time -f "@@@%e,%M@@@" /home/mcc/BenchKit/bin/verifypn -n -tar\ -s\ RDFS\ -q\ 0\ -l\ 0\ -d\ 119 /home/mcc/BenchKit/bin/tmp/tmp.YCnItf0O0p /home/mcc/BenchKit/bin/tmp/tmp.PHJRMqRJC4 --binary-query-io 1 -x 12 -n
parallel: This job succeeded:
eval /usr/bin/time -f "@@@%e,%M@@@" /home/mcc/BenchKit/bin/verifypn -n -s\ BestFS\ -q\ 0\ -l\ 0\ -d\ 119 /home/mcc/BenchKit/bin/tmp/tmp.YCnItf0O0p /home/mcc/BenchKit/bin/tmp/tmp.PHJRMqRJC4 --binary-query-io 1 -x 12 -n
FORMULA PGCD-COL-D02N100-CTLFireability-04 TRUE TECHNIQUES COLLATERAL_PROCESSING EXPLICIT STATE_COMPRESSION SAT_SMT STUBBORN_SETS CTL_CZERO
Time left: 2079
------------------- QUERY 13 ----------------------
No solution found
Command terminated by signal 9
@@@55.56,8947716@@@
Command terminated by signal 9
@@@161.87,14667256@@@
Time left: 1778
------------------- QUERY 14 ----------------------
Solution found by parallel processing (step 1)
Query index 0 was solved
Query is NOT satisfied.
Spent 0.065939 on verification
Query index 0 was solved
Query is NOT satisfied.
Spent 0.069242 on verification
@@@0.08,59296@@@
@@@0.08,59452@@@
parallel: This job succeeded:
eval /usr/bin/time -f "@@@%e,%M@@@" /home/mcc/BenchKit/bin/verifypn -n -s\ BFS\ -q\ 0\ -l\ 0\ -d\ 119 /home/mcc/BenchKit/bin/tmp/tmp.YCnItf0O0p /home/mcc/BenchKit/bin/tmp/tmp.PHJRMqRJC4 --binary-query-io 1 -x 14 -n
parallel: This job succeeded:
eval /usr/bin/time -f "@@@%e,%M@@@" /home/mcc/BenchKit/bin/verifypn -n -s\ DFS\ -q\ 0\ -l\ 0\ -d\ 119 /home/mcc/BenchKit/bin/tmp/tmp.YCnItf0O0p /home/mcc/BenchKit/bin/tmp/tmp.PHJRMqRJC4 --binary-query-io 1 -x 14 -n
FORMULA PGCD-COL-D02N100-CTLFireability-13 FALSE TECHNIQUES COLLATERAL_PROCESSING EXPLICIT STATE_COMPRESSION SAT_SMT STUBBORN_SETS CTL_CZERO
Time left: 1777
------------------- QUERY 15 ----------------------
No solution found
Command terminated by signal 9
@@@51.55,6868804@@@
Command terminated by signal 9
@@@91.43,9185168@@@
Command terminated by signal 9
@@@213.00,15834712@@@
Time left: 1476
---------------------------------------------------
Step 2: Sequential processing
---------------------------------------------------
Remaining 7 queries are verified sequentially.
Each query is verified for a dynamic timeout (at least 598 seconds)
Time left: 1476
------------------- QUERY 1 ----------------------
Running query 1 for 598 seconds. Remaining: 7 queries and 1476 seconds
No solution found
Command terminated by signal 9
@@@103.59,8645112@@@
Command terminated by signal 9
@@@235.14,16146868@@@
Time left: 1240
------------------- QUERY 3 ----------------------
Running query 3 for 598 seconds. Remaining: 6 queries and 1240 seconds
No solution found
Command terminated by signal 9
@@@57.72,9904508@@@
Command terminated by signal 9
@@@152.14,16142800@@@
Time left: 1088
------------------- QUERY 4 ----------------------
Running query 4 for 598 seconds. Remaining: 5 queries and 1088 seconds
No solution found
Command terminated by signal 9
@@@65.05,9788324@@@
Command terminated by signal 9
@@@152.69,16144436@@@
Time left: 935
------------------- QUERY 5 ----------------------
Running query 5 for 598 seconds. Remaining: 4 queries and 935 seconds
No solution found
Command terminated by signal 9
@@@134.53,8888704@@@
Command terminated by signal 9
@@@310.48,16142440@@@
Time left: 624
------------------- QUERY 7 ----------------------
Running query 7 for 598 seconds. Remaining: 3 queries and 624 seconds
No solution found
Command terminated by signal 9
@@@55.85,10292228@@@
Command terminated by signal 9
@@@150.90,16144704@@@
Time left: 473
------------------- QUERY 13 ----------------------
Time left: 473
---------------------------------------------------
Step 4: Random Parallel processing
---------------------------------------------------
Doing random parallel verification of individual queries (7 in total)
Each query is verified by 4 parallel strategies for 67 seconds
------------------- QUERY 1 ----------------------
No solution found
Command terminated by signal 9
@@@65.74,4303324@@@
Time left: 404
------------------- QUERY 3 ----------------------
No solution found
Command terminated by signal 9
@@@23.21,4139348@@@
Command terminated by signal 9
@@@31.37,5403512@@@
Command terminated by signal 9
@@@48.46,8094960@@@
Time left: 334
------------------- QUERY 4 ----------------------
No solution found
Command terminated by signal 9
@@@23.30,4251076@@@
Command terminated by signal 9
@@@34.42,5620128@@@
Command terminated by signal 9
@@@51.91,8085420@@@
Time left: 264
------------------- QUERY 5 ----------------------
No solution found
Time left: 195
------------------- QUERY 7 ----------------------
No solution found
Command terminated by signal 9
@@@21.26,4111816@@@
Command terminated by signal 9
@@@28.96,5388272@@@
Command terminated by signal 9
@@@44.42,8096012@@@
Time left: 126
------------------- QUERY 13 ----------------------
No solution found
Command terminated by signal 9
@@@28.09,4453912@@@
Command terminated by signal 9
@@@39.47,5678648@@@
Command terminated by signal 9
@@@57.15,8275224@@@
Time left: 55
------------------- QUERY 15 ----------------------
No solution found
Command terminated by signal 9
@@@30.58,4541492@@@
Command terminated by signal 9
@@@39.93,5849272@@@
Time left: -2
Out of time, terminating!
terminated-with-cleanup
BK_STOP 1680017528997
--------------------
content from stderr:
Sequence of Actions to be Executed by the VM
This is useful if one wants to reexecute the tool in the VM from the submitted image disk.
set -x
# this is for BenchKit: configuration of major elements for the test
export BK_INPUT="PGCD-COL-D02N100"
export BK_EXAMINATION="CTLFireability"
export BK_TOOL="gold2022"
export BK_RESULT_DIR="/tmp/BK_RESULTS/OUTPUTS"
export BK_TIME_CONFINEMENT="3600"
export BK_MEMORY_CONFINEMENT="16384"
export BK_BIN_PATH="/home/mcc/BenchKit/bin/"
# this is specific to your benchmark or test
export BIN_DIR="$HOME/BenchKit/bin"
# remove the execution directoty if it exists (to avoid increse of .vmdk images)
if [ -d execution ] ; then
rm -rf execution
fi
# this is for BenchKit: explicit launching of the test
echo "====================================================================="
echo " Generated by BenchKit 2-5348"
echo " Executing tool gold2022"
echo " Input is PGCD-COL-D02N100, examination is CTLFireability"
echo " Time confinement is $BK_TIME_CONFINEMENT seconds"
echo " Memory confinement is 16384 MBytes"
echo " Number of cores is 4"
echo " Run identifier is r542-tall-167987257100296"
echo "====================================================================="
echo
echo "--------------------"
echo "preparation of the directory to be used:"
tar xzf /home/mcc/BenchKit/INPUTS/PGCD-COL-D02N100.tgz
mv PGCD-COL-D02N100 execution
cd execution
if [ "CTLFireability" = "ReachabilityDeadlock" ] || [ "CTLFireability" = "UpperBounds" ] || [ "CTLFireability" = "QuasiLiveness" ] || [ "CTLFireability" = "StableMarking" ] || [ "CTLFireability" = "Liveness" ] || [ "CTLFireability" = "OneSafe" ] || [ "CTLFireability" = "StateSpace" ]; then
rm -f GenericPropertiesVerdict.xml
fi
pwd
ls -lh
echo
echo "--------------------"
echo "content from stdout:"
echo
echo "=== Data for post analysis generated by BenchKit (invocation template)"
echo
if [ "CTLFireability" = "UpperBounds" ] ; then
echo "The expected result is a vector of positive values"
echo NUM_VECTOR
elif [ "CTLFireability" != "StateSpace" ] ; then
echo "The expected result is a vector of booleans"
echo BOOL_VECTOR
else
echo "no data necessary for post analysis"
fi
echo
if [ -f "CTLFireability.txt" ] ; then
echo "here is the order used to build the result vector(from text file)"
for x in $(grep Property CTLFireability.txt | cut -d ' ' -f 2 | sort -u) ; do
echo "FORMULA_NAME $x"
done
elif [ -f "CTLFireability.xml" ] ; then # for cunf (txt files deleted;-)
echo echo "here is the order used to build the result vector(from xml file)"
for x in $(grep '
echo "FORMULA_NAME $x"
done
elif [ "CTLFireability" = "ReachabilityDeadlock" ] || [ "CTLFireability" = "QuasiLiveness" ] || [ "CTLFireability" = "StableMarking" ] || [ "CTLFireability" = "Liveness" ] || [ "CTLFireability" = "OneSafe" ] ; then
echo "FORMULA_NAME CTLFireability"
fi
echo
echo "=== Now, execution of the tool begins"
echo
echo -n "BK_START "
date -u +%s%3N
echo
timeout -s 9 $BK_TIME_CONFINEMENT bash -c "/home/mcc/BenchKit/BenchKit_head.sh 2> STDERR ; echo ; echo -n \"BK_STOP \" ; date -u +%s%3N"
if [ $? -eq 137 ] ; then
echo
echo "BK_TIME_CONFINEMENT_REACHED"
fi
echo
echo "--------------------"
echo "content from stderr:"
echo
cat STDERR ;