

About the Execution of 2022-gold for BART-PT-010
| Execution Summary | |||||
| Max Memory Used (MB) |
Time wait (ms) | CPU Usage (ms) | I/O Wait (ms) | Computed Result | Execution Status |
| 16225.863 | 3591798.00 | 8172796.00 | 313.70 | FTTT?TT?FFTTFFTT | normal |
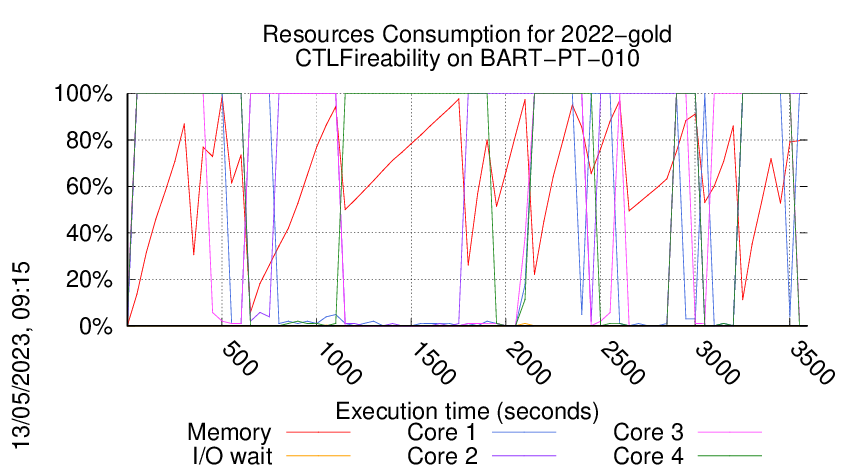
Execution Chart
We display below the execution chart for this examination (boot time has been removed).
Trace from the execution
Formatting '/data/fkordon/mcc2023-input.r030-oct2-167813615200578.qcow2', fmt=qcow2 cluster_size=65536 extended_l2=off compression_type=zlib size=4294967296 backing_file=/data/fkordon/mcc2023-input.qcow2 backing_fmt=qcow2 lazy_refcounts=off refcount_bits=16
Waiting for the VM to be ready (probing ssh)
..............................................................................................................................................................................................................................................................................................................................................................................................................................................................................................................................................................................................................................................................................................................................................................................................................................................................................................................................................................................................................................................................................................................................................................................................................................................................................................................................................................................................................................................................................................................................................................................................................................................................................................................................................................................................................................................................................................................................................................................................................................................................................................................................................................................................................................................................................................................................................................................................................................................................................................................................................................................................................................................................................................................................................................................................................................................................................................................................................................................................................................................................................................................................................................................................................................................................................................................................................................................................................................................................................................................................................................................................................................................................................................................................................................................................................................................................................................................................................................................................................................................................................................................................................................................................................................................................................................................................................................................................................................................................................................................................................................................................................................................................................................................................................................................................................................................................................................................................................................................................................................................................................................................................................................................
=====================================================================
Generated by BenchKit 2-5348
Executing tool gold2022
Input is BART-PT-010, examination is CTLFireability
Time confinement is 3600 seconds
Memory confinement is 16384 MBytes
Number of cores is 4
Run identifier is r030-oct2-167813615200578
=====================================================================
--------------------
preparation of the directory to be used:
/home/mcc/execution
total 20M
-rw-r--r-- 1 mcc users 896K Feb 26 04:33 CTLCardinality.txt
-rw-r--r-- 1 mcc users 3.2M Feb 26 04:33 CTLCardinality.xml
-rw-r--r-- 1 mcc users 615K Feb 26 04:02 CTLFireability.txt
-rw-r--r-- 1 mcc users 1.9M Feb 26 04:02 CTLFireability.xml
-rw-r--r-- 1 mcc users 5 Mar 5 18:22 equiv_col
-rw-r--r-- 1 mcc users 4.2K Jan 29 11:40 GenericPropertiesDefinition.xml
-rw-r--r-- 1 mcc users 6.4K Jan 29 11:40 GenericPropertiesVerdict.xml
-rw-r--r-- 1 mcc users 4 Mar 5 18:22 instance
-rw-r--r-- 1 mcc users 6 Mar 5 18:22 iscolored
-rw-r--r-- 1 mcc users 242K Feb 25 15:34 LTLCardinality.txt
-rw-r--r-- 1 mcc users 668K Feb 25 15:34 LTLCardinality.xml
-rw-r--r-- 1 mcc users 250K Feb 25 15:35 LTLFireability.txt
-rw-r--r-- 1 mcc users 622K Feb 25 15:35 LTLFireability.xml
-rw-r--r-- 1 mcc users 2.4M Mar 5 18:22 model.pnml
-rw-r--r-- 1 mcc users 1.1M Feb 26 05:05 ReachabilityCardinality.txt
-rw-r--r-- 1 mcc users 3.8M Feb 26 05:05 ReachabilityCardinality.xml
-rw-r--r-- 1 mcc users 1010K Feb 26 04:46 ReachabilityFireability.txt
-rw-r--r-- 1 mcc users 3.4M Feb 26 04:46 ReachabilityFireability.xml
-rw-r--r-- 1 mcc users 92K Feb 25 15:35 UpperBounds.txt
-rw-r--r-- 1 mcc users 187K Feb 25 15:35 UpperBounds.xml
--------------------
content from stdout:
=== Data for post analysis generated by BenchKit (invocation template)
The expected result is a vector of booleans
BOOL_VECTOR
here is the order used to build the result vector(from text file)
FORMULA_NAME BART-PT-010-CTLFireability-00
FORMULA_NAME BART-PT-010-CTLFireability-01
FORMULA_NAME BART-PT-010-CTLFireability-02
FORMULA_NAME BART-PT-010-CTLFireability-03
FORMULA_NAME BART-PT-010-CTLFireability-04
FORMULA_NAME BART-PT-010-CTLFireability-05
FORMULA_NAME BART-PT-010-CTLFireability-06
FORMULA_NAME BART-PT-010-CTLFireability-07
FORMULA_NAME BART-PT-010-CTLFireability-08
FORMULA_NAME BART-PT-010-CTLFireability-09
FORMULA_NAME BART-PT-010-CTLFireability-10
FORMULA_NAME BART-PT-010-CTLFireability-11
FORMULA_NAME BART-PT-010-CTLFireability-12
FORMULA_NAME BART-PT-010-CTLFireability-13
FORMULA_NAME BART-PT-010-CTLFireability-14
FORMULA_NAME BART-PT-010-CTLFireability-15
=== Now, execution of the tool begins
BK_START 1678452394353
gold2022
Got BK_BIN_PATH=/home/mcc/BenchKit/bin/
---> gold2022 --- TAPAAL v5
Setting MODEL_PATH=.
Setting VERIFYPN=/home/mcc/BenchKit/bin/verifypn
Got BK_TIME_CONFINEMENT=3600
Setting TEMPDIR=/home/mcc/BenchKit/bin/tmp
Got BK_MEMORY_CONFINEMENT=16384
Limiting to 16265216 kB
Total timeout: 3590
Time left: 3590
*************************************
* TAPAAL verifying CTLFireability *
*************************************
TEMPDIR=/home/mcc/BenchKit/bin/tmp
QF=/home/mcc/BenchKit/bin/tmp/tmp.ilnkHdVs3S
MF=/home/mcc/BenchKit/bin/tmp/tmp.zlyC5WELN1
Time left: 3590
---------------------------------------------------
Step -1: Stripping Colors
---------------------------------------------------
Verifying stripped models (16 in total)
/home/mcc/BenchKit/bin/verifypn -n -c -q 718 -l 29 -d 299 -z 4 -x 1,2,3,4,5,6,7,8,9,10,11,12,13,14,15,16 ./model.pnml ./CTLFireability.xml
CPN OverApproximation is only usable on colored models
Time left: 3590
---------------------------------------------------
Step 0: Parallel Simplification
---------------------------------------------------
Doing parallel simplification (16 in total)
Total simplification timout is 718 -- reduction timeout is 299
timeout 3590 /home/mcc/BenchKit/bin/verifypn -n -q 718 -l 29 -d 299 -z 4 -s OverApprox --binary-query-io 2 --write-simplified /home/mcc/BenchKit/bin/tmp/tmp.ilnkHdVs3S --write-reduced /home/mcc/BenchKit/bin/tmp/tmp.zlyC5WELN1 -x 1,2,3,4,5,6,7,8,9,10,11,12,13,14,15,16 ./model.pnml ./CTLFireability.xml
Time left: 3579
---------------------------------------------------
Step 1: Parallel processing
---------------------------------------------------
Doing parallel verification of individual queries (16 in total)
Each query is verified by 4 parallel strategies for 299 seconds
------------------- QUERY 1 ----------------------
Solution found by parallel processing (step 1)
Search strategy option was ignored as the TAR engine is called.
Query index 0 was solved
Query is satisfied.
Solved using Trace Abstraction Refinement
Spent 0.000137 on verification
@@@0.09,12028@@@
parallel: This job succeeded:
eval /usr/bin/time -f "@@@%e,%M@@@" /home/mcc/BenchKit/bin/verifypn -n -tar\ -s\ RDFS\ -q\ 0\ -l\ 0\ -d\ 119 /home/mcc/BenchKit/bin/tmp/tmp.zlyC5WELN1 /home/mcc/BenchKit/bin/tmp/tmp.ilnkHdVs3S --binary-query-io 1 -x 1 -n
FORMULA BART-PT-010-CTLFireability-11 TRUE TECHNIQUES COLLATERAL_PROCESSING STRUCTURAL_REDUCTION QUERY_REDUCTION SAT_SMT TRACE_ABSTRACTION_REFINEMENT
Time left: 3578
------------------- QUERY 2 ----------------------
Solution found by parallel processing (step 1)
Query index 0 was solved
Query is satisfied.
Spent 0.052058 on verification
@@@0.16,62928@@@
parallel: This job succeeded:
eval /usr/bin/time -f "@@@%e,%M@@@" /home/mcc/BenchKit/bin/verifypn -n -s\ BFS\ -q\ 0\ -l\ 0\ -d\ 119 /home/mcc/BenchKit/bin/tmp/tmp.zlyC5WELN1 /home/mcc/BenchKit/bin/tmp/tmp.ilnkHdVs3S --binary-query-io 1 -x 2 -n
FORMULA BART-PT-010-CTLFireability-05 TRUE TECHNIQUES COLLATERAL_PROCESSING EXPLICIT STATE_COMPRESSION SAT_SMT STUBBORN_SETS CTL_CZERO
Time left: 3578
------------------- QUERY 3 ----------------------
Solution found by parallel processing (step 1)
Query index 0 was solved
Query is satisfied.
Spent 0.045492 on verification
@@@1.60,62996@@@
parallel: This job succeeded:
eval /usr/bin/time -f "@@@%e,%M@@@" /home/mcc/BenchKit/bin/verifypn -n -s\ BFS\ -q\ 0\ -l\ 0\ -d\ 119 /home/mcc/BenchKit/bin/tmp/tmp.zlyC5WELN1 /home/mcc/BenchKit/bin/tmp/tmp.ilnkHdVs3S --binary-query-io 1 -x 3 -n
FORMULA BART-PT-010-CTLFireability-15 TRUE TECHNIQUES COLLATERAL_PROCESSING EXPLICIT STATE_COMPRESSION SAT_SMT STUBBORN_SETS CTL_CZERO
Time left: 3576
------------------- QUERY 4 ----------------------
Solution found by parallel processing (step 1)
Query index 0 was solved
Query is NOT satisfied.
Spent 0.043183 on verification
@@@2.98,63024@@@
parallel: This job succeeded:
eval /usr/bin/time -f "@@@%e,%M@@@" /home/mcc/BenchKit/bin/verifypn -n -tar\ -s\ RDFS\ -q\ 0\ -l\ 0\ -d\ 119 /home/mcc/BenchKit/bin/tmp/tmp.zlyC5WELN1 /home/mcc/BenchKit/bin/tmp/tmp.ilnkHdVs3S --binary-query-io 1 -x 4 -n
FORMULA BART-PT-010-CTLFireability-13 FALSE TECHNIQUES COLLATERAL_PROCESSING EXPLICIT STATE_COMPRESSION SAT_SMT STUBBORN_SETS CTL_CZERO
Time left: 3573
------------------- QUERY 5 ----------------------
No solution found
Time left: 3271
------------------- QUERY 6 ----------------------
Solution found by parallel processing (step 1)
Query index 0 was solved
Query is satisfied.
Spent 0.0852 on verification
@@@0.28,62920@@@
parallel: This job succeeded:
eval /usr/bin/time -f "@@@%e,%M@@@" /home/mcc/BenchKit/bin/verifypn -n -s\ DFS\ -q\ 0\ -l\ 0\ -d\ 119 /home/mcc/BenchKit/bin/tmp/tmp.zlyC5WELN1 /home/mcc/BenchKit/bin/tmp/tmp.ilnkHdVs3S --binary-query-io 1 -x 6 -n
FORMULA BART-PT-010-CTLFireability-02 TRUE TECHNIQUES COLLATERAL_PROCESSING EXPLICIT STATE_COMPRESSION SAT_SMT STUBBORN_SETS CTL_CZERO
Time left: 3270
------------------- QUERY 7 ----------------------
Solution found by parallel processing (step 1)
Query index 0 was solved
Query is satisfied.
Spent 0.064384 on verification
@@@0.13,62832@@@
parallel: This job succeeded:
eval /usr/bin/time -f "@@@%e,%M@@@" /home/mcc/BenchKit/bin/verifypn -n -tar\ -s\ RDFS\ -q\ 0\ -l\ 0\ -d\ 119 /home/mcc/BenchKit/bin/tmp/tmp.zlyC5WELN1 /home/mcc/BenchKit/bin/tmp/tmp.ilnkHdVs3S --binary-query-io 1 -x 7 -n
FORMULA BART-PT-010-CTLFireability-10 TRUE TECHNIQUES COLLATERAL_PROCESSING EXPLICIT STATE_COMPRESSION SAT_SMT STUBBORN_SETS CTL_CZERO
Time left: 3270
------------------- QUERY 8 ----------------------
Solution found by parallel processing (step 1)
Query index 0 was solved
Query is NOT satisfied.
Spent 0.073497 on verification
@@@0.14,62724@@@
parallel: This job succeeded:
eval /usr/bin/time -f "@@@%e,%M@@@" /home/mcc/BenchKit/bin/verifypn -n -tar\ -s\ RDFS\ -q\ 0\ -l\ 0\ -d\ 119 /home/mcc/BenchKit/bin/tmp/tmp.zlyC5WELN1 /home/mcc/BenchKit/bin/tmp/tmp.ilnkHdVs3S --binary-query-io 1 -x 8 -n
FORMULA BART-PT-010-CTLFireability-08 FALSE TECHNIQUES COLLATERAL_PROCESSING EXPLICIT STATE_COMPRESSION SAT_SMT STUBBORN_SETS CTL_CZERO
Time left: 3270
------------------- QUERY 9 ----------------------
Solution found by parallel processing (step 1)
Query index 0 was solved
Query is NOT satisfied.
Spent 0.337783 on verification
@@@0.40,63376@@@
parallel: This job succeeded:
eval /usr/bin/time -f "@@@%e,%M@@@" /home/mcc/BenchKit/bin/verifypn -n -s\ DFS\ -q\ 0\ -l\ 0\ -d\ 119 /home/mcc/BenchKit/bin/tmp/tmp.zlyC5WELN1 /home/mcc/BenchKit/bin/tmp/tmp.ilnkHdVs3S --binary-query-io 1 -x 9 -n
FORMULA BART-PT-010-CTLFireability-12 FALSE TECHNIQUES COLLATERAL_PROCESSING EXPLICIT STATE_COMPRESSION SAT_SMT STUBBORN_SETS CTL_CZERO
Time left: 3269
------------------- QUERY 10 ----------------------
Solution found by parallel processing (step 1)
Query index 0 was solved
Query is satisfied.
Spent 2.93651 on verification
@@@3.01,89388@@@
parallel: This job succeeded:
eval /usr/bin/time -f "@@@%e,%M@@@" /home/mcc/BenchKit/bin/verifypn -n -tar\ -s\ RDFS\ -q\ 0\ -l\ 0\ -d\ 119 /home/mcc/BenchKit/bin/tmp/tmp.zlyC5WELN1 /home/mcc/BenchKit/bin/tmp/tmp.ilnkHdVs3S --binary-query-io 1 -x 10 -n
FORMULA BART-PT-010-CTLFireability-14 TRUE TECHNIQUES COLLATERAL_PROCESSING EXPLICIT STATE_COMPRESSION SAT_SMT STUBBORN_SETS CTL_CZERO
Time left: 3266
------------------- QUERY 11 ----------------------
Solution found by parallel processing (step 1)
Query index 0 was solved
Query is NOT satisfied.
Spent 0.06428 on verification
@@@0.12,62868@@@
parallel: This job succeeded:
eval /usr/bin/time -f "@@@%e,%M@@@" /home/mcc/BenchKit/bin/verifypn -n -s\ BFS\ -q\ 0\ -l\ 0\ -d\ 119 /home/mcc/BenchKit/bin/tmp/tmp.zlyC5WELN1 /home/mcc/BenchKit/bin/tmp/tmp.ilnkHdVs3S --binary-query-io 1 -x 11 -n
FORMULA BART-PT-010-CTLFireability-09 FALSE TECHNIQUES COLLATERAL_PROCESSING EXPLICIT STATE_COMPRESSION SAT_SMT STUBBORN_SETS CTL_CZERO
Time left: 3265
------------------- QUERY 12 ----------------------
Solution found by parallel processing (step 1)
Query index 0 was solved
Query is satisfied.
Spent 0.642504 on verification
@@@0.71,89336@@@
parallel: This job succeeded:
eval /usr/bin/time -f "@@@%e,%M@@@" /home/mcc/BenchKit/bin/verifypn -n -tar\ -s\ RDFS\ -q\ 0\ -l\ 0\ -d\ 119 /home/mcc/BenchKit/bin/tmp/tmp.zlyC5WELN1 /home/mcc/BenchKit/bin/tmp/tmp.ilnkHdVs3S --binary-query-io 1 -x 12 -n
FORMULA BART-PT-010-CTLFireability-06 TRUE TECHNIQUES COLLATERAL_PROCESSING EXPLICIT STATE_COMPRESSION SAT_SMT STUBBORN_SETS CTL_CZERO
Time left: 3264
------------------- QUERY 13 ----------------------
No solution found
Command terminated by signal 9
@@@107.86,5754188@@@
Command terminated by signal 9
@@@175.21,8199180@@@
Time left: 2962
------------------- QUERY 14 ----------------------
Solution found by parallel processing (step 1)
Query index 0 was solved
Query is satisfied.
Spent 0.345379 on verification
@@@0.41,70416@@@
parallel: This job succeeded:
eval /usr/bin/time -f "@@@%e,%M@@@" /home/mcc/BenchKit/bin/verifypn -n -s\ DFS\ -q\ 0\ -l\ 0\ -d\ 119 /home/mcc/BenchKit/bin/tmp/tmp.zlyC5WELN1 /home/mcc/BenchKit/bin/tmp/tmp.ilnkHdVs3S --binary-query-io 1 -x 14 -n
FORMULA BART-PT-010-CTLFireability-03 TRUE TECHNIQUES COLLATERAL_PROCESSING EXPLICIT STATE_COMPRESSION SAT_SMT STUBBORN_SETS CTL_CZERO
Time left: 2961
------------------- QUERY 15 ----------------------
Solution found by parallel processing (step 1)
Query index 0 was solved
Query is satisfied.
Spent 0.217333 on verification
@@@0.25,67876@@@
parallel: This job succeeded:
eval /usr/bin/time -f "@@@%e,%M@@@" /home/mcc/BenchKit/bin/verifypn -n -tar\ -s\ RDFS\ -q\ 0\ -l\ 0\ -d\ 119 /home/mcc/BenchKit/bin/tmp/tmp.zlyC5WELN1 /home/mcc/BenchKit/bin/tmp/tmp.ilnkHdVs3S --binary-query-io 1 -x 15 -n
FORMULA BART-PT-010-CTLFireability-01 TRUE TECHNIQUES COLLATERAL_PROCESSING EXPLICIT STATE_COMPRESSION SAT_SMT STUBBORN_SETS CTL_CZERO
Time left: 2961
------------------- QUERY 16 ----------------------
Solution found by parallel processing (step 1)
Query index 0 was solved
Query is NOT satisfied.
Spent 0.108444 on verification
@@@0.16,63116@@@
Query index 0 was solved
Query is NOT satisfied.
Spent 0.113095 on verification
parallel: This job succeeded:
eval /usr/bin/time -f "@@@%e,%M@@@" /home/mcc/BenchKit/bin/verifypn -n -s\ BFS\ -q\ 0\ -l\ 0\ -d\ 119 /home/mcc/BenchKit/bin/tmp/tmp.zlyC5WELN1 /home/mcc/BenchKit/bin/tmp/tmp.ilnkHdVs3S --binary-query-io 1 -x 16 -n
FORMULA BART-PT-010-CTLFireability-00 FALSE TECHNIQUES COLLATERAL_PROCESSING EXPLICIT STATE_COMPRESSION SAT_SMT STUBBORN_SETS CTL_CZERO
Time left: 2960
---------------------------------------------------
Step 2: Sequential processing
---------------------------------------------------
Remaining 2 queries are verified sequentially.
Each query is verified for a dynamic timeout (at least 598 seconds)
Time left: 2960
------------------- QUERY 5 ----------------------
Running query 5 for 1480 seconds. Remaining: 2 queries and 2960 seconds
No solution found
Command terminated by signal 9
@@@493.49,8450008@@@
Command terminated by signal 9
@@@1139.89,16144816@@@
Time left: 1820
------------------- QUERY 13 ----------------------
Running query 13 for 1820 seconds. Remaining: 1 queries and 1820 seconds
No solution found
Command terminated by signal 9
@@@166.78,8307196@@@
Command terminated by signal 9
@@@337.14,16146456@@@
Time left: 1483
Time left: 1483
---------------------------------------------------
Step 4: Random Parallel processing
---------------------------------------------------
Doing random parallel verification of individual queries (2 in total)
Each query is verified by 4 parallel strategies for 741 seconds
------------------- QUERY 5 ----------------------
No solution found
Command terminated by signal 9
@@@252.02,4287000@@@
Command terminated by signal 9
@@@333.97,5680008@@@
Command terminated by signal 9
@@@505.25,8476468@@@
Time left: 738
------------------- QUERY 13 ----------------------
No solution found
Command terminated by signal 9
@@@72.03,4091236@@@
Command terminated by signal 9
@@@109.84,5544628@@@
Command terminated by signal 9
@@@167.43,8191612@@@
terminate called after throwing an instance of 'std::bad_alloc'
what(): std::bad_alloc
Command terminated by signal 6
@@@381.98,16022684@@@
Time left: 356
Time left: 356
---------------------------------------------------
Step 4: Random Parallel processing
---------------------------------------------------
Doing random parallel verification of individual queries (2 in total)
Each query is verified by 4 parallel strategies for 178 seconds
------------------- QUERY 5 ----------------------
No solution found
Time left: 174
------------------- QUERY 13 ----------------------
No solution found
Command terminated by signal 9
@@@73.58,4081744@@@
Command terminated by signal 9
@@@111.78,5433888@@@
Command terminated by signal 9
@@@171.87,8162024@@@
Time left: -2
Out of time, terminating!
terminated-with-cleanup
BK_STOP 1678455986151
--------------------
content from stderr:
Sequence of Actions to be Executed by the VM
This is useful if one wants to reexecute the tool in the VM from the submitted image disk.
set -x
# this is for BenchKit: configuration of major elements for the test
export BK_INPUT="BART-PT-010"
export BK_EXAMINATION="CTLFireability"
export BK_TOOL="gold2022"
export BK_RESULT_DIR="/tmp/BK_RESULTS/OUTPUTS"
export BK_TIME_CONFINEMENT="3600"
export BK_MEMORY_CONFINEMENT="16384"
export BK_BIN_PATH="/home/mcc/BenchKit/bin/"
# this is specific to your benchmark or test
export BIN_DIR="$HOME/BenchKit/bin"
# remove the execution directoty if it exists (to avoid increse of .vmdk images)
if [ -d execution ] ; then
rm -rf execution
fi
# this is for BenchKit: explicit launching of the test
echo "====================================================================="
echo " Generated by BenchKit 2-5348"
echo " Executing tool gold2022"
echo " Input is BART-PT-010, examination is CTLFireability"
echo " Time confinement is $BK_TIME_CONFINEMENT seconds"
echo " Memory confinement is 16384 MBytes"
echo " Number of cores is 4"
echo " Run identifier is r030-oct2-167813615200578"
echo "====================================================================="
echo
echo "--------------------"
echo "preparation of the directory to be used:"
tar xzf /home/mcc/BenchKit/INPUTS/BART-PT-010.tgz
mv BART-PT-010 execution
cd execution
if [ "CTLFireability" = "ReachabilityDeadlock" ] || [ "CTLFireability" = "UpperBounds" ] || [ "CTLFireability" = "QuasiLiveness" ] || [ "CTLFireability" = "StableMarking" ] || [ "CTLFireability" = "Liveness" ] || [ "CTLFireability" = "OneSafe" ] || [ "CTLFireability" = "StateSpace" ]; then
rm -f GenericPropertiesVerdict.xml
fi
pwd
ls -lh
echo
echo "--------------------"
echo "content from stdout:"
echo
echo "=== Data for post analysis generated by BenchKit (invocation template)"
echo
if [ "CTLFireability" = "UpperBounds" ] ; then
echo "The expected result is a vector of positive values"
echo NUM_VECTOR
elif [ "CTLFireability" != "StateSpace" ] ; then
echo "The expected result is a vector of booleans"
echo BOOL_VECTOR
else
echo "no data necessary for post analysis"
fi
echo
if [ -f "CTLFireability.txt" ] ; then
echo "here is the order used to build the result vector(from text file)"
for x in $(grep Property CTLFireability.txt | cut -d ' ' -f 2 | sort -u) ; do
echo "FORMULA_NAME $x"
done
elif [ -f "CTLFireability.xml" ] ; then # for cunf (txt files deleted;-)
echo echo "here is the order used to build the result vector(from xml file)"
for x in $(grep '
echo "FORMULA_NAME $x"
done
elif [ "CTLFireability" = "ReachabilityDeadlock" ] || [ "CTLFireability" = "QuasiLiveness" ] || [ "CTLFireability" = "StableMarking" ] || [ "CTLFireability" = "Liveness" ] || [ "CTLFireability" = "OneSafe" ] ; then
echo "FORMULA_NAME CTLFireability"
fi
echo
echo "=== Now, execution of the tool begins"
echo
echo -n "BK_START "
date -u +%s%3N
echo
timeout -s 9 $BK_TIME_CONFINEMENT bash -c "/home/mcc/BenchKit/BenchKit_head.sh 2> STDERR ; echo ; echo -n \"BK_STOP \" ; date -u +%s%3N"
if [ $? -eq 137 ] ; then
echo
echo "BK_TIME_CONFINEMENT_REACHED"
fi
echo
echo "--------------------"
echo "content from stderr:"
echo
cat STDERR ;