

About the Execution of Tapaal for JoinFreeModules-PT-1000
| Execution Summary | |||||
| Max Memory Used (MB) |
Time wait (ms) | CPU Usage (ms) | I/O Wait (ms) | Computed Result | Execution Status |
| 16225.340 | 3592223.00 | 7418746.00 | 11183.40 | ??FTFFTT?FT?FTTF | normal |
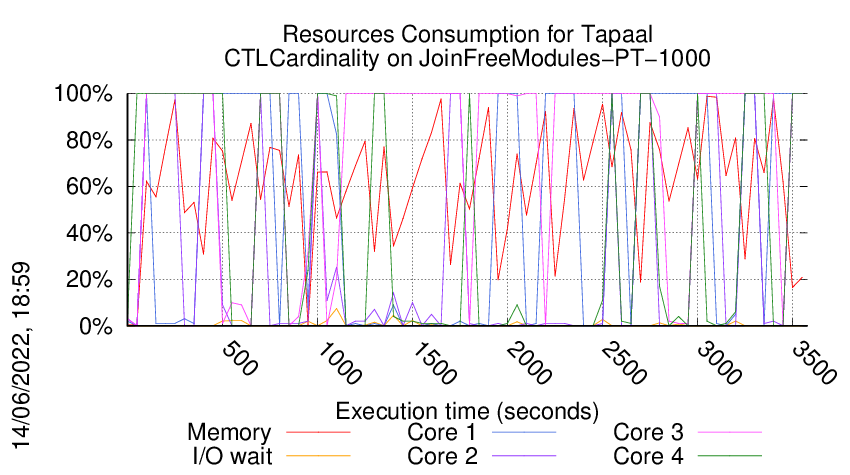
Execution Chart
We display below the execution chart for this examination (boot time has been removed).
Trace from the execution
Formatting '/data/fkordon/mcc2022-input.r129-tall-165271816400209.qcow2', fmt=qcow2 size=4294967296 backing_file=/data/fkordon/mcc2022-input.qcow2 cluster_size=65536 lazy_refcounts=off refcount_bits=16
Waiting for the VM to be ready (probing ssh)
......................................................................................................................................................................................................................................................................................................................................................................................................................................................................................................................................................................................................................................................................................................................................................................................................................................................................................................................................................................................................................................................................................................................................................................................................................................................................................
=====================================================================
Generated by BenchKit 2-4028
Executing tool tapaal
Input is JoinFreeModules-PT-1000, examination is CTLCardinality
Time confinement is 3600 seconds
Memory confinement is 16384 MBytes
Number of cores is 4
Run identifier is r129-tall-165271816400209
=====================================================================
--------------------
preparation of the directory to be used:
/home/mcc/execution
total 3.3M
-rw-r--r-- 1 mcc users 7.7K Apr 30 02:18 CTLCardinality.txt
-rw-r--r-- 1 mcc users 82K Apr 30 02:18 CTLCardinality.xml
-rw-r--r-- 1 mcc users 6.5K Apr 30 02:18 CTLFireability.txt
-rw-r--r-- 1 mcc users 60K Apr 30 02:18 CTLFireability.xml
-rw-r--r-- 1 mcc users 6 May 10 09:34 equiv_col
-rw-r--r-- 1 mcc users 4.2K May 10 09:34 GenericPropertiesDefinition.xml
-rw-r--r-- 1 mcc users 6.1K May 10 09:34 GenericPropertiesVerdict.xml
-rw-r--r-- 1 mcc users 5 May 10 09:34 instance
-rw-r--r-- 1 mcc users 6 May 10 09:34 iscolored
-rw-r--r-- 1 mcc users 3.4K May 9 08:08 LTLCardinality.txt
-rw-r--r-- 1 mcc users 22K May 9 08:08 LTLCardinality.xml
-rw-r--r-- 1 mcc users 2.3K May 9 08:08 LTLFireability.txt
-rw-r--r-- 1 mcc users 17K May 9 08:08 LTLFireability.xml
-rw-r--r-- 1 mcc users 3.1M May 10 09:34 model.pnml
-rw-r--r-- 1 mcc users 1.7K May 9 08:08 UpperBounds.txt
-rw-r--r-- 1 mcc users 3.8K May 9 08:08 UpperBounds.xml
--------------------
content from stdout:
=== Data for post analysis generated by BenchKit (invocation template)
The expected result is a vector of booleans
BOOL_VECTOR
here is the order used to build the result vector(from text file)
FORMULA_NAME JoinFreeModules-PT-1000-CTLCardinality-00
FORMULA_NAME JoinFreeModules-PT-1000-CTLCardinality-01
FORMULA_NAME JoinFreeModules-PT-1000-CTLCardinality-02
FORMULA_NAME JoinFreeModules-PT-1000-CTLCardinality-03
FORMULA_NAME JoinFreeModules-PT-1000-CTLCardinality-04
FORMULA_NAME JoinFreeModules-PT-1000-CTLCardinality-05
FORMULA_NAME JoinFreeModules-PT-1000-CTLCardinality-06
FORMULA_NAME JoinFreeModules-PT-1000-CTLCardinality-07
FORMULA_NAME JoinFreeModules-PT-1000-CTLCardinality-08
FORMULA_NAME JoinFreeModules-PT-1000-CTLCardinality-09
FORMULA_NAME JoinFreeModules-PT-1000-CTLCardinality-10
FORMULA_NAME JoinFreeModules-PT-1000-CTLCardinality-11
FORMULA_NAME JoinFreeModules-PT-1000-CTLCardinality-12
FORMULA_NAME JoinFreeModules-PT-1000-CTLCardinality-13
FORMULA_NAME JoinFreeModules-PT-1000-CTLCardinality-14
FORMULA_NAME JoinFreeModules-PT-1000-CTLCardinality-15
=== Now, execution of the tool begins
BK_START 1652752002666
tapaal
Got BK_BIN_PATH=/home/mcc/BenchKit/bin/
---> tapaal --- TAPAAL v5
Setting MODEL_PATH=.
Setting VERIFYPN=/home/mcc/BenchKit/bin/verifypn
Got BK_TIME_CONFINEMENT=3600
Setting TEMPDIR=/home/mcc/BenchKit/bin/tmp
Got BK_MEMORY_CONFINEMENT=16384
Limiting to 16265216 kB
Total timeout: 3590
Time left: 3590
*************************************
* TAPAAL verifying CTLCardinality *
*************************************
TEMPDIR=/home/mcc/BenchKit/bin/tmp
QF=/home/mcc/BenchKit/bin/tmp/tmp.OTTdin4iKT
MF=/home/mcc/BenchKit/bin/tmp/tmp.e7CIL2hunP
Time left: 3590
---------------------------------------------------
Step -1: Stripping Colors
---------------------------------------------------
Verifying stripped models (16 in total)
/home/mcc/BenchKit/bin/verifypn -n -c -q 718 -l 29 -d 299 -z 4 -x 1,2,3,4,5,6,7,8,9,10,11,12,13,14,15,16 ./model.pnml ./CTLCardinality.xml
CPN OverApproximation is only usable on colored models
Time left: 3590
---------------------------------------------------
Step 0: Parallel Simplification
---------------------------------------------------
Doing parallel simplification (16 in total)
Total simplification timout is 718 -- reduction timeout is 299
timeout 3590 /home/mcc/BenchKit/bin/verifypn -n -q 718 -l 29 -d 299 -z 4 -s OverApprox --binary-query-io 2 --write-simplified /home/mcc/BenchKit/bin/tmp/tmp.OTTdin4iKT --write-reduced /home/mcc/BenchKit/bin/tmp/tmp.e7CIL2hunP -x 1,2,3,4,5,6,7,8,9,10,11,12,13,14,15,16 ./model.pnml ./CTLCardinality.xml
FORMULA JoinFreeModules-PT-1000-CTLCardinality-05 FALSE TECHNIQUES COLLATERAL_PROCESSING STRUCTURAL_REDUCTION QUERY_REDUCTION SAT_SMT LP_APPROX
Query index 5 was solved
Query is NOT satisfied.
FORMULA JoinFreeModules-PT-1000-CTLCardinality-07 TRUE TECHNIQUES COLLATERAL_PROCESSING STRUCTURAL_REDUCTION QUERY_REDUCTION SAT_SMT LP_APPROX
Query index 7 was solved
Query is satisfied.
Solution found by parallel simplification (step 0)
Solution found by parallel simplification (step 0)
Time left: 3540
---------------------------------------------------
Step 1: Parallel processing
---------------------------------------------------
Doing parallel verification of individual queries (14 in total)
Each query is verified by 4 parallel strategies for 299 seconds
------------------- QUERY 1 ----------------------
Solution found by parallel processing (step 1)
Query index 0 was solved
Query is NOT satisfied.
Spent 0.647369 on verification
@@@0.93,91960@@@
parallel: This job succeeded:
eval /usr/bin/time -f "@@@%e,%M@@@" /home/mcc/BenchKit/bin/verifypn -n -s\ BFS\ -q\ 0\ -l\ 0\ -d\ 119 /home/mcc/BenchKit/bin/tmp/tmp.e7CIL2hunP /home/mcc/BenchKit/bin/tmp/tmp.OTTdin4iKT --binary-query-io 1 -x 1 -n
FORMULA JoinFreeModules-PT-1000-CTLCardinality-12 FALSE TECHNIQUES COLLATERAL_PROCESSING EXPLICIT STATE_COMPRESSION SAT_SMT STUBBORN_SETS CTL_CZERO
Time left: 3538
------------------- QUERY 2 ----------------------
Solution found by parallel processing (step 1)
Query index 0 was solved
Query is satisfied.
Spent 0.038498 on verification
@@@0.32,75540@@@
Query index 0 was solved
Query is satisfied.
Spent 0.038366 on verification
@@@0.32,75616@@@
Query index 0 was solved
Query is satisfied.
Spent 0.043437 on verification
Query index 0 was solved
Query is satisfied.
Spent 0.047571 on verification
@@@0.33,75616@@@
parallel: This job succeeded:
eval /usr/bin/time -f "@@@%e,%M@@@" /home/mcc/BenchKit/bin/verifypn -n -tar\ -s\ RDFS\ -q\ 0\ -l\ 0\ -d\ 119 /home/mcc/BenchKit/bin/tmp/tmp.e7CIL2hunP /home/mcc/BenchKit/bin/tmp/tmp.OTTdin4iKT --binary-query-io 1 -x 2 -n
parallel: This job succeeded:
eval /usr/bin/time -f "@@@%e,%M@@@" /home/mcc/BenchKit/bin/verifypn -n -s\ BestFS\ -q\ 0\ -l\ 0\ -d\ 119 /home/mcc/BenchKit/bin/tmp/tmp.e7CIL2hunP /home/mcc/BenchKit/bin/tmp/tmp.OTTdin4iKT --binary-query-io 1 -x 2 -n
parallel: This job succeeded:
eval /usr/bin/time -f "@@@%e,%M@@@" /home/mcc/BenchKit/bin/verifypn -n -s\ BFS\ -q\ 0\ -l\ 0\ -d\ 119 /home/mcc/BenchKit/bin/tmp/tmp.e7CIL2hunP /home/mcc/BenchKit/bin/tmp/tmp.OTTdin4iKT --binary-query-io 1 -x 2 -n
FORMULA JoinFreeModules-PT-1000-CTLCardinality-03 TRUE TECHNIQUES COLLATERAL_PROCESSING EXPLICIT STATE_COMPRESSION SAT_SMT STUBBORN_SETS CTL_CZERO
Time left: 3538
------------------- QUERY 3 ----------------------
No solution found
Command terminated by signal 9
@@@78.71,8720836@@@
Command terminated by signal 9
@@@202.05,9076548@@@
Time left: 3236
------------------- QUERY 4 ----------------------
Solution found by parallel processing (step 1)
Query index 0 was solved
Query is NOT satisfied.
Spent 0.897756 on verification
@@@1.43,91932@@@
parallel: This job succeeded:
eval /usr/bin/time -f "@@@%e,%M@@@" /home/mcc/BenchKit/bin/verifypn -n -s\ BFS\ -q\ 0\ -l\ 0\ -d\ 119 /home/mcc/BenchKit/bin/tmp/tmp.e7CIL2hunP /home/mcc/BenchKit/bin/tmp/tmp.OTTdin4iKT --binary-query-io 1 -x 4 -n
FORMULA JoinFreeModules-PT-1000-CTLCardinality-02 FALSE TECHNIQUES COLLATERAL_PROCESSING EXPLICIT STATE_COMPRESSION SAT_SMT STUBBORN_SETS CTL_CZERO
Time left: 3234
------------------- QUERY 5 ----------------------
Solution found by parallel processing (step 1)
Query index 0 was solved
Query is satisfied.
Spent 0.072926 on verification
Query index 0 was solved
Query is satisfied.
Spent 0.090931 on verification
Query index 0 was solved
Query is satisfied.
Spent 0.070862 on verification
@@@0.62,75516@@@
@@@0.64,75592@@@
parallel: This job succeeded:
eval /usr/bin/time -f "@@@%e,%M@@@" /home/mcc/BenchKit/bin/verifypn -n -tar\ -s\ RDFS\ -q\ 0\ -l\ 0\ -d\ 119 /home/mcc/BenchKit/bin/tmp/tmp.e7CIL2hunP /home/mcc/BenchKit/bin/tmp/tmp.OTTdin4iKT --binary-query-io 1 -x 5 -n
parallel: This job succeeded:
eval /usr/bin/time -f "@@@%e,%M@@@" /home/mcc/BenchKit/bin/verifypn -n -s\ BFS\ -q\ 0\ -l\ 0\ -d\ 119 /home/mcc/BenchKit/bin/tmp/tmp.e7CIL2hunP /home/mcc/BenchKit/bin/tmp/tmp.OTTdin4iKT --binary-query-io 1 -x 5 -n
FORMULA JoinFreeModules-PT-1000-CTLCardinality-10 TRUE TECHNIQUES COLLATERAL_PROCESSING EXPLICIT STATE_COMPRESSION SAT_SMT STUBBORN_SETS CTL_CZERO
Time left: 3234
------------------- QUERY 6 ----------------------
Solution found by parallel processing (step 1)
Query index 0 was solved
Query is satisfied.
Spent 0.575834 on verification
@@@1.13,74980@@@
parallel: This job succeeded:
eval /usr/bin/time -f "@@@%e,%M@@@" /home/mcc/BenchKit/bin/verifypn -n -s\ BestFS\ -q\ 0\ -l\ 0\ -d\ 119 /home/mcc/BenchKit/bin/tmp/tmp.e7CIL2hunP /home/mcc/BenchKit/bin/tmp/tmp.OTTdin4iKT --binary-query-io 1 -x 6 -n
FORMULA JoinFreeModules-PT-1000-CTLCardinality-13 TRUE TECHNIQUES COLLATERAL_PROCESSING EXPLICIT STATE_COMPRESSION SAT_SMT STUBBORN_SETS CTL_CZERO
Time left: 3232
------------------- QUERY 7 ----------------------
No solution found
Command terminated by signal 9
@@@105.00,4506112@@@
Command terminated by signal 9
@@@129.62,5558568@@@
Command terminated by signal 9
@@@178.59,8187784@@@
Time left: 2930
------------------- QUERY 8 ----------------------
No solution found
Command terminated by signal 9
@@@90.62,4846108@@@
Command terminated by signal 9
@@@127.12,6446112@@@
Command terminated by signal 9
@@@185.29,8822440@@@
Time left: 2629
------------------- QUERY 9 ----------------------
No solution found
Command terminated by signal 9
@@@73.28,4250368@@@
Command terminated by signal 9
@@@97.61,5582124@@@
Command terminated by signal 9
@@@149.24,8622968@@@
Time left: 2327
------------------- QUERY 10 ----------------------
Solution found by parallel processing (step 1)
Query index 0 was solved
Query is satisfied.
Spent 1.65543 on verification
@@@2.20,75048@@@
parallel: This job succeeded:
eval /usr/bin/time -f "@@@%e,%M@@@" /home/mcc/BenchKit/bin/verifypn -n -s\ BestFS\ -q\ 0\ -l\ 0\ -d\ 119 /home/mcc/BenchKit/bin/tmp/tmp.e7CIL2hunP /home/mcc/BenchKit/bin/tmp/tmp.OTTdin4iKT --binary-query-io 1 -x 10 -n
FORMULA JoinFreeModules-PT-1000-CTLCardinality-14 TRUE TECHNIQUES COLLATERAL_PROCESSING EXPLICIT STATE_COMPRESSION SAT_SMT STUBBORN_SETS CTL_CZERO
Time left: 2324
------------------- QUERY 11 ----------------------
Solution found by parallel processing (step 1)
Query index 0 was solved
Query is satisfied.
Spent 4.92403 on verification
@@@5.21,91936@@@
parallel: This job succeeded:
eval /usr/bin/time -f "@@@%e,%M@@@" /home/mcc/BenchKit/bin/verifypn -n -s\ DFS\ -q\ 0\ -l\ 0\ -d\ 119 /home/mcc/BenchKit/bin/tmp/tmp.e7CIL2hunP /home/mcc/BenchKit/bin/tmp/tmp.OTTdin4iKT --binary-query-io 1 -x 11 -n
FORMULA JoinFreeModules-PT-1000-CTLCardinality-06 TRUE TECHNIQUES COLLATERAL_PROCESSING EXPLICIT STATE_COMPRESSION SAT_SMT STUBBORN_SETS CTL_CZERO
Time left: 2319
------------------- QUERY 12 ----------------------
Solution found by parallel processing (step 1)
Query index 0 was solved
Query is NOT satisfied.
Spent 0.040119 on verification
@@@0.31,75484@@@
parallel: This job succeeded:
eval /usr/bin/time -f "@@@%e,%M@@@" /home/mcc/BenchKit/bin/verifypn -n -s\ BestFS\ -q\ 0\ -l\ 0\ -d\ 119 /home/mcc/BenchKit/bin/tmp/tmp.e7CIL2hunP /home/mcc/BenchKit/bin/tmp/tmp.OTTdin4iKT --binary-query-io 1 -x 12 -n
FORMULA JoinFreeModules-PT-1000-CTLCardinality-09 FALSE TECHNIQUES COLLATERAL_PROCESSING EXPLICIT STATE_COMPRESSION SAT_SMT STUBBORN_SETS CTL_CZERO
Time left: 2318
------------------- QUERY 13 ----------------------
Solution found by parallel processing (step 1)
Query index 0 was solved
Query is NOT satisfied.
Spent 0.049267 on verification
@@@0.34,75688@@@
parallel: This job succeeded:
eval /usr/bin/time -f "@@@%e,%M@@@" /home/mcc/BenchKit/bin/verifypn -n -tar\ -s\ RDFS\ -q\ 0\ -l\ 0\ -d\ 119 /home/mcc/BenchKit/bin/tmp/tmp.e7CIL2hunP /home/mcc/BenchKit/bin/tmp/tmp.OTTdin4iKT --binary-query-io 1 -x 13 -n
FORMULA JoinFreeModules-PT-1000-CTLCardinality-15 FALSE TECHNIQUES COLLATERAL_PROCESSING EXPLICIT STATE_COMPRESSION SAT_SMT STUBBORN_SETS CTL_CZERO
Time left: 2318
------------------- QUERY 14 ----------------------
Solution found by parallel processing (step 1)
Query index 0 was solved
Query is NOT satisfied.
Spent 0.836843 on verification
@@@1.13,100128@@@
parallel: This job succeeded:
eval /usr/bin/time -f "@@@%e,%M@@@" /home/mcc/BenchKit/bin/verifypn -n -s\ BestFS\ -q\ 0\ -l\ 0\ -d\ 119 /home/mcc/BenchKit/bin/tmp/tmp.e7CIL2hunP /home/mcc/BenchKit/bin/tmp/tmp.OTTdin4iKT --binary-query-io 1 -x 14 -n
FORMULA JoinFreeModules-PT-1000-CTLCardinality-04 FALSE TECHNIQUES COLLATERAL_PROCESSING EXPLICIT STATE_COMPRESSION SAT_SMT STUBBORN_SETS CTL_CZERO
Time left: 2316
---------------------------------------------------
Step 2: Sequential processing
---------------------------------------------------
Remaining 4 queries are verified sequentially.
Each query is verified for a dynamic timeout (at least 512 seconds)
Time left: 2316
------------------- QUERY 3 ----------------------
Running query 3 for 579 seconds. Remaining: 4 queries and 2316 seconds
No solution found
Command terminated by signal 9
@@@113.54,11506056@@@
Command terminated by signal 9
@@@395.49,16146740@@@
Time left: 1921
------------------- QUERY 7 ----------------------
Running query 7 for 640 seconds. Remaining: 3 queries and 1921 seconds
No solution found
Command terminated by signal 9
@@@141.56,8112340@@@
Command terminated by signal 9
@@@255.24,16148504@@@
Time left: 1665
------------------- QUERY 8 ----------------------
Running query 8 for 832 seconds. Remaining: 2 queries and 1665 seconds
No solution found
Command terminated by signal 9
@@@170.52,9607732@@@
Command terminated by signal 9
@@@303.69,16145720@@@
Time left: 1361
------------------- QUERY 9 ----------------------
Running query 9 for 1361 seconds. Remaining: 1 queries and 1361 seconds
No solution found
Command terminated by signal 9
@@@141.88,8114996@@@
Command terminated by signal 9
@@@295.48,16146740@@@
Time left: 1065
Time left: 1065
---------------------------------------------------
Step 4: Random Parallel processing
---------------------------------------------------
Doing random parallel verification of individual queries (4 in total)
Each query is verified by 4 parallel strategies for 266 seconds
------------------- QUERY 3 ----------------------
No solution found
Command terminated by signal 9
@@@53.01,4191816@@@
Command terminated by signal 9
@@@67.18,5590928@@@
Command terminated by signal 9
@@@94.52,8243660@@@
Command terminated by signal 9
@@@175.65,16145556@@@
Time left: 889
------------------- QUERY 7 ----------------------
No solution found
Command terminated by signal 9
@@@71.07,4054676@@@
Command terminated by signal 9
@@@96.78,5422532@@@
Command terminated by signal 9
@@@150.27,8080108@@@
Time left: 620
------------------- QUERY 8 ----------------------
No solution found
Command terminated by signal 9
@@@69.60,4105864@@@
Command terminated by signal 9
@@@95.04,5418836@@@
Command terminated by signal 9
@@@145.56,8074636@@@
Time left: 352
------------------- QUERY 9 ----------------------
No solution found
Command terminated by signal 9
@@@93.50,4485824@@@
Command terminated by signal 9
@@@121.15,5908500@@@
Command terminated by signal 9
@@@178.88,8487700@@@
Time left: 83
Time left: 83
---------------------------------------------------
Step 4: Random Parallel processing
---------------------------------------------------
Doing random parallel verification of individual queries (4 in total)
Each query is verified by 4 parallel strategies for 20 seconds
------------------- QUERY 3 ----------------------
No solution found
Time left: 61
------------------- QUERY 7 ----------------------
No solution found
Time left: 39
------------------- QUERY 8 ----------------------
No solution found
Time left: 16
------------------- QUERY 9 ----------------------
No solution found
Time left: -2
Out of time, terminating!
terminated-with-cleanup
BK_STOP 1652755594889
--------------------
content from stderr:
Sequence of Actions to be Executed by the VM
This is useful if one wants to reexecute the tool in the VM from the submitted image disk.
set -x
# this is for BenchKit: configuration of major elements for the test
export BK_INPUT="JoinFreeModules-PT-1000"
export BK_EXAMINATION="CTLCardinality"
export BK_TOOL="tapaal"
export BK_RESULT_DIR="/tmp/BK_RESULTS/OUTPUTS"
export BK_TIME_CONFINEMENT="3600"
export BK_MEMORY_CONFINEMENT="16384"
export BK_BIN_PATH="/home/mcc/BenchKit/bin/"
# this is specific to your benchmark or test
export BIN_DIR="$HOME/BenchKit/bin"
# remove the execution directoty if it exists (to avoid increse of .vmdk images)
if [ -d execution ] ; then
rm -rf execution
fi
# this is for BenchKit: explicit launching of the test
echo "====================================================================="
echo " Generated by BenchKit 2-4028"
echo " Executing tool tapaal"
echo " Input is JoinFreeModules-PT-1000, examination is CTLCardinality"
echo " Time confinement is $BK_TIME_CONFINEMENT seconds"
echo " Memory confinement is 16384 MBytes"
echo " Number of cores is 4"
echo " Run identifier is r129-tall-165271816400209"
echo "====================================================================="
echo
echo "--------------------"
echo "preparation of the directory to be used:"
tar xzf /home/mcc/BenchKit/INPUTS/JoinFreeModules-PT-1000.tgz
mv JoinFreeModules-PT-1000 execution
cd execution
if [ "CTLCardinality" = "ReachabilityDeadlock" ] || [ "CTLCardinality" = "UpperBounds" ] || [ "CTLCardinality" = "QuasiLiveness" ] || [ "CTLCardinality" = "StableMarking" ] || [ "CTLCardinality" = "Liveness" ] || [ "CTLCardinality" = "OneSafe" ] || [ "CTLCardinality" = "StateSpace" ]; then
rm -f GenericPropertiesVerdict.xml
fi
pwd
ls -lh
echo
echo "--------------------"
echo "content from stdout:"
echo
echo "=== Data for post analysis generated by BenchKit (invocation template)"
echo
if [ "CTLCardinality" = "UpperBounds" ] ; then
echo "The expected result is a vector of positive values"
echo NUM_VECTOR
elif [ "CTLCardinality" != "StateSpace" ] ; then
echo "The expected result is a vector of booleans"
echo BOOL_VECTOR
else
echo "no data necessary for post analysis"
fi
echo
if [ -f "CTLCardinality.txt" ] ; then
echo "here is the order used to build the result vector(from text file)"
for x in $(grep Property CTLCardinality.txt | cut -d ' ' -f 2 | sort -u) ; do
echo "FORMULA_NAME $x"
done
elif [ -f "CTLCardinality.xml" ] ; then # for cunf (txt files deleted;-)
echo echo "here is the order used to build the result vector(from xml file)"
for x in $(grep '
echo "FORMULA_NAME $x"
done
elif [ "CTLCardinality" = "ReachabilityDeadlock" ] || [ "CTLCardinality" = "QuasiLiveness" ] || [ "CTLCardinality" = "StableMarking" ] || [ "CTLCardinality" = "Liveness" ] || [ "CTLCardinality" = "OneSafe" ] ; then
echo "FORMULA_NAME CTLCardinality"
fi
echo
echo "=== Now, execution of the tool begins"
echo
echo -n "BK_START "
date -u +%s%3N
echo
timeout -s 9 $BK_TIME_CONFINEMENT bash -c "/home/mcc/BenchKit/BenchKit_head.sh 2> STDERR ; echo ; echo -n \"BK_STOP \" ; date -u +%s%3N"
if [ $? -eq 137 ] ; then
echo
echo "BK_TIME_CONFINEMENT_REACHED"
fi
echo
echo "--------------------"
echo "content from stderr:"
echo
cat STDERR ;