

About the Execution of LTSMin for RERS17pb113-PT-2
| Execution Summary | |||||
| Max Memory Used (MB) |
Time wait (ms) | CPU Usage (ms) | I/O Wait (ms) | Computed Result | Execution Status |
| 4171.310 | 545514.00 | 1860952.00 | 29.20 | ?TFFFFFTTTFFFFFF | normal |
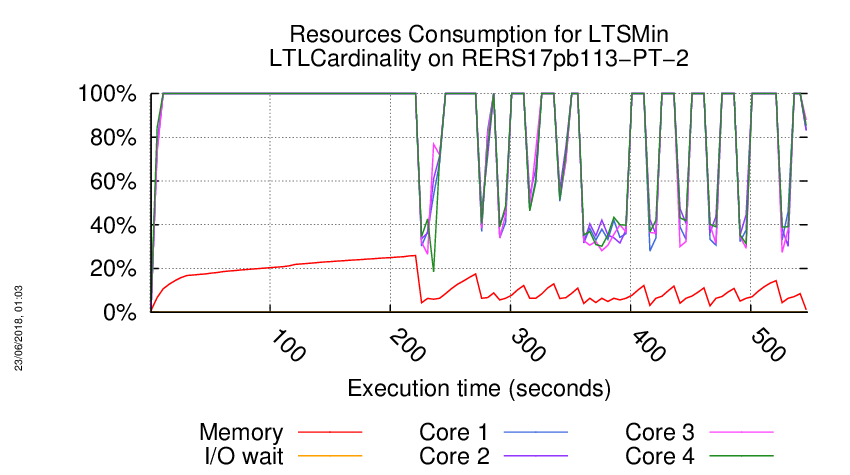
Execution Chart
We display below the execution chart for this examination (boot time has been removed).
Trace from the execution
Waiting for the VM to be ready (probing ssh)
...................
/home/mcc/execution
total 15M
-rw-r--r-- 1 mcc users 3.3K May 30 21:50 CTLCardinality.txt
-rw-r--r-- 1 mcc users 19K May 30 21:50 CTLCardinality.xml
-rw-r--r-- 1 mcc users 3.0K May 29 15:54 CTLFireability.txt
-rw-r--r-- 1 mcc users 15K May 29 15:54 CTLFireability.xml
-rw-r--r-- 1 mcc users 4.0K May 24 11:17 GenericPropertiesDefinition.xml
-rw-r--r-- 1 mcc users 5.4K May 24 11:17 GenericPropertiesVerdict.xml
-rw-r--r-- 1 mcc users 2.5K May 28 09:56 LTLCardinality.txt
-rw-r--r-- 1 mcc users 12K May 28 09:56 LTLCardinality.xml
-rw-r--r-- 1 mcc users 2.1K May 28 08:12 LTLFireability.txt
-rw-r--r-- 1 mcc users 8.2K May 28 08:12 LTLFireability.xml
-rw-r--r-- 1 mcc users 1 May 24 11:17 NewModel
-rw-r--r-- 1 mcc users 3.4K May 28 06:41 ReachabilityCardinality.txt
-rw-r--r-- 1 mcc users 17K May 28 06:41 ReachabilityCardinality.xml
-rw-r--r-- 1 mcc users 107 May 26 06:29 ReachabilityDeadlock.txt
-rw-r--r-- 1 mcc users 345 May 26 06:29 ReachabilityDeadlock.xml
-rw-r--r-- 1 mcc users 3.6K May 27 04:12 ReachabilityFireability.txt
-rw-r--r-- 1 mcc users 17K May 27 04:12 ReachabilityFireability.xml
-rw-r--r-- 1 mcc users 1.6K May 28 07:31 UpperBounds.txt
-rw-r--r-- 1 mcc users 3.6K May 28 07:31 UpperBounds.xml
-rw-r--r-- 1 mcc users 6 May 24 11:17 equiv_col
-rw-r--r-- 1 mcc users 2 May 24 11:17 instance
-rw-r--r-- 1 mcc users 6 May 24 11:17 iscolored
-rw-r--r-- 1 mcc users 15M May 24 11:17 model.pnml
=====================================================================
Generated by BenchKit 2-3637
Executing tool ltsmin
Input is RERS17pb113-PT-2, examination is LTLCardinality
Time confinement is 3600 seconds
Memory confinement is 16384 MBytes
Number of cores is 4
Run identifier is r281-csrt-152749171000392
=====================================================================
--------------------
content from stdout:
=== Data for post analysis generated by BenchKit (invocation template)
The expected result is a vector of booleans
BOOL_VECTOR
here is the order used to build the result vector(from text file)
FORMULA_NAME RERS17pb113-PT-1-LTLCardinality-00
FORMULA_NAME RERS17pb113-PT-1-LTLCardinality-01
FORMULA_NAME RERS17pb113-PT-1-LTLCardinality-02
FORMULA_NAME RERS17pb113-PT-1-LTLCardinality-03
FORMULA_NAME RERS17pb113-PT-1-LTLCardinality-04
FORMULA_NAME RERS17pb113-PT-1-LTLCardinality-05
FORMULA_NAME RERS17pb113-PT-1-LTLCardinality-06
FORMULA_NAME RERS17pb113-PT-1-LTLCardinality-07
FORMULA_NAME RERS17pb113-PT-1-LTLCardinality-08
FORMULA_NAME RERS17pb113-PT-1-LTLCardinality-09
FORMULA_NAME RERS17pb113-PT-1-LTLCardinality-10
FORMULA_NAME RERS17pb113-PT-1-LTLCardinality-11
FORMULA_NAME RERS17pb113-PT-1-LTLCardinality-12
FORMULA_NAME RERS17pb113-PT-1-LTLCardinality-13
FORMULA_NAME RERS17pb113-PT-1-LTLCardinality-14
FORMULA_NAME RERS17pb113-PT-1-LTLCardinality-15
=== Now, execution of the tool begins
BK_START 1527859892464
FORMULA RERS17pb113-PT-1-LTLCardinality-00 CANNOT_COMPUTE
FORMULA RERS17pb113-PT-1-LTLCardinality-01 TRUE TECHNIQUES EXPLICIT PARALLEL_PROCESSING USE_NUPN
FORMULA RERS17pb113-PT-1-LTLCardinality-02 FALSE TECHNIQUES EXPLICIT PARALLEL_PROCESSING USE_NUPN
FORMULA RERS17pb113-PT-1-LTLCardinality-03 FALSE TECHNIQUES EXPLICIT PARALLEL_PROCESSING USE_NUPN
FORMULA RERS17pb113-PT-1-LTLCardinality-04 FALSE TECHNIQUES EXPLICIT PARALLEL_PROCESSING USE_NUPN
FORMULA RERS17pb113-PT-1-LTLCardinality-05 FALSE TECHNIQUES EXPLICIT PARALLEL_PROCESSING USE_NUPN
FORMULA RERS17pb113-PT-1-LTLCardinality-06 FALSE TECHNIQUES EXPLICIT PARALLEL_PROCESSING USE_NUPN
FORMULA RERS17pb113-PT-1-LTLCardinality-07 TRUE TECHNIQUES EXPLICIT PARALLEL_PROCESSING USE_NUPN
FORMULA RERS17pb113-PT-1-LTLCardinality-08 TRUE TECHNIQUES EXPLICIT PARALLEL_PROCESSING USE_NUPN
FORMULA RERS17pb113-PT-1-LTLCardinality-09 TRUE TECHNIQUES EXPLICIT PARALLEL_PROCESSING USE_NUPN
FORMULA RERS17pb113-PT-1-LTLCardinality-10 FALSE TECHNIQUES EXPLICIT PARALLEL_PROCESSING USE_NUPN
FORMULA RERS17pb113-PT-1-LTLCardinality-11 FALSE TECHNIQUES EXPLICIT PARALLEL_PROCESSING USE_NUPN
FORMULA RERS17pb113-PT-1-LTLCardinality-12 FALSE TECHNIQUES EXPLICIT PARALLEL_PROCESSING USE_NUPN
FORMULA RERS17pb113-PT-1-LTLCardinality-13 FALSE TECHNIQUES EXPLICIT PARALLEL_PROCESSING USE_NUPN
FORMULA RERS17pb113-PT-1-LTLCardinality-14 FALSE TECHNIQUES EXPLICIT PARALLEL_PROCESSING USE_NUPN
FORMULA RERS17pb113-PT-1-LTLCardinality-15 FALSE TECHNIQUES EXPLICIT PARALLEL_PROCESSING USE_NUPN
BK_STOP 1527860437978
--------------------
content from stderr:
mcc2018
ltl formula name RERS17pb113-PT-1-LTLCardinality-00
ltl formula formula --ltl=/tmp/ltl_0_
pnml2lts-mc( 0/ 4): Loading model from model.pnml
pnml2lts-mc( 0/ 4): Edge label is id
pnml2lts-mc( 0/ 4): Petri net has 639 places, 31353 transitions and 125418 arcs
pnml2lts-mc( 0/ 4): Petri net RERS17pb113-PT-1 analyzed
pnml2lts-mc( 0/ 4): There are safe places
pnml2lts-mc( 0/ 4): Loading Petri net took 2.560 real 2.910 user 2.440 sys
pnml2lts-mc( 1/ 4): LTL layer: formula: /tmp/ltl_0_
pnml2lts-mc( 0/ 4): There are 640 state labels and 1 edge labels
pnml2lts-mc( 0/ 4): State length is 640, there are 31357 groups
pnml2lts-mc( 0/ 4): Running ufscc using 4 cores
pnml2lts-mc( 0/ 4): Using a tree table with 2^30 elements
pnml2lts-mc( 0/ 4): Successor permutation: dynamic
pnml2lts-mc( 0/ 4): Global bits: 0, count bits: 0, local bits: 0
pnml2lts-mc( 2/ 4): ~1810 levels ~10000 states ~61556 transitions
pnml2lts-mc( 2/ 4): ~1810 levels ~20000 states ~100504 transitions
pnml2lts-mc( 2/ 4): ~1810 levels ~40000 states ~185784 transitions
pnml2lts-mc( 2/ 4): ~1810 levels ~80000 states ~369936 transitions
ltl formula name RERS17pb113-PT-1-LTLCardinality-01
ltl formula formula --ltl=/tmp/ltl_1_
pnml2lts-mc( 0/ 4): Loading model from model.pnml
pnml2lts-mc( 0/ 4): Edge label is id
pnml2lts-mc( 0/ 4): Petri net has 639 places, 31353 transitions and 125418 arcs
pnml2lts-mc( 0/ 4): Petri net RERS17pb113-PT-1 analyzed
pnml2lts-mc( 0/ 4): There are safe places
pnml2lts-mc( 0/ 4): Loading Petri net took 6.670 real 5.450 user 5.600 sys
pnml2lts-mc( 0/ 4): LTL layer: formula: /tmp/ltl_1_
pnml2lts-mc( 0/ 4): buchi has 7 states
pnml2lts-mc( 0/ 4): Weak Buchi automaton detected, adding non-accepting as progress label.
pnml2lts-mc( 0/ 4): There are 641 state labels and 1 edge labels
pnml2lts-mc( 0/ 4): State length is 640, there are 31370 groups
pnml2lts-mc( 0/ 4): Running ufscc using 4 cores
pnml2lts-mc( 0/ 4): Using a tree table with 2^30 elements
pnml2lts-mc( 0/ 4): Successor permutation: dynamic
pnml2lts-mc( 0/ 4): Global bits: 0, count bits: 0, local bits: 0
pnml2lts-mc( 0/ 4):
pnml2lts-mc( 0/ 4): total scc count: 2
pnml2lts-mc( 0/ 4): unique states count: 2
pnml2lts-mc( 0/ 4): unique transitions count: 1
pnml2lts-mc( 0/ 4): - self-loop count: 0
pnml2lts-mc( 0/ 4): - claim dead count: 0
pnml2lts-mc( 0/ 4): - claim found count: 0
pnml2lts-mc( 0/ 4): - claim success count: 6
pnml2lts-mc( 0/ 4): - cum. max stack depth: 6
pnml2lts-mc( 0/ 4):
pnml2lts-mc( 0/ 4): Explored 6 states 8 transitions, fanout: 1.333
pnml2lts-mc( 0/ 4): Total exploration time 0.020 sec (0.000 sec minimum, 0.012 sec on average)
pnml2lts-mc( 0/ 4): States per second: 300, Transitions per second: 400
pnml2lts-mc( 0/ 4):
pnml2lts-mc( 0/ 4): Queue width: 12B, total height: 0, memory: 0.00MB
pnml2lts-mc( 0/ 4): Tree memory: 0.0MB, 348.0 B/state, compr.: 13.6%
pnml2lts-mc( 0/ 4): Tree fill ratio (roots/leafs): 0.0%/0.0%
pnml2lts-mc( 0/ 4): Stored 32381 string chucks using 0MB
pnml2lts-mc( 0/ 4): Total memory used for chunk indexing: 2MB
pnml2lts-mc( 0/ 4): Est. total memory use: 2.0MB (~8194.0MB paged-in)
ltl formula name RERS17pb113-PT-1-LTLCardinality-02
ltl formula formula --ltl=/tmp/ltl_2_
pnml2lts-mc( 0/ 4): Loading model from model.pnml
pnml2lts-mc( 0/ 4): Edge label is id
pnml2lts-mc( 0/ 4): Petri net has 639 places, 31353 transitions and 125418 arcs
pnml2lts-mc( 0/ 4): Petri net RERS17pb113-PT-1 analyzed
pnml2lts-mc( 0/ 4): There are safe places
pnml2lts-mc( 3/ 4): LTL layer: formula: /tmp/ltl_2_
pnml2lts-mc( 0/ 4): Loading Petri net took 6.010 real 4.810 user 5.420 sys
pnml2lts-mc( 0/ 4): Weak Buchi automaton detected, adding non-accepting as progress label.
pnml2lts-mc( 0/ 4): There are 641 state labels and 1 edge labels
pnml2lts-mc( 0/ 4): State length is 640, there are 31356 groups
pnml2lts-mc( 0/ 4): Running ufscc using 4 cores
pnml2lts-mc( 0/ 4): Using a tree table with 2^30 elements
pnml2lts-mc( 0/ 4): Successor permutation: dynamic
pnml2lts-mc( 0/ 4): Global bits: 0, count bits: 0, local bits: 0
pnml2lts-mc( 3/ 4): ~2500 levels ~10000 states ~77312 transitions
pnml2lts-mc( 3/ 4):
pnml2lts-mc( 3/ 4): Accepting cycle FOUND at depth ~3828!
pnml2lts-mc( 3/ 4):
pnml2lts-mc( 0/ 4):
pnml2lts-mc( 0/ 4): total scc count: 0
pnml2lts-mc( 0/ 4): unique states count: 14021
pnml2lts-mc( 0/ 4): unique transitions count: 117021
pnml2lts-mc( 0/ 4): - self-loop count: 1
pnml2lts-mc( 0/ 4): - claim dead count: 0
pnml2lts-mc( 0/ 4): - claim found count: 0
pnml2lts-mc( 0/ 4): - claim success count: 14040
pnml2lts-mc( 0/ 4): - cum. max stack depth: 14040
pnml2lts-mc( 0/ 4):
pnml2lts-mc( 0/ 4): Explored 14040 states 117052 transitions, fanout: 8.337
pnml2lts-mc( 0/ 4): Total exploration time 28.770 sec (28.730 sec minimum, 28.757 sec on average)
pnml2lts-mc( 0/ 4): States per second: 488, Transitions per second: 4069
pnml2lts-mc( 0/ 4):
pnml2lts-mc( 0/ 4): Queue width: 12B, total height: 0, memory: 0.00MB
pnml2lts-mc( 0/ 4): Tree memory: 4.2MB, 37.7 B/state, compr.: 1.5%
pnml2lts-mc( 0/ 4): Tree fill ratio (roots/leafs): 0.0%/0.0%
pnml2lts-mc( 0/ 4): Stored 32381 string chucks using 0MB
pnml2lts-mc( 0/ 4): Total memory used for chunk indexing: 2MB
pnml2lts-mc( 0/ 4): Est. total memory use: 6.2MB (~8194.0MB paged-in)
ltl formula name RERS17pb113-PT-1-LTLCardinality-03
ltl formula formula --ltl=/tmp/ltl_3_
pnml2lts-mc( 0/ 4): Loading model from model.pnml
pnml2lts-mc( 0/ 4): Edge label is id
pnml2lts-mc( 0/ 4): Petri net has 639 places, 31353 transitions and 125418 arcs
pnml2lts-mc( 0/ 4): Petri net RERS17pb113-PT-1 analyzed
pnml2lts-mc( 0/ 4): There are safe places
pnml2lts-mc( 2/ 4): LTL layer: formula: /tmp/ltl_3_
pnml2lts-mc( 0/ 4): Loading Petri net took 6.490 real 4.980 user 5.960 sys
pnml2lts-mc( 0/ 4): There are 640 state labels and 1 edge labels
pnml2lts-mc( 0/ 4): State length is 640, there are 31363 groups
pnml2lts-mc( 0/ 4): Running ufscc using 4 cores
pnml2lts-mc( 0/ 4): Using a tree table with 2^30 elements
pnml2lts-mc( 0/ 4): Successor permutation: dynamic
pnml2lts-mc( 0/ 4): Global bits: 0, count bits: 0, local bits: 0
pnml2lts-mc( 2/ 4):
pnml2lts-mc( 2/ 4): Accepting cycle FOUND at depth ~1159!
pnml2lts-mc( 2/ 4):
pnml2lts-mc( 0/ 4):
pnml2lts-mc( 0/ 4): total scc count: 0
pnml2lts-mc( 0/ 4): unique states count: 3696
pnml2lts-mc( 0/ 4): unique transitions count: 23900
pnml2lts-mc( 0/ 4): - self-loop count: 0
pnml2lts-mc( 0/ 4): - claim dead count: 0
pnml2lts-mc( 0/ 4): - claim found count: 1
pnml2lts-mc( 0/ 4): - claim success count: 3720
pnml2lts-mc( 0/ 4): - cum. max stack depth: 3720
pnml2lts-mc( 0/ 4):
pnml2lts-mc( 0/ 4): Explored 3720 states 23941 transitions, fanout: 6.436
pnml2lts-mc( 0/ 4): Total exploration time 6.840 sec (6.810 sec minimum, 6.830 sec on average)
pnml2lts-mc( 0/ 4): States per second: 544, Transitions per second: 3500
pnml2lts-mc( 0/ 4):
pnml2lts-mc( 0/ 4): Queue width: 12B, total height: 0, memory: 0.00MB
pnml2lts-mc( 0/ 4): Tree memory: 0.8MB, 36.9 B/state, compr.: 1.4%
pnml2lts-mc( 0/ 4): Tree fill ratio (roots/leafs): 0.0%/0.0%
pnml2lts-mc( 0/ 4): Stored 32381 string chucks using 0MB
pnml2lts-mc( 0/ 4): Total memory used for chunk indexing: 2MB
pnml2lts-mc( 0/ 4): Est. total memory use: 2.8MB (~8194.0MB paged-in)
ltl formula name RERS17pb113-PT-1-LTLCardinality-04
ltl formula formula --ltl=/tmp/ltl_4_
pnml2lts-mc( 0/ 4): Loading model from model.pnml
pnml2lts-mc( 0/ 4): Edge label is id
pnml2lts-mc( 0/ 4): Petri net has 639 places, 31353 transitions and 125418 arcs
pnml2lts-mc( 0/ 4): Petri net RERS17pb113-PT-1 analyzed
pnml2lts-mc( 2/ 4): LTL layer: formula: /tmp/ltl_4_
pnml2lts-mc( 0/ 4): There are safe places
pnml2lts-mc( 0/ 4): Loading Petri net took 7.200 real 5.350 user 7.390 sys
pnml2lts-mc( 0/ 4): Weak Buchi automaton detected, adding non-accepting as progress label.
pnml2lts-mc( 0/ 4): There are 641 state labels and 1 edge labels
pnml2lts-mc( 0/ 4): State length is 640, there are 31357 groups
pnml2lts-mc( 0/ 4): Running ufscc using 4 cores
pnml2lts-mc( 0/ 4): Using a tree table with 2^30 elements
pnml2lts-mc( 0/ 4): Successor permutation: dynamic
pnml2lts-mc( 0/ 4): Global bits: 0, count bits: 0, local bits: 0
pnml2lts-mc( 1/ 4):
pnml2lts-mc( 1/ 4): Accepting cycle FOUND at depth ~1810!
pnml2lts-mc( 1/ 4):
pnml2lts-mc( 0/ 4):
pnml2lts-mc( 0/ 4): total scc count: 46
pnml2lts-mc( 0/ 4): unique states count: 6493
pnml2lts-mc( 0/ 4): unique transitions count: 49175
pnml2lts-mc( 0/ 4): - self-loop count: 1
pnml2lts-mc( 0/ 4): - claim dead count: 0
pnml2lts-mc( 0/ 4): - claim found count: 0
pnml2lts-mc( 0/ 4): - claim success count: 6513
pnml2lts-mc( 0/ 4): - cum. max stack depth: 6467
pnml2lts-mc( 0/ 4):
pnml2lts-mc( 0/ 4): Explored 6513 states 49207 transitions, fanout: 7.555
pnml2lts-mc( 0/ 4): Total exploration time 13.090 sec (13.070 sec minimum, 13.085 sec on average)
pnml2lts-mc( 0/ 4): States per second: 498, Transitions per second: 3759
pnml2lts-mc( 0/ 4):
pnml2lts-mc( 0/ 4): Queue width: 12B, total height: 0, memory: 0.00MB
pnml2lts-mc( 0/ 4): Tree memory: 1.8MB, 38.9 B/state, compr.: 1.5%
pnml2lts-mc( 0/ 4): Tree fill ratio (roots/leafs): 0.0%/0.0%
pnml2lts-mc( 0/ 4): Stored 32381 string chucks using 0MB
pnml2lts-mc( 0/ 4): Total memory used for chunk indexing: 2MB
pnml2lts-mc( 0/ 4): Est. total memory use: 3.8MB (~8194.0MB paged-in)
ltl formula name RERS17pb113-PT-1-LTLCardinality-05
ltl formula formula --ltl=/tmp/ltl_5_
pnml2lts-mc( 0/ 4): Loading model from model.pnml
pnml2lts-mc( 0/ 4): Edge label is id
pnml2lts-mc( 0/ 4): Petri net has 639 places, 31353 transitions and 125418 arcs
pnml2lts-mc( 0/ 4): Petri net RERS17pb113-PT-1 analyzed
pnml2lts-mc( 1/ 4): LTL layer: formula: /tmp/ltl_5_
pnml2lts-mc( 0/ 4): There are safe places
pnml2lts-mc( 0/ 4): Loading Petri net took 7.360 real 5.810 user 7.500 sys
pnml2lts-mc( 0/ 4): Weak Buchi automaton detected, adding non-accepting as progress label.
pnml2lts-mc( 0/ 4): There are 641 state labels and 1 edge labels
pnml2lts-mc( 0/ 4): State length is 640, there are 31362 groups
pnml2lts-mc( 0/ 4): Running ufscc using 4 cores
pnml2lts-mc( 0/ 4): Using a tree table with 2^30 elements
pnml2lts-mc( 0/ 4): Successor permutation: dynamic
pnml2lts-mc( 0/ 4): Global bits: 0, count bits: 0, local bits: 0
pnml2lts-mc( 2/ 4):
pnml2lts-mc( 2/ 4): Accepting cycle FOUND at depth ~1810!
pnml2lts-mc( 2/ 4):
pnml2lts-mc( 0/ 4):
pnml2lts-mc( 0/ 4): total scc count: 0
pnml2lts-mc( 0/ 4): unique states count: 7201
pnml2lts-mc( 0/ 4): unique transitions count: 57745
pnml2lts-mc( 0/ 4): - self-loop count: 1
pnml2lts-mc( 0/ 4): - claim dead count: 0
pnml2lts-mc( 0/ 4): - claim found count: 0
pnml2lts-mc( 0/ 4): - claim success count: 7221
pnml2lts-mc( 0/ 4): - cum. max stack depth: 7221
pnml2lts-mc( 0/ 4):
pnml2lts-mc( 0/ 4): Explored 7221 states 57777 transitions, fanout: 8.001
pnml2lts-mc( 0/ 4): Total exploration time 14.310 sec (14.290 sec minimum, 14.303 sec on average)
pnml2lts-mc( 0/ 4): States per second: 505, Transitions per second: 4038
pnml2lts-mc( 0/ 4):
pnml2lts-mc( 0/ 4): Queue width: 12B, total height: 0, memory: 0.00MB
pnml2lts-mc( 0/ 4): Tree memory: 2.1MB, 38.7 B/state, compr.: 1.5%
pnml2lts-mc( 0/ 4): Tree fill ratio (roots/leafs): 0.0%/0.0%
pnml2lts-mc( 0/ 4): Stored 32381 string chucks using 0MB
pnml2lts-mc( 0/ 4): Total memory used for chunk indexing: 2MB
pnml2lts-mc( 0/ 4): Est. total memory use: 4.1MB (~8194.0MB paged-in)
ltl formula name RERS17pb113-PT-1-LTLCardinality-06
ltl formula formula --ltl=/tmp/ltl_6_
pnml2lts-mc( 0/ 4): Loading model from model.pnml
pnml2lts-mc( 0/ 4): Edge label is id
pnml2lts-mc( 0/ 4): Petri net has 639 places, 31353 transitions and 125418 arcs
pnml2lts-mc( 0/ 4): Petri net RERS17pb113-PT-1 analyzed
pnml2lts-mc( 2/ 4): LTL layer: formula: /tmp/ltl_6_
pnml2lts-mc( 0/ 4): There are safe places
pnml2lts-mc( 0/ 4): Loading Petri net took 6.460 real 5.430 user 5.840 sys
pnml2lts-mc( 0/ 4): There are 640 state labels and 1 edge labels
pnml2lts-mc( 0/ 4): State length is 640, there are 31357 groups
pnml2lts-mc( 0/ 4): Running ufscc using 4 cores
pnml2lts-mc( 0/ 4): Using a tree table with 2^30 elements
pnml2lts-mc( 0/ 4): Successor permutation: dynamic
pnml2lts-mc( 0/ 4): Global bits: 0, count bits: 0, local bits: 0
pnml2lts-mc( 0/ 4):
pnml2lts-mc( 0/ 4): Accepting cycle FOUND at depth ~1810!
pnml2lts-mc( 0/ 4):
pnml2lts-mc( 0/ 4):
pnml2lts-mc( 0/ 4): total scc count: 0
pnml2lts-mc( 0/ 4): unique states count: 5987
pnml2lts-mc( 0/ 4): unique transitions count: 45547
pnml2lts-mc( 0/ 4): - self-loop count: 1
pnml2lts-mc( 0/ 4): - claim dead count: 0
pnml2lts-mc( 0/ 4): - claim found count: 0
pnml2lts-mc( 0/ 4): - claim success count: 6009
pnml2lts-mc( 0/ 4): - cum. max stack depth: 6009
pnml2lts-mc( 0/ 4):
pnml2lts-mc( 0/ 4): Explored 6009 states 45582 transitions, fanout: 7.586
pnml2lts-mc( 0/ 4): Total exploration time 12.480 sec (12.470 sec minimum, 12.477 sec on average)
pnml2lts-mc( 0/ 4): States per second: 481, Transitions per second: 3652
pnml2lts-mc( 0/ 4):
pnml2lts-mc( 0/ 4): Queue width: 12B, total height: 0, memory: 0.00MB
pnml2lts-mc( 0/ 4): Tree memory: 1.7MB, 38.8 B/state, compr.: 1.5%
pnml2lts-mc( 0/ 4): Tree fill ratio (roots/leafs): 0.0%/0.0%
pnml2lts-mc( 0/ 4): Stored 32381 string chucks using 0MB
pnml2lts-mc( 0/ 4): Total memory used for chunk indexing: 2MB
pnml2lts-mc( 0/ 4): Est. total memory use: 3.7MB (~8194.0MB paged-in)
ltl formula name RERS17pb113-PT-1-LTLCardinality-07
ltl formula formula --ltl=/tmp/ltl_7_
pnml2lts-mc( 0/ 4): Loading model from model.pnml
pnml2lts-mc( 0/ 4): Edge label is id
pnml2lts-mc( 0/ 4): Petri net has 639 places, 31353 transitions and 125418 arcs
pnml2lts-mc( 0/ 4): Petri net RERS17pb113-PT-1 analyzed
pnml2lts-mc( 0/ 4): There are safe places
pnml2lts-mc( 0/ 4): Loading Petri net took 6.540 real 5.390 user 5.410 sys
pnml2lts-mc( 0/ 4): LTL layer: formula: /tmp/ltl_7_
pnml2lts-mc( 0/ 4): buchi has 1 states
pnml2lts-mc( 0/ 4): Weak Buchi automaton detected, adding non-accepting as progress label.
pnml2lts-mc( 0/ 4): There are 641 state labels and 1 edge labels
pnml2lts-mc( 0/ 4): State length is 640, there are 31354 groups
pnml2lts-mc( 0/ 4): Running ufscc using 4 cores
pnml2lts-mc( 0/ 4): Using a tree table with 2^30 elements
pnml2lts-mc( 0/ 4): Successor permutation: dynamic
pnml2lts-mc( 0/ 4): Global bits: 0, count bits: 0, local bits: 0
pnml2lts-mc( 0/ 4):
pnml2lts-mc( 0/ 4): total scc count: 1
pnml2lts-mc( 0/ 4): unique states count: 1
pnml2lts-mc( 0/ 4): unique transitions count: 0
pnml2lts-mc( 0/ 4): - self-loop count: 0
pnml2lts-mc( 0/ 4): - claim dead count: 0
pnml2lts-mc( 0/ 4): - claim found count: 0
pnml2lts-mc( 0/ 4): - claim success count: 4
pnml2lts-mc( 0/ 4): - cum. max stack depth: 4
pnml2lts-mc( 0/ 4):
pnml2lts-mc( 0/ 4): Explored 4 states 4 transitions, fanout: 1.000
pnml2lts-mc( 0/ 4): Total exploration time 0.020 sec (0.000 sec minimum, 0.015 sec on average)
pnml2lts-mc( 0/ 4): States per second: 200, Transitions per second: 200
pnml2lts-mc( 0/ 4):
pnml2lts-mc( 0/ 4): Queue width: 12B, total height: 0, memory: 0.00MB
pnml2lts-mc( 0/ 4): Tree memory: 0.0MB, 400.0 B/state, compr.: 15.6%
pnml2lts-mc( 0/ 4): Tree fill ratio (roots/leafs): 0.0%/0.0%
pnml2lts-mc( 0/ 4): Stored 32381 string chucks using 0MB
pnml2lts-mc( 0/ 4): Total memory used for chunk indexing: 2MB
pnml2lts-mc( 0/ 4): Est. total memory use: 2.0MB (~8194.0MB paged-in)
ltl formula name RERS17pb113-PT-1-LTLCardinality-08
ltl formula formula --ltl=/tmp/ltl_8_
pnml2lts-mc( 0/ 4): Loading model from model.pnml
pnml2lts-mc( 0/ 4): Edge label is id
pnml2lts-mc( 0/ 4): Petri net has 639 places, 31353 transitions and 125418 arcs
pnml2lts-mc( 0/ 4): Petri net RERS17pb113-PT-1 analyzed
pnml2lts-mc( 1/ 4): LTL layer: formula: /tmp/ltl_8_
pnml2lts-mc( 0/ 4): There are safe places
pnml2lts-mc( 0/ 4): Loading Petri net took 6.350 real 5.600 user 5.360 sys
pnml2lts-mc( 0/ 4): Weak Buchi automaton detected, adding non-accepting as progress label.
pnml2lts-mc( 0/ 4): There are 641 state labels and 1 edge labels
pnml2lts-mc( 0/ 4): State length is 640, there are 31354 groups
pnml2lts-mc( 0/ 4): Running ufscc using 4 cores
pnml2lts-mc( 0/ 4): Using a tree table with 2^30 elements
pnml2lts-mc( 0/ 4): Successor permutation: dynamic
pnml2lts-mc( 0/ 4): Global bits: 0, count bits: 0, local bits: 0
pnml2lts-mc( 0/ 4):
pnml2lts-mc( 0/ 4): total scc count: 1
pnml2lts-mc( 0/ 4): unique states count: 1
pnml2lts-mc( 0/ 4): unique transitions count: 0
pnml2lts-mc( 0/ 4): - self-loop count: 0
pnml2lts-mc( 0/ 4): - claim dead count: 0
pnml2lts-mc( 0/ 4): - claim found count: 0
pnml2lts-mc( 0/ 4): - claim success count: 4
pnml2lts-mc( 0/ 4): - cum. max stack depth: 4
pnml2lts-mc( 0/ 4):
pnml2lts-mc( 0/ 4): Explored 4 states 4 transitions, fanout: 1.000
pnml2lts-mc( 0/ 4): Total exploration time 0.010 sec (0.000 sec minimum, 0.002 sec on average)
pnml2lts-mc( 0/ 4): States per second: 400, Transitions per second: 400
pnml2lts-mc( 0/ 4):
pnml2lts-mc( 0/ 4): Queue width: 12B, total height: 0, memory: 0.00MB
pnml2lts-mc( 0/ 4): Tree memory: 0.0MB, 400.0 B/state, compr.: 15.6%
pnml2lts-mc( 0/ 4): Tree fill ratio (roots/leafs): 0.0%/0.0%
pnml2lts-mc( 0/ 4): Stored 32381 string chucks using 0MB
pnml2lts-mc( 0/ 4): Total memory used for chunk indexing: 2MB
pnml2lts-mc( 0/ 4): Est. total memory use: 2.0MB (~8194.0MB paged-in)
ltl formula name RERS17pb113-PT-1-LTLCardinality-09
ltl formula formula --ltl=/tmp/ltl_9_
pnml2lts-mc( 0/ 4): Loading model from model.pnml
pnml2lts-mc( 0/ 4): Edge label is id
pnml2lts-mc( 0/ 4): Petri net has 639 places, 31353 transitions and 125418 arcs
pnml2lts-mc( 0/ 4): Petri net RERS17pb113-PT-1 analyzed
pnml2lts-mc( 2/ 4): LTL layer: formula: /tmp/ltl_9_
pnml2lts-mc( 0/ 4): There are safe places
pnml2lts-mc( 0/ 4): Loading Petri net took 6.300 real 4.060 user 5.480 sys
pnml2lts-mc( 0/ 4): Weak Buchi automaton detected, adding non-accepting as progress label.
pnml2lts-mc( 0/ 4): There are 641 state labels and 1 edge labels
pnml2lts-mc( 0/ 4): State length is 640, there are 31365 groups
pnml2lts-mc( 0/ 4): Running ufscc using 4 cores
pnml2lts-mc( 0/ 4): Using a tree table with 2^30 elements
pnml2lts-mc( 0/ 4): Successor permutation: dynamic
pnml2lts-mc( 0/ 4): Global bits: 0, count bits: 0, local bits: 0
pnml2lts-mc( 0/ 4):
pnml2lts-mc( 0/ 4): total scc count: 1
pnml2lts-mc( 0/ 4): unique states count: 1
pnml2lts-mc( 0/ 4): unique transitions count: 0
pnml2lts-mc( 0/ 4): - self-loop count: 0
pnml2lts-mc( 0/ 4): - claim dead count: 0
pnml2lts-mc( 0/ 4): - claim found count: 0
pnml2lts-mc( 0/ 4): - claim success count: 4
pnml2lts-mc( 0/ 4): - cum. max stack depth: 4
pnml2lts-mc( 0/ 4):
pnml2lts-mc( 0/ 4): Explored 4 states 4 transitions, fanout: 1.000
pnml2lts-mc( 0/ 4): Total exploration time 0.040 sec (0.020 sec minimum, 0.035 sec on average)
pnml2lts-mc( 0/ 4): States per second: 100, Transitions per second: 100
pnml2lts-mc( 0/ 4):
pnml2lts-mc( 0/ 4): Queue width: 12B, total height: 0, memory: 0.00MB
pnml2lts-mc( 0/ 4): Tree memory: 0.0MB, 400.0 B/state, compr.: 15.6%
pnml2lts-mc( 0/ 4): Tree fill ratio (roots/leafs): 0.0%/0.0%
pnml2lts-mc( 0/ 4): Stored 32381 string chucks using 0MB
pnml2lts-mc( 0/ 4): Total memory used for chunk indexing: 2MB
pnml2lts-mc( 0/ 4): Est. total memory use: 2.0MB (~8194.0MB paged-in)
ltl formula name RERS17pb113-PT-1-LTLCardinality-10
ltl formula formula --ltl=/tmp/ltl_10_
pnml2lts-mc( 0/ 4): Loading model from model.pnml
pnml2lts-mc( 0/ 4): Edge label is id
pnml2lts-mc( 0/ 4): Petri net has 639 places, 31353 transitions and 125418 arcs
pnml2lts-mc( 0/ 4): Petri net RERS17pb113-PT-1 analyzed
pnml2lts-mc( 0/ 4): There are safe places
pnml2lts-mc( 0/ 4): Loading Petri net took 6.900 real 5.460 user 6.250 sys
pnml2lts-mc( 0/ 4): LTL layer: formula: /tmp/ltl_10_
pnml2lts-mc( 0/ 4): buchi has 4 states
pnml2lts-mc( 0/ 4): Weak Buchi automaton detected, adding non-accepting as progress label.
pnml2lts-mc( 0/ 4): There are 641 state labels and 1 edge labels
pnml2lts-mc( 0/ 4): State length is 640, there are 31358 groups
pnml2lts-mc( 0/ 4): Running ufscc using 4 cores
pnml2lts-mc( 0/ 4): Using a tree table with 2^30 elements
pnml2lts-mc( 0/ 4): Successor permutation: dynamic
pnml2lts-mc( 0/ 4): Global bits: 0, count bits: 0, local bits: 0
pnml2lts-mc( 3/ 4):
pnml2lts-mc( 3/ 4): Accepting cycle FOUND at depth ~1810!
pnml2lts-mc( 3/ 4):
pnml2lts-mc( 0/ 4):
pnml2lts-mc( 0/ 4): total scc count: 0
pnml2lts-mc( 0/ 4): unique states count: 7601
pnml2lts-mc( 0/ 4): unique transitions count: 59845
pnml2lts-mc( 0/ 4): - self-loop count: 1
pnml2lts-mc( 0/ 4): - claim dead count: 0
pnml2lts-mc( 0/ 4): - claim found count: 0
pnml2lts-mc( 0/ 4): - claim success count: 7624
pnml2lts-mc( 0/ 4): - cum. max stack depth: 7624
pnml2lts-mc( 0/ 4):
pnml2lts-mc( 0/ 4): Explored 7624 states 59882 transitions, fanout: 7.854
pnml2lts-mc( 0/ 4): Total exploration time 15.990 sec (15.960 sec minimum, 15.978 sec on average)
pnml2lts-mc( 0/ 4): States per second: 477, Transitions per second: 3745
pnml2lts-mc( 0/ 4):
pnml2lts-mc( 0/ 4): Queue width: 12B, total height: 0, memory: 0.00MB
pnml2lts-mc( 0/ 4): Tree memory: 2.2MB, 38.8 B/state, compr.: 1.5%
pnml2lts-mc( 0/ 4): Tree fill ratio (roots/leafs): 0.0%/0.0%
pnml2lts-mc( 0/ 4): Stored 32381 string chucks using 0MB
pnml2lts-mc( 0/ 4): Total memory used for chunk indexing: 2MB
pnml2lts-mc( 0/ 4): Est. total memory use: 4.2MB (~8194.0MB paged-in)
ltl formula name RERS17pb113-PT-1-LTLCardinality-11
ltl formula formula --ltl=/tmp/ltl_11_
pnml2lts-mc( 0/ 4): Loading model from model.pnml
pnml2lts-mc( 0/ 4): Edge label is id
pnml2lts-mc( 0/ 4): Petri net has 639 places, 31353 transitions and 125418 arcs
pnml2lts-mc( 0/ 4): Petri net RERS17pb113-PT-1 analyzed
pnml2lts-mc( 2/ 4): LTL layer: formula: /tmp/ltl_11_
pnml2lts-mc( 0/ 4): There are safe places
pnml2lts-mc( 0/ 4): Loading Petri net took 6.280 real 5.030 user 5.530 sys
pnml2lts-mc( 0/ 4): There are 640 state labels and 1 edge labels
pnml2lts-mc( 0/ 4): State length is 640, there are 31364 groups
pnml2lts-mc( 0/ 4): Running ufscc using 4 cores
pnml2lts-mc( 0/ 4): Using a tree table with 2^30 elements
pnml2lts-mc( 0/ 4): Successor permutation: dynamic
pnml2lts-mc( 0/ 4): Global bits: 0, count bits: 0, local bits: 0
pnml2lts-mc( 2/ 4):
pnml2lts-mc( 2/ 4): Accepting cycle FOUND at depth ~1810!
pnml2lts-mc( 2/ 4):
pnml2lts-mc( 0/ 4):
pnml2lts-mc( 0/ 4): total scc count: 0
pnml2lts-mc( 0/ 4): unique states count: 7241
pnml2lts-mc( 0/ 4): unique transitions count: 57538
pnml2lts-mc( 0/ 4): - self-loop count: 1
pnml2lts-mc( 0/ 4): - claim dead count: 0
pnml2lts-mc( 0/ 4): - claim found count: 0
pnml2lts-mc( 0/ 4): - claim success count: 7268
pnml2lts-mc( 0/ 4): - cum. max stack depth: 7268
pnml2lts-mc( 0/ 4):
pnml2lts-mc( 0/ 4): Explored 7268 states 57583 transitions, fanout: 7.923
pnml2lts-mc( 0/ 4): Total exploration time 15.150 sec (15.140 sec minimum, 15.147 sec on average)
pnml2lts-mc( 0/ 4): States per second: 480, Transitions per second: 3801
pnml2lts-mc( 0/ 4):
pnml2lts-mc( 0/ 4): Queue width: 12B, total height: 0, memory: 0.00MB
pnml2lts-mc( 0/ 4): Tree memory: 2.1MB, 38.9 B/state, compr.: 1.5%
pnml2lts-mc( 0/ 4): Tree fill ratio (roots/leafs): 0.0%/0.0%
pnml2lts-mc( 0/ 4): Stored 32381 string chucks using 0MB
pnml2lts-mc( 0/ 4): Total memory used for chunk indexing: 2MB
pnml2lts-mc( 0/ 4): Est. total memory use: 4.1MB (~8194.0MB paged-in)
ltl formula name RERS17pb113-PT-1-LTLCardinality-12
ltl formula formula --ltl=/tmp/ltl_12_
pnml2lts-mc( 0/ 4): Loading model from model.pnml
pnml2lts-mc( 0/ 4): Edge label is id
pnml2lts-mc( 0/ 4): Petri net has 639 places, 31353 transitions and 125418 arcs
pnml2lts-mc( 0/ 4): Petri net RERS17pb113-PT-1 analyzed
pnml2lts-mc( 2/ 4): LTL layer: formula: /tmp/ltl_12_
pnml2lts-mc( 0/ 4): There are safe places
pnml2lts-mc( 0/ 4): Loading Petri net took 6.760 real 5.520 user 6.540 sys
pnml2lts-mc( 0/ 4): There are 640 state labels and 1 edge labels
pnml2lts-mc( 0/ 4): State length is 640, there are 31357 groups
pnml2lts-mc( 0/ 4): Running ufscc using 4 cores
pnml2lts-mc( 0/ 4): Using a tree table with 2^30 elements
pnml2lts-mc( 0/ 4): Successor permutation: dynamic
pnml2lts-mc( 0/ 4): Global bits: 0, count bits: 0, local bits: 0
pnml2lts-mc( 3/ 4):
pnml2lts-mc( 3/ 4): Accepting cycle FOUND at depth ~1810!
pnml2lts-mc( 3/ 4):
pnml2lts-mc( 0/ 4):
pnml2lts-mc( 0/ 4): total scc count: 0
pnml2lts-mc( 0/ 4): unique states count: 6986
pnml2lts-mc( 0/ 4): unique transitions count: 48943
pnml2lts-mc( 0/ 4): - self-loop count: 1
pnml2lts-mc( 0/ 4): - claim dead count: 0
pnml2lts-mc( 0/ 4): - claim found count: 0
pnml2lts-mc( 0/ 4): - claim success count: 7007
pnml2lts-mc( 0/ 4): - cum. max stack depth: 7007
pnml2lts-mc( 0/ 4):
pnml2lts-mc( 0/ 4): Explored 7007 states 48983 transitions, fanout: 6.991
pnml2lts-mc( 0/ 4): Total exploration time 15.770 sec (15.740 sec minimum, 15.757 sec on average)
pnml2lts-mc( 0/ 4): States per second: 444, Transitions per second: 3106
pnml2lts-mc( 0/ 4):
pnml2lts-mc( 0/ 4): Queue width: 12B, total height: 0, memory: 0.00MB
pnml2lts-mc( 0/ 4): Tree memory: 1.8MB, 38.0 B/state, compr.: 1.5%
pnml2lts-mc( 0/ 4): Tree fill ratio (roots/leafs): 0.0%/0.0%
pnml2lts-mc( 0/ 4): Stored 32381 string chucks using 0MB
pnml2lts-mc( 0/ 4): Total memory used for chunk indexing: 2MB
pnml2lts-mc( 0/ 4): Est. total memory use: 3.8MB (~8194.0MB paged-in)
ltl formula name RERS17pb113-PT-1-LTLCardinality-13
ltl formula formula --ltl=/tmp/ltl_13_
pnml2lts-mc( 0/ 4): Loading model from model.pnml
pnml2lts-mc( 0/ 4): Edge label is id
pnml2lts-mc( 0/ 4): Petri net has 639 places, 31353 transitions and 125418 arcs
pnml2lts-mc( 0/ 4): Petri net RERS17pb113-PT-1 analyzed
pnml2lts-mc( 3/ 4): LTL layer: formula: /tmp/ltl_13_
pnml2lts-mc( 0/ 4): There are safe places
pnml2lts-mc( 0/ 4): Loading Petri net took 6.500 real 4.710 user 6.830 sys
pnml2lts-mc( 0/ 4): Weak Buchi automaton detected, adding non-accepting as progress label.
pnml2lts-mc( 0/ 4): There are 641 state labels and 1 edge labels
pnml2lts-mc( 0/ 4): State length is 640, there are 31356 groups
pnml2lts-mc( 0/ 4): Running ufscc using 4 cores
pnml2lts-mc( 0/ 4): Using a tree table with 2^30 elements
pnml2lts-mc( 0/ 4): Successor permutation: dynamic
pnml2lts-mc( 0/ 4): Global bits: 0, count bits: 0, local bits: 0
pnml2lts-mc( 0/ 4):
pnml2lts-mc( 0/ 4): Accepting cycle FOUND at depth ~1810!
pnml2lts-mc( 0/ 4):
pnml2lts-mc( 0/ 4):
pnml2lts-mc( 0/ 4): total scc count: 0
pnml2lts-mc( 0/ 4): unique states count: 5517
pnml2lts-mc( 0/ 4): unique transitions count: 39185
pnml2lts-mc( 0/ 4): - self-loop count: 1
pnml2lts-mc( 0/ 4): - claim dead count: 0
pnml2lts-mc( 0/ 4): - claim found count: 0
pnml2lts-mc( 0/ 4): - claim success count: 5542
pnml2lts-mc( 0/ 4): - cum. max stack depth: 5542
pnml2lts-mc( 0/ 4):
pnml2lts-mc( 0/ 4): Explored 5542 states 39227 transitions, fanout: 7.078
pnml2lts-mc( 0/ 4): Total exploration time 13.890 sec (13.890 sec minimum, 13.890 sec on average)
pnml2lts-mc( 0/ 4): States per second: 399, Transitions per second: 2824
pnml2lts-mc( 0/ 4):
pnml2lts-mc( 0/ 4): Queue width: 12B, total height: 0, memory: 0.00MB
pnml2lts-mc( 0/ 4): Tree memory: 1.4MB, 38.6 B/state, compr.: 1.5%
pnml2lts-mc( 0/ 4): Tree fill ratio (roots/leafs): 0.0%/0.0%
pnml2lts-mc( 0/ 4): Stored 32381 string chucks using 0MB
pnml2lts-mc( 0/ 4): Total memory used for chunk indexing: 2MB
pnml2lts-mc( 0/ 4): Est. total memory use: 3.4MB (~8194.0MB paged-in)
ltl formula name RERS17pb113-PT-1-LTLCardinality-14
ltl formula formula --ltl=/tmp/ltl_14_
pnml2lts-mc( 0/ 4): Loading model from model.pnml
pnml2lts-mc( 0/ 4): Edge label is id
pnml2lts-mc( 0/ 4): Petri net has 639 places, 31353 transitions and 125418 arcs
pnml2lts-mc( 0/ 4): Petri net RERS17pb113-PT-1 analyzed
pnml2lts-mc( 3/ 4): LTL layer: formula: /tmp/ltl_14_
pnml2lts-mc( 0/ 4): There are safe places
pnml2lts-mc( 0/ 4): Loading Petri net took 7.710 real 6.260 user 6.850 sys
pnml2lts-mc( 0/ 4): Weak Buchi automaton detected, adding non-accepting as progress label.
pnml2lts-mc( 0/ 4): There are 641 state labels and 1 edge labels
pnml2lts-mc( 0/ 4): State length is 640, there are 31354 groups
pnml2lts-mc( 0/ 4): Running ufscc using 4 cores
pnml2lts-mc( 0/ 4): Using a tree table with 2^30 elements
pnml2lts-mc( 0/ 4): Successor permutation: dynamic
pnml2lts-mc( 0/ 4): Global bits: 0, count bits: 0, local bits: 0
pnml2lts-mc( 2/ 4): ~2500 levels ~10000 states ~70404 transitions
pnml2lts-mc( 2/ 4):
pnml2lts-mc( 2/ 4): Accepting cycle FOUND at depth ~3192!
pnml2lts-mc( 2/ 4):
pnml2lts-mc( 0/ 4):
pnml2lts-mc( 0/ 4): total scc count: 0
pnml2lts-mc( 0/ 4): unique states count: 10203
pnml2lts-mc( 0/ 4): unique transitions count: 80337
pnml2lts-mc( 0/ 4): - self-loop count: 0
pnml2lts-mc( 0/ 4): - claim dead count: 0
pnml2lts-mc( 0/ 4): - claim found count: 1
pnml2lts-mc( 0/ 4): - claim success count: 10223
pnml2lts-mc( 0/ 4): - cum. max stack depth: 10223
pnml2lts-mc( 0/ 4):
pnml2lts-mc( 0/ 4): Explored 10223 states 80370 transitions, fanout: 7.862
pnml2lts-mc( 0/ 4): Total exploration time 24.140 sec (24.120 sec minimum, 24.128 sec on average)
pnml2lts-mc( 0/ 4): States per second: 423, Transitions per second: 3329
pnml2lts-mc( 0/ 4):
pnml2lts-mc( 0/ 4): Queue width: 12B, total height: 0, memory: 0.00MB
pnml2lts-mc( 0/ 4): Tree memory: 2.9MB, 37.4 B/state, compr.: 1.5%
pnml2lts-mc( 0/ 4): Tree fill ratio (roots/leafs): 0.0%/0.0%
pnml2lts-mc( 0/ 4): Stored 32381 string chucks using 0MB
pnml2lts-mc( 0/ 4): Total memory used for chunk indexing: 2MB
pnml2lts-mc( 0/ 4): Est. total memory use: 4.9MB (~8194.0MB paged-in)
ltl formula name RERS17pb113-PT-1-LTLCardinality-15
ltl formula formula --ltl=/tmp/ltl_15_
pnml2lts-mc( 0/ 4): Loading model from model.pnml
pnml2lts-mc( 0/ 4): Edge label is id
pnml2lts-mc( 0/ 4): Petri net has 639 places, 31353 transitions and 125418 arcs
pnml2lts-mc( 0/ 4): Petri net RERS17pb113-PT-1 analyzed
pnml2lts-mc( 0/ 4): There are safe places
pnml2lts-mc( 1/ 4): LTL layer: formula: /tmp/ltl_15_
pnml2lts-mc( 0/ 4): Loading Petri net took 7.300 real 5.630 user 7.030 sys
pnml2lts-mc( 0/ 4): Weak Buchi automaton detected, adding non-accepting as progress label.
pnml2lts-mc( 0/ 4): There are 641 state labels and 1 edge labels
pnml2lts-mc( 0/ 4): State length is 640, there are 31358 groups
pnml2lts-mc( 0/ 4): Running ufscc using 4 cores
pnml2lts-mc( 0/ 4): Using a tree table with 2^30 elements
pnml2lts-mc( 0/ 4): Successor permutation: dynamic
pnml2lts-mc( 0/ 4): Global bits: 0, count bits: 0, local bits: 0
pnml2lts-mc( 0/ 4):
pnml2lts-mc( 0/ 4): Accepting cycle FOUND at depth ~1461!
pnml2lts-mc( 0/ 4):
pnml2lts-mc( 0/ 4):
pnml2lts-mc( 0/ 4): total scc count: 0
pnml2lts-mc( 0/ 4): unique states count: 3563
pnml2lts-mc( 0/ 4): unique transitions count: 20394
pnml2lts-mc( 0/ 4): - self-loop count: 0
pnml2lts-mc( 0/ 4): - claim dead count: 0
pnml2lts-mc( 0/ 4): - claim found count: 1
pnml2lts-mc( 0/ 4): - claim success count: 3584
pnml2lts-mc( 0/ 4): - cum. max stack depth: 3584
pnml2lts-mc( 0/ 4):
pnml2lts-mc( 0/ 4): Explored 3584 states 20429 transitions, fanout: 5.700
pnml2lts-mc( 0/ 4): Total exploration time 11.120 sec (11.120 sec minimum, 11.120 sec on average)
pnml2lts-mc( 0/ 4): States per second: 322, Transitions per second: 1837
pnml2lts-mc( 0/ 4):
pnml2lts-mc( 0/ 4): Queue width: 12B, total height: 0, memory: 0.00MB
pnml2lts-mc( 0/ 4): Tree memory: 0.7MB, 37.1 B/state, compr.: 1.4%
pnml2lts-mc( 0/ 4): Tree fill ratio (roots/leafs): 0.0%/0.0%
pnml2lts-mc( 0/ 4): Stored 32381 string chucks using 0MB
pnml2lts-mc( 0/ 4): Total memory used for chunk indexing: 2MB
pnml2lts-mc( 0/ 4): Est. total memory use: 2.7MB (~8194.0MB paged-in)
Sequence of Actions to be Executed by the VM
This is useful if one wants to reexecute the tool in the VM from the submitted image disk.
set -x
# this is for BenchKit: configuration of major elements for the test
export BK_INPUT="RERS17pb113-PT-2"
export BK_EXAMINATION="LTLCardinality"
export BK_TOOL="ltsmin"
export BK_RESULT_DIR="/tmp/BK_RESULTS/OUTPUTS"
export BK_TIME_CONFINEMENT="3600"
export BK_MEMORY_CONFINEMENT="16384"
# this is specific to your benchmark or test
export BIN_DIR="$HOME/BenchKit/bin"
# remove the execution directoty if it exists (to avoid increse of .vmdk images)
if [ -d execution ] ; then
rm -rf execution
fi
tar xzf /home/mcc/BenchKit/INPUTS/RERS17pb113-PT-2.tgz
mv RERS17pb113-PT-2 execution
cd execution
pwd
ls -lh
# this is for BenchKit: explicit launching of the test
echo "====================================================================="
echo " Generated by BenchKit 2-3637"
echo " Executing tool ltsmin"
echo " Input is RERS17pb113-PT-2, examination is LTLCardinality"
echo " Time confinement is $BK_TIME_CONFINEMENT seconds"
echo " Memory confinement is 16384 MBytes"
echo " Number of cores is 4"
echo " Run identifier is r281-csrt-152749171000392"
echo "====================================================================="
echo
echo "--------------------"
echo "content from stdout:"
echo
echo "=== Data for post analysis generated by BenchKit (invocation template)"
echo
if [ "LTLCardinality" = "UpperBounds" ] ; then
echo "The expected result is a vector of positive values"
echo NUM_VECTOR
elif [ "LTLCardinality" != "StateSpace" ] ; then
echo "The expected result is a vector of booleans"
echo BOOL_VECTOR
else
echo "no data necessary for post analysis"
fi
echo
if [ -f "LTLCardinality.txt" ] ; then
echo "here is the order used to build the result vector(from text file)"
for x in $(grep Property LTLCardinality.txt | cut -d ' ' -f 2 | sort -u) ; do
echo "FORMULA_NAME $x"
done
elif [ -f "LTLCardinality.xml" ] ; then # for cunf (txt files deleted;-)
echo echo "here is the order used to build the result vector(from xml file)"
for x in $(grep '
echo "FORMULA_NAME $x"
done
fi
echo
echo "=== Now, execution of the tool begins"
echo
echo -n "BK_START "
date -u +%s%3N
echo
timeout -s 9 $BK_TIME_CONFINEMENT bash -c "/home/mcc/BenchKit/BenchKit_head.sh 2> STDERR ; echo ; echo -n \"BK_STOP \" ; date -u +%s%3N"
if [ $? -eq 137 ] ; then
echo
echo "BK_TIME_CONFINEMENT_REACHED"
fi
echo
echo "--------------------"
echo "content from stderr:"
echo
cat STDERR ;