

About the Execution of LTSMin for ParamProductionCell-PT-0
| Execution Summary | |||||
| Max Memory Used (MB) |
Time wait (ms) | CPU Usage (ms) | I/O Wait (ms) | Computed Result | Execution Status |
| 15918.440 | 51615.00 | 153068.00 | 3017.70 | F?TFFFFFTFTFFTFF | normal |
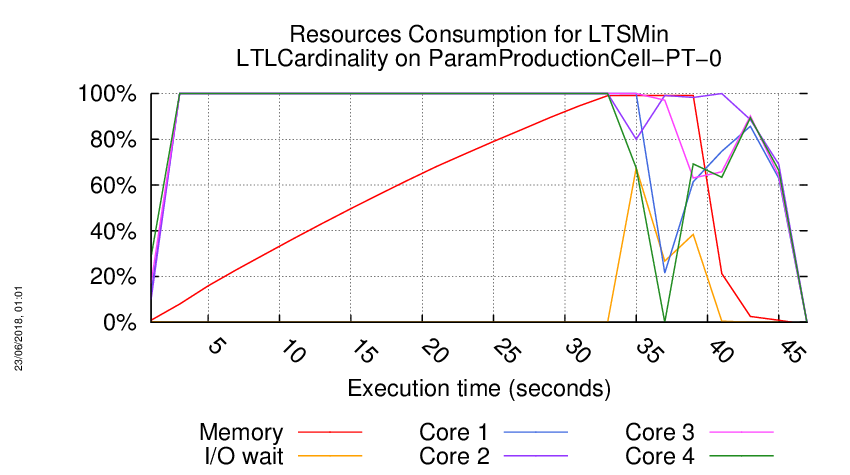
Execution Chart
We display below the execution chart for this examination (boot time has been removed).
Trace from the execution
Waiting for the VM to be ready (probing ssh)
...................
/home/mcc/execution
total 292K
-rw-r--r-- 1 mcc users 3.5K May 15 18:54 CTLCardinality.txt
-rw-r--r-- 1 mcc users 16K May 15 18:54 CTLCardinality.xml
-rw-r--r-- 1 mcc users 3.0K May 15 18:54 CTLFireability.txt
-rw-r--r-- 1 mcc users 16K May 15 18:54 CTLFireability.xml
-rw-r--r-- 1 mcc users 4.0K May 15 18:50 GenericPropertiesDefinition.xml
-rw-r--r-- 1 mcc users 5.8K May 15 18:50 GenericPropertiesVerdict.xml
-rw-r--r-- 1 mcc users 2.8K May 26 09:26 LTLCardinality.txt
-rw-r--r-- 1 mcc users 12K May 26 09:26 LTLCardinality.xml
-rw-r--r-- 1 mcc users 2.1K May 26 09:26 LTLFireability.txt
-rw-r--r-- 1 mcc users 7.9K May 26 09:26 LTLFireability.xml
-rw-r--r-- 1 mcc users 3.6K May 15 18:54 ReachabilityCardinality.txt
-rw-r--r-- 1 mcc users 16K May 15 18:54 ReachabilityCardinality.xml
-rw-r--r-- 1 mcc users 115 May 15 18:54 ReachabilityDeadlock.txt
-rw-r--r-- 1 mcc users 353 May 15 18:54 ReachabilityDeadlock.xml
-rw-r--r-- 1 mcc users 3.3K May 15 18:54 ReachabilityFireability.txt
-rw-r--r-- 1 mcc users 15K May 15 18:54 ReachabilityFireability.xml
-rw-r--r-- 1 mcc users 1.9K May 15 18:54 UpperBounds.txt
-rw-r--r-- 1 mcc users 3.9K May 15 18:54 UpperBounds.xml
-rw-r--r-- 1 mcc users 6 May 15 18:50 equiv_col
-rw-r--r-- 1 mcc users 2 May 15 18:50 instance
-rw-r--r-- 1 mcc users 6 May 15 18:50 iscolored
-rw-r--r-- 1 mcc users 144K May 15 18:50 model.pnml
=====================================================================
Generated by BenchKit 2-3637
Executing tool ltsmin
Input is ParamProductionCell-PT-0, examination is LTLCardinality
Time confinement is 3600 seconds
Memory confinement is 16384 MBytes
Number of cores is 4
Run identifier is r257-csrt-152732583400099
=====================================================================
--------------------
content from stdout:
=== Data for post analysis generated by BenchKit (invocation template)
The expected result is a vector of booleans
BOOL_VECTOR
here is the order used to build the result vector(from text file)
FORMULA_NAME ParamProductionCell-PT-0-LTLCardinality-00
FORMULA_NAME ParamProductionCell-PT-0-LTLCardinality-01
FORMULA_NAME ParamProductionCell-PT-0-LTLCardinality-02
FORMULA_NAME ParamProductionCell-PT-0-LTLCardinality-03
FORMULA_NAME ParamProductionCell-PT-0-LTLCardinality-04
FORMULA_NAME ParamProductionCell-PT-0-LTLCardinality-05
FORMULA_NAME ParamProductionCell-PT-0-LTLCardinality-06
FORMULA_NAME ParamProductionCell-PT-0-LTLCardinality-07
FORMULA_NAME ParamProductionCell-PT-0-LTLCardinality-08
FORMULA_NAME ParamProductionCell-PT-0-LTLCardinality-09
FORMULA_NAME ParamProductionCell-PT-0-LTLCardinality-10
FORMULA_NAME ParamProductionCell-PT-0-LTLCardinality-11
FORMULA_NAME ParamProductionCell-PT-0-LTLCardinality-12
FORMULA_NAME ParamProductionCell-PT-0-LTLCardinality-13
FORMULA_NAME ParamProductionCell-PT-0-LTLCardinality-14
FORMULA_NAME ParamProductionCell-PT-0-LTLCardinality-15
=== Now, execution of the tool begins
BK_START 1527449773753
FORMULA ParamProductionCell-PT-0-LTLCardinality-00 FALSE TECHNIQUES EXPLICIT PARALLEL_PROCESSING USE_NUPN
FORMULA ParamProductionCell-PT-0-LTLCardinality-01 CANNOT_COMPUTE
FORMULA ParamProductionCell-PT-0-LTLCardinality-02 TRUE TECHNIQUES EXPLICIT PARALLEL_PROCESSING USE_NUPN
FORMULA ParamProductionCell-PT-0-LTLCardinality-03 FALSE TECHNIQUES EXPLICIT PARALLEL_PROCESSING USE_NUPN
FORMULA ParamProductionCell-PT-0-LTLCardinality-04 FALSE TECHNIQUES EXPLICIT PARALLEL_PROCESSING USE_NUPN
FORMULA ParamProductionCell-PT-0-LTLCardinality-05 FALSE TECHNIQUES EXPLICIT PARALLEL_PROCESSING USE_NUPN
FORMULA ParamProductionCell-PT-0-LTLCardinality-06 FALSE TECHNIQUES EXPLICIT PARALLEL_PROCESSING USE_NUPN
FORMULA ParamProductionCell-PT-0-LTLCardinality-07 FALSE TECHNIQUES EXPLICIT PARALLEL_PROCESSING USE_NUPN
FORMULA ParamProductionCell-PT-0-LTLCardinality-08 TRUE TECHNIQUES EXPLICIT PARALLEL_PROCESSING USE_NUPN
FORMULA ParamProductionCell-PT-0-LTLCardinality-09 FALSE TECHNIQUES EXPLICIT PARALLEL_PROCESSING USE_NUPN
FORMULA ParamProductionCell-PT-0-LTLCardinality-10 TRUE TECHNIQUES EXPLICIT PARALLEL_PROCESSING USE_NUPN
FORMULA ParamProductionCell-PT-0-LTLCardinality-11 FALSE TECHNIQUES EXPLICIT PARALLEL_PROCESSING USE_NUPN
FORMULA ParamProductionCell-PT-0-LTLCardinality-12 FALSE TECHNIQUES EXPLICIT PARALLEL_PROCESSING USE_NUPN
FORMULA ParamProductionCell-PT-0-LTLCardinality-13 TRUE TECHNIQUES EXPLICIT PARALLEL_PROCESSING USE_NUPN
FORMULA ParamProductionCell-PT-0-LTLCardinality-14 FALSE TECHNIQUES EXPLICIT PARALLEL_PROCESSING USE_NUPN
FORMULA ParamProductionCell-PT-0-LTLCardinality-15 FALSE TECHNIQUES EXPLICIT PARALLEL_PROCESSING USE_NUPN
BK_STOP 1527449825368
--------------------
content from stderr:
mcc2018
ltl formula name ParamProductionCell-PT-0-LTLCardinality-00
ltl formula formula --ltl=/tmp/ltl_0_
pnml2lts-mc( 0/ 4): Loading model from model.pnml
pnml2lts-mc( 0/ 4): Edge label is id
pnml2lts-mc( 0/ 4): Petri net has 198 places, 176 transitions and 730 arcs
pnml2lts-mc( 0/ 4): Petri net ParamProductionCell-PT-0 analyzed
pnml2lts-mc( 0/ 4): There are no safe places
pnml2lts-mc( 2/ 4): LTL layer: formula: /tmp/ltl_0_
pnml2lts-mc( 0/ 4): Loading Petri net took 0.050 real 0.040 user 0.010 sys
pnml2lts-mc( 0/ 4): Weak Buchi automaton detected, adding non-accepting as progress label.
pnml2lts-mc( 0/ 4): There are 200 state labels and 1 edge labels
pnml2lts-mc( 0/ 4): State length is 199, there are 178 groups
pnml2lts-mc( 0/ 4): Running ufscc using 4 cores
pnml2lts-mc( 0/ 4): Using a tree table with 2^30 elements
pnml2lts-mc( 0/ 4): Successor permutation: dynamic
pnml2lts-mc( 0/ 4): Global bits: 0, count bits: 0, local bits: 0
pnml2lts-mc( 2/ 4):
pnml2lts-mc( 2/ 4): Accepting cycle FOUND at depth ~167!
pnml2lts-mc( 2/ 4):
pnml2lts-mc( 0/ 4):
pnml2lts-mc( 0/ 4): total scc count: 0
pnml2lts-mc( 0/ 4): unique states count: 517
pnml2lts-mc( 0/ 4): unique transitions count: 1106
pnml2lts-mc( 0/ 4): - self-loop count: 0
pnml2lts-mc( 0/ 4): - claim dead count: 0
pnml2lts-mc( 0/ 4): - claim found count: 2
pnml2lts-mc( 0/ 4): - claim success count: 572
pnml2lts-mc( 0/ 4): - cum. max stack depth: 572
pnml2lts-mc( 0/ 4):
pnml2lts-mc( 0/ 4): Explored 572 states 1193 transitions, fanout: 2.086
pnml2lts-mc( 0/ 4): Total exploration time 0.080 sec (0.060 sec minimum, 0.067 sec on average)
pnml2lts-mc( 0/ 4): States per second: 7150, Transitions per second: 14912
pnml2lts-mc( 0/ 4):
pnml2lts-mc( 0/ 4): Queue width: 12B, total height: 0, memory: 0.00MB
pnml2lts-mc( 0/ 4): Tree memory: 0.0MB, 23.9 B/state, compr.: 3.0%
pnml2lts-mc( 0/ 4): Tree fill ratio (roots/leafs): 0.0%/0.0%
pnml2lts-mc( 0/ 4): Stored 176 string chucks using 0MB
pnml2lts-mc( 0/ 4): Total memory used for chunk indexing: 0MB
pnml2lts-mc( 0/ 4): Est. total memory use: 0.0MB (~8192.0MB paged-in)
ltl formula name ParamProductionCell-PT-0-LTLCardinality-01
ltl formula formula --ltl=/tmp/ltl_1_
pnml2lts-mc( 0/ 4): Loading model from model.pnml
pnml2lts-mc( 0/ 4): Edge label is id
pnml2lts-mc( 0/ 4): Petri net has 198 places, 176 transitions and 730 arcs
pnml2lts-mc( 0/ 4): Petri net ParamProductionCell-PT-0 analyzed
pnml2lts-mc( 0/ 4): There are no safe places
pnml2lts-mc( 0/ 4): Loading Petri net took 0.030 real 0.030 user 0.010 sys
pnml2lts-mc( 2/ 4): LTL layer: formula: /tmp/ltl_1_
pnml2lts-mc( 0/ 4): Weak Buchi automaton detected, adding non-accepting as progress label.
pnml2lts-mc( 0/ 4): There are 200 state labels and 1 edge labels
pnml2lts-mc( 0/ 4): State length is 199, there are 182 groups
pnml2lts-mc( 0/ 4): Running ufscc using 4 cores
pnml2lts-mc( 0/ 4): Using a tree table with 2^30 elements
pnml2lts-mc( 0/ 4): Successor permutation: dynamic
pnml2lts-mc( 0/ 4): Global bits: 0, count bits: 0, local bits: 0
pnml2lts-mc( 1/ 4): ~570 levels ~10000 states ~20560 transitions
pnml2lts-mc( 1/ 4): ~705 levels ~20000 states ~39792 transitions
pnml2lts-mc( 0/ 4): ~1371 levels ~40000 states ~86552 transitions
pnml2lts-mc( 0/ 4): ~1371 levels ~80000 states ~187704 transitions
pnml2lts-mc( 2/ 4): ~3012 levels ~160000 states ~392600 transitions
pnml2lts-mc( 0/ 4): ~17829 levels ~320000 states ~988916 transitions
pnml2lts-mc( 0/ 4): ~44592 levels ~640000 states ~2410448 transitions
pnml2lts-mc( 3/ 4): ~108217 levels ~1280000 states ~5580464 transitions
pnml2lts-mc( 3/ 4): ~139447 levels ~2560000 states ~11865128 transitions
ltl formula name ParamProductionCell-PT-0-LTLCardinality-02
ltl formula formula --ltl=/tmp/ltl_2_
pnml2lts-mc( 0/ 4): Loading model from model.pnml
pnml2lts-mc( 0/ 4): Edge label is id
pnml2lts-mc( 0/ 4): Petri net has 198 places, 176 transitions and 730 arcs
pnml2lts-mc( 0/ 4): Petri net ParamProductionCell-PT-0 analyzed
pnml2lts-mc( 0/ 4): There are no safe places
pnml2lts-mc( 0/ 4): Loading Petri net took 0.070 real 0.020 user 0.050 sys
pnml2lts-mc( 0/ 4): LTL layer: formula: /tmp/ltl_2_
pnml2lts-mc( 0/ 4): buchi has 1 states
pnml2lts-mc( 0/ 4): Weak Buchi automaton detected, adding non-accepting as progress label.
pnml2lts-mc( 0/ 4): There are 200 state labels and 1 edge labels
pnml2lts-mc( 0/ 4): State length is 199, there are 177 groups
pnml2lts-mc( 0/ 4): Running ufscc using 4 cores
pnml2lts-mc( 0/ 4): Using a tree table with 2^30 elements
pnml2lts-mc( 0/ 4): Successor permutation: dynamic
pnml2lts-mc( 0/ 4): Global bits: 0, count bits: 0, local bits: 0
pnml2lts-mc( 0/ 4):
pnml2lts-mc( 0/ 4): total scc count: 1
pnml2lts-mc( 0/ 4): unique states count: 1
pnml2lts-mc( 0/ 4): unique transitions count: 0
pnml2lts-mc( 0/ 4): - self-loop count: 0
pnml2lts-mc( 0/ 4): - claim dead count: 0
pnml2lts-mc( 0/ 4): - claim found count: 0
pnml2lts-mc( 0/ 4): - claim success count: 4
pnml2lts-mc( 0/ 4): - cum. max stack depth: 4
pnml2lts-mc( 0/ 4):
pnml2lts-mc( 0/ 4): Explored 4 states 4 transitions, fanout: 1.000
pnml2lts-mc( 0/ 4): Total exploration time 0.010 sec (0.000 sec minimum, 0.002 sec on average)
pnml2lts-mc( 0/ 4): States per second: 400, Transitions per second: 400
pnml2lts-mc( 0/ 4):
pnml2lts-mc( 0/ 4): Queue width: 12B, total height: 0, memory: 0.00MB
pnml2lts-mc( 0/ 4): Tree memory: 0.0MB, 368.0 B/state, compr.: 46.1%
pnml2lts-mc( 0/ 4): Tree fill ratio (roots/leafs): 0.0%/0.0%
pnml2lts-mc( 0/ 4): Stored 176 string chucks using 0MB
pnml2lts-mc( 0/ 4): Total memory used for chunk indexing: 0MB
pnml2lts-mc( 0/ 4): Est. total memory use: 0.0MB (~8192.0MB paged-in)
ltl formula name ParamProductionCell-PT-0-LTLCardinality-03
ltl formula formula --ltl=/tmp/ltl_3_
pnml2lts-mc( 0/ 4): Loading model from model.pnml
pnml2lts-mc( 0/ 4): Edge label is id
pnml2lts-mc( 0/ 4): Petri net has 198 places, 176 transitions and 730 arcs
pnml2lts-mc( 0/ 4): Petri net ParamProductionCell-PT-0 analyzed
pnml2lts-mc( 0/ 4): There are no safe places
pnml2lts-mc( 0/ 4): Loading Petri net took 0.070 real 0.010 user 0.070 sys
pnml2lts-mc( 0/ 4): LTL layer: formula: /tmp/ltl_3_
pnml2lts-mc( 0/ 4): buchi has 3 states
pnml2lts-mc( 0/ 4): Weak Buchi automaton detected, adding non-accepting as progress label.
pnml2lts-mc( 0/ 4): There are 200 state labels and 1 edge labels
pnml2lts-mc( 0/ 4): State length is 199, there are 183 groups
pnml2lts-mc( 0/ 4): Running ufscc using 4 cores
pnml2lts-mc( 0/ 4): Using a tree table with 2^30 elements
pnml2lts-mc( 0/ 4): Successor permutation: dynamic
pnml2lts-mc( 0/ 4): Global bits: 0, count bits: 0, local bits: 0
pnml2lts-mc( 1/ 4):
pnml2lts-mc( 1/ 4): Accepting cycle FOUND at depth ~141!
pnml2lts-mc( 1/ 4):
pnml2lts-mc( 0/ 4):
pnml2lts-mc( 0/ 4): total scc count: 0
pnml2lts-mc( 0/ 4): unique states count: 757
pnml2lts-mc( 0/ 4): unique transitions count: 3363
pnml2lts-mc( 0/ 4): - self-loop count: 0
pnml2lts-mc( 0/ 4): - claim dead count: 0
pnml2lts-mc( 0/ 4): - claim found count: 1
pnml2lts-mc( 0/ 4): - claim success count: 815
pnml2lts-mc( 0/ 4): - cum. max stack depth: 815
pnml2lts-mc( 0/ 4):
pnml2lts-mc( 0/ 4): Explored 815 states 3500 transitions, fanout: 4.294
pnml2lts-mc( 0/ 4): Total exploration time 0.120 sec (0.090 sec minimum, 0.102 sec on average)
pnml2lts-mc( 0/ 4): States per second: 6792, Transitions per second: 29167
pnml2lts-mc( 0/ 4):
pnml2lts-mc( 0/ 4): Queue width: 12B, total height: 0, memory: 0.00MB
pnml2lts-mc( 0/ 4): Tree memory: 0.0MB, 21.7 B/state, compr.: 2.7%
pnml2lts-mc( 0/ 4): Tree fill ratio (roots/leafs): 0.0%/0.0%
pnml2lts-mc( 0/ 4): Stored 176 string chucks using 0MB
pnml2lts-mc( 0/ 4): Total memory used for chunk indexing: 0MB
pnml2lts-mc( 0/ 4): Est. total memory use: 0.0MB (~8192.0MB paged-in)
ltl formula name ParamProductionCell-PT-0-LTLCardinality-04
ltl formula formula --ltl=/tmp/ltl_4_
pnml2lts-mc( 0/ 4): Loading model from model.pnml
pnml2lts-mc( 0/ 4): Edge label is id
pnml2lts-mc( 0/ 4): Petri net has 198 places, 176 transitions and 730 arcs
pnml2lts-mc( 0/ 4): Petri net ParamProductionCell-PT-0 analyzed
pnml2lts-mc( 0/ 4): There are no safe places
pnml2lts-mc( 0/ 4): Loading Petri net took 0.080 real 0.040 user 0.060 sys
pnml2lts-mc( 0/ 4): LTL layer: formula: /tmp/ltl_4_
pnml2lts-mc( 0/ 4): buchi has 2 states
pnml2lts-mc( 0/ 4): There are 199 state labels and 1 edge labels
pnml2lts-mc( 0/ 4): State length is 199, there are 180 groups
pnml2lts-mc( 0/ 4): Running ufscc using 4 cores
pnml2lts-mc( 0/ 4): Using a tree table with 2^30 elements
pnml2lts-mc( 0/ 4): Successor permutation: dynamic
pnml2lts-mc( 0/ 4): Global bits: 0, count bits: 0, local bits: 0
pnml2lts-mc( 2/ 4):
pnml2lts-mc( 2/ 4): Accepting cycle FOUND at depth ~163!
pnml2lts-mc( 2/ 4):
pnml2lts-mc( 0/ 4):
pnml2lts-mc( 0/ 4): total scc count: 0
pnml2lts-mc( 0/ 4): unique states count: 491
pnml2lts-mc( 0/ 4): unique transitions count: 1059
pnml2lts-mc( 0/ 4): - self-loop count: 0
pnml2lts-mc( 0/ 4): - claim dead count: 0
pnml2lts-mc( 0/ 4): - claim found count: 1
pnml2lts-mc( 0/ 4): - claim success count: 523
pnml2lts-mc( 0/ 4): - cum. max stack depth: 523
pnml2lts-mc( 0/ 4):
pnml2lts-mc( 0/ 4): Explored 523 states 1103 transitions, fanout: 2.109
pnml2lts-mc( 0/ 4): Total exploration time 0.080 sec (0.050 sec minimum, 0.062 sec on average)
pnml2lts-mc( 0/ 4): States per second: 6538, Transitions per second: 13788
pnml2lts-mc( 0/ 4):
pnml2lts-mc( 0/ 4): Queue width: 12B, total height: 0, memory: 0.00MB
pnml2lts-mc( 0/ 4): Tree memory: 0.0MB, 23.8 B/state, compr.: 3.0%
pnml2lts-mc( 0/ 4): Tree fill ratio (roots/leafs): 0.0%/0.0%
pnml2lts-mc( 0/ 4): Stored 176 string chucks using 0MB
pnml2lts-mc( 0/ 4): Total memory used for chunk indexing: 0MB
pnml2lts-mc( 0/ 4): Est. total memory use: 0.0MB (~8192.0MB paged-in)
ltl formula name ParamProductionCell-PT-0-LTLCardinality-05
ltl formula formula --ltl=/tmp/ltl_5_
pnml2lts-mc( 0/ 4): Loading model from model.pnml
pnml2lts-mc( 0/ 4): Edge label is id
pnml2lts-mc( 0/ 4): Petri net has 198 places, 176 transitions and 730 arcs
pnml2lts-mc( 0/ 4): Petri net ParamProductionCell-PT-0 analyzed
pnml2lts-mc( 0/ 4): There are no safe places
pnml2lts-mc( 1/ 4): LTL layer: formula: /tmp/ltl_5_
pnml2lts-mc( 0/ 4): Loading Petri net took 0.100 real 0.040 user 0.100 sys
pnml2lts-mc( 0/ 4): Weak Buchi automaton detected, adding non-accepting as progress label.
pnml2lts-mc( 0/ 4): There are 200 state labels and 1 edge labels
pnml2lts-mc( 0/ 4): State length is 199, there are 177 groups
pnml2lts-mc( 0/ 4): Running ufscc using 4 cores
pnml2lts-mc( 0/ 4): Using a tree table with 2^30 elements
pnml2lts-mc( 0/ 4): Successor permutation: dynamic
pnml2lts-mc( 0/ 4): Global bits: 0, count bits: 0, local bits: 0
pnml2lts-mc( 1/ 4):
pnml2lts-mc( 1/ 4): Accepting cycle FOUND at depth ~139!
pnml2lts-mc( 1/ 4):
pnml2lts-mc( 0/ 4):
pnml2lts-mc( 0/ 4): total scc count: 0
pnml2lts-mc( 0/ 4): unique states count: 615
pnml2lts-mc( 0/ 4): unique transitions count: 1256
pnml2lts-mc( 0/ 4): - self-loop count: 0
pnml2lts-mc( 0/ 4): - claim dead count: 0
pnml2lts-mc( 0/ 4): - claim found count: 1
pnml2lts-mc( 0/ 4): - claim success count: 701
pnml2lts-mc( 0/ 4): - cum. max stack depth: 701
pnml2lts-mc( 0/ 4):
pnml2lts-mc( 0/ 4): Explored 701 states 1409 transitions, fanout: 2.010
pnml2lts-mc( 0/ 4): Total exploration time 0.100 sec (0.060 sec minimum, 0.085 sec on average)
pnml2lts-mc( 0/ 4): States per second: 7010, Transitions per second: 14090
pnml2lts-mc( 0/ 4):
pnml2lts-mc( 0/ 4): Queue width: 12B, total height: 0, memory: 0.00MB
pnml2lts-mc( 0/ 4): Tree memory: 0.0MB, 21.7 B/state, compr.: 2.7%
pnml2lts-mc( 0/ 4): Tree fill ratio (roots/leafs): 0.0%/0.0%
pnml2lts-mc( 0/ 4): Stored 176 string chucks using 0MB
pnml2lts-mc( 0/ 4): Total memory used for chunk indexing: 0MB
pnml2lts-mc( 0/ 4): Est. total memory use: 0.0MB (~8192.0MB paged-in)
ltl formula name ParamProductionCell-PT-0-LTLCardinality-06
ltl formula formula --ltl=/tmp/ltl_6_
pnml2lts-mc( 0/ 4): Loading model from model.pnml
pnml2lts-mc( 0/ 4): Edge label is id
pnml2lts-mc( 0/ 4): Petri net has 198 places, 176 transitions and 730 arcs
pnml2lts-mc( 0/ 4): Petri net ParamProductionCell-PT-0 analyzed
pnml2lts-mc( 1/ 4): LTL layer: formula: /tmp/ltl_6_
pnml2lts-mc( 0/ 4): There are no safe places
pnml2lts-mc( 0/ 4): Loading Petri net took 0.070 real 0.030 user 0.070 sys
pnml2lts-mc( 0/ 4): Weak Buchi automaton detected, adding non-accepting as progress label.
pnml2lts-mc( 0/ 4): There are 200 state labels and 1 edge labels
pnml2lts-mc( 0/ 4): State length is 199, there are 179 groups
pnml2lts-mc( 0/ 4): Running ufscc using 4 cores
pnml2lts-mc( 0/ 4): Using a tree table with 2^30 elements
pnml2lts-mc( 0/ 4): Successor permutation: dynamic
pnml2lts-mc( 0/ 4): Global bits: 0, count bits: 0, local bits: 0
pnml2lts-mc( 2/ 4):
pnml2lts-mc( 2/ 4): Accepting cycle FOUND at depth ~139!
pnml2lts-mc( 2/ 4):
pnml2lts-mc( 0/ 4):
pnml2lts-mc( 0/ 4): total scc count: 0
pnml2lts-mc( 0/ 4): unique states count: 504
pnml2lts-mc( 0/ 4): unique transitions count: 1255
pnml2lts-mc( 0/ 4): - self-loop count: 0
pnml2lts-mc( 0/ 4): - claim dead count: 0
pnml2lts-mc( 0/ 4): - claim found count: 2
pnml2lts-mc( 0/ 4): - claim success count: 559
pnml2lts-mc( 0/ 4): - cum. max stack depth: 559
pnml2lts-mc( 0/ 4):
pnml2lts-mc( 0/ 4): Explored 559 states 1353 transitions, fanout: 2.420
pnml2lts-mc( 0/ 4): Total exploration time 0.070 sec (0.060 sec minimum, 0.065 sec on average)
pnml2lts-mc( 0/ 4): States per second: 7986, Transitions per second: 19329
pnml2lts-mc( 0/ 4):
pnml2lts-mc( 0/ 4): Queue width: 12B, total height: 0, memory: 0.00MB
pnml2lts-mc( 0/ 4): Tree memory: 0.0MB, 22.7 B/state, compr.: 2.8%
pnml2lts-mc( 0/ 4): Tree fill ratio (roots/leafs): 0.0%/0.0%
pnml2lts-mc( 0/ 4): Stored 176 string chucks using 0MB
pnml2lts-mc( 0/ 4): Total memory used for chunk indexing: 0MB
pnml2lts-mc( 0/ 4): Est. total memory use: 0.0MB (~8192.0MB paged-in)
ltl formula name ParamProductionCell-PT-0-LTLCardinality-07
ltl formula formula --ltl=/tmp/ltl_7_
pnml2lts-mc( 0/ 4): Loading model from model.pnml
pnml2lts-mc( 0/ 4): Edge label is id
pnml2lts-mc( 0/ 4): Petri net has 198 places, 176 transitions and 730 arcs
pnml2lts-mc( 0/ 4): Petri net ParamProductionCell-PT-0 analyzed
pnml2lts-mc( 0/ 4): There are no safe places
pnml2lts-mc( 0/ 4): Loading Petri net took 0.140 real 0.380 user 0.050 sys
pnml2lts-mc( 0/ 4): LTL layer: formula: /tmp/ltl_7_
pnml2lts-mc( 0/ 4): buchi has 2 states
pnml2lts-mc( 0/ 4): There are 199 state labels and 1 edge labels
pnml2lts-mc( 0/ 4): State length is 199, there are 180 groups
pnml2lts-mc( 0/ 4): Running ufscc using 4 cores
pnml2lts-mc( 0/ 4): Using a tree table with 2^30 elements
pnml2lts-mc( 0/ 4): Successor permutation: dynamic
pnml2lts-mc( 0/ 4): Global bits: 0, count bits: 0, local bits: 0
pnml2lts-mc( 2/ 4):
pnml2lts-mc( 2/ 4): Accepting cycle FOUND at depth ~141!
pnml2lts-mc( 2/ 4):
pnml2lts-mc( 0/ 4):
pnml2lts-mc( 0/ 4): total scc count: 0
pnml2lts-mc( 0/ 4): unique states count: 608
pnml2lts-mc( 0/ 4): unique transitions count: 1329
pnml2lts-mc( 0/ 4): - self-loop count: 0
pnml2lts-mc( 0/ 4): - claim dead count: 0
pnml2lts-mc( 0/ 4): - claim found count: 1
pnml2lts-mc( 0/ 4): - claim success count: 644
pnml2lts-mc( 0/ 4): - cum. max stack depth: 644
pnml2lts-mc( 0/ 4):
pnml2lts-mc( 0/ 4): Explored 644 states 1395 transitions, fanout: 2.166
pnml2lts-mc( 0/ 4): Total exploration time 0.090 sec (0.050 sec minimum, 0.070 sec on average)
pnml2lts-mc( 0/ 4): States per second: 7156, Transitions per second: 15500
pnml2lts-mc( 0/ 4):
pnml2lts-mc( 0/ 4): Queue width: 12B, total height: 0, memory: 0.00MB
pnml2lts-mc( 0/ 4): Tree memory: 0.0MB, 21.5 B/state, compr.: 2.7%
pnml2lts-mc( 0/ 4): Tree fill ratio (roots/leafs): 0.0%/0.0%
pnml2lts-mc( 0/ 4): Stored 176 string chucks using 0MB
pnml2lts-mc( 0/ 4): Total memory used for chunk indexing: 0MB
pnml2lts-mc( 0/ 4): Est. total memory use: 0.0MB (~8192.0MB paged-in)
ltl formula name ParamProductionCell-PT-0-LTLCardinality-08
ltl formula formula --ltl=/tmp/ltl_8_
pnml2lts-mc( 0/ 4): Loading model from model.pnml
pnml2lts-mc( 0/ 4): Edge label is id
pnml2lts-mc( 0/ 4): Petri net has 198 places, 176 transitions and 730 arcs
pnml2lts-mc( 0/ 4): Petri net ParamProductionCell-PT-0 analyzed
pnml2lts-mc( 0/ 4): There are no safe places
pnml2lts-mc( 0/ 4): Loading Petri net took 0.080 real 0.070 user 0.040 sys
pnml2lts-mc( 3/ 4): LTL layer: formula: /tmp/ltl_8_
pnml2lts-mc( 0/ 4): Weak Buchi automaton detected, adding non-accepting as progress label.
pnml2lts-mc( 0/ 4): There are 200 state labels and 1 edge labels
pnml2lts-mc( 0/ 4): State length is 199, there are 178 groups
pnml2lts-mc( 0/ 4): Running ufscc using 4 cores
pnml2lts-mc( 0/ 4): Using a tree table with 2^30 elements
pnml2lts-mc( 0/ 4): Successor permutation: dynamic
pnml2lts-mc( 0/ 4): Global bits: 0, count bits: 0, local bits: 0
pnml2lts-mc( 3/ 4): ~138 levels ~10000 states ~26224 transitions
pnml2lts-mc( 3/ 4): ~138 levels ~20000 states ~60928 transitions
pnml2lts-mc( 3/ 4): ~138 levels ~40000 states ~145628 transitions
pnml2lts-mc( 0/ 4):
pnml2lts-mc( 0/ 4): total scc count: 30551
pnml2lts-mc( 0/ 4): unique states count: 30551
pnml2lts-mc( 0/ 4): unique transitions count: 113877
pnml2lts-mc( 0/ 4): - self-loop count: 0
pnml2lts-mc( 0/ 4): - claim dead count: 107791
pnml2lts-mc( 0/ 4): - claim found count: 0
pnml2lts-mc( 0/ 4): - claim success count: 41850
pnml2lts-mc( 0/ 4): - cum. max stack depth: 548
pnml2lts-mc( 0/ 4):
pnml2lts-mc( 0/ 4): Explored 41850 states 164710 transitions, fanout: 3.936
pnml2lts-mc( 0/ 4): Total exploration time 0.960 sec (0.950 sec minimum, 0.955 sec on average)
pnml2lts-mc( 0/ 4): States per second: 43594, Transitions per second: 171573
pnml2lts-mc( 0/ 4):
pnml2lts-mc( 0/ 4): Queue width: 12B, total height: 0, memory: 0.00MB
pnml2lts-mc( 0/ 4): Tree memory: 0.3MB, 10.8 B/state, compr.: 1.4%
pnml2lts-mc( 0/ 4): Tree fill ratio (roots/leafs): 0.0%/0.0%
pnml2lts-mc( 0/ 4): Stored 176 string chucks using 0MB
pnml2lts-mc( 0/ 4): Total memory used for chunk indexing: 0MB
pnml2lts-mc( 0/ 4): Est. total memory use: 0.3MB (~8192.0MB paged-in)
ltl formula name ParamProductionCell-PT-0-LTLCardinality-09
ltl formula formula --ltl=/tmp/ltl_9_
pnml2lts-mc( 0/ 4): Loading model from model.pnml
pnml2lts-mc( 0/ 4): Edge label is id
pnml2lts-mc( 0/ 4): Petri net has 198 places, 176 transitions and 730 arcs
pnml2lts-mc( 0/ 4): Petri net ParamProductionCell-PT-0 analyzed
pnml2lts-mc( 0/ 4): There are no safe places
pnml2lts-mc( 0/ 4): Loading Petri net took 0.040 real 0.020 user 0.030 sys
pnml2lts-mc( 2/ 4): LTL layer: formula: /tmp/ltl_9_
pnml2lts-mc( 0/ 4): Weak Buchi automaton detected, adding non-accepting as progress label.
pnml2lts-mc( 0/ 4): There are 200 state labels and 1 edge labels
pnml2lts-mc( 0/ 4): State length is 199, there are 180 groups
pnml2lts-mc( 0/ 4): Running ufscc using 4 cores
pnml2lts-mc( 0/ 4): Using a tree table with 2^30 elements
pnml2lts-mc( 0/ 4): Successor permutation: dynamic
pnml2lts-mc( 0/ 4): Global bits: 0, count bits: 0, local bits: 0
pnml2lts-mc( 2/ 4):
pnml2lts-mc( 2/ 4): Accepting cycle FOUND at depth ~388!
pnml2lts-mc( 2/ 4):
pnml2lts-mc( 0/ 4):
pnml2lts-mc( 0/ 4): total scc count: 0
pnml2lts-mc( 0/ 4): unique states count: 1478
pnml2lts-mc( 0/ 4): unique transitions count: 3412
pnml2lts-mc( 0/ 4): - self-loop count: 0
pnml2lts-mc( 0/ 4): - claim dead count: 0
pnml2lts-mc( 0/ 4): - claim found count: 342
pnml2lts-mc( 0/ 4): - claim success count: 1606
pnml2lts-mc( 0/ 4): - cum. max stack depth: 1503
pnml2lts-mc( 0/ 4):
pnml2lts-mc( 0/ 4): Explored 1606 states 3586 transitions, fanout: 2.233
pnml2lts-mc( 0/ 4): Total exploration time 0.120 sec (0.110 sec minimum, 0.115 sec on average)
pnml2lts-mc( 0/ 4): States per second: 13383, Transitions per second: 29883
pnml2lts-mc( 0/ 4):
pnml2lts-mc( 0/ 4): Queue width: 12B, total height: 0, memory: 0.00MB
pnml2lts-mc( 0/ 4): Tree memory: 0.1MB, 20.8 B/state, compr.: 2.6%
pnml2lts-mc( 0/ 4): Tree fill ratio (roots/leafs): 0.0%/0.0%
pnml2lts-mc( 0/ 4): Stored 176 string chucks using 0MB
pnml2lts-mc( 0/ 4): Total memory used for chunk indexing: 0MB
pnml2lts-mc( 0/ 4): Est. total memory use: 0.1MB (~8192.0MB paged-in)
ltl formula name ParamProductionCell-PT-0-LTLCardinality-10
ltl formula formula --ltl=/tmp/ltl_10_
pnml2lts-mc( 0/ 4): Loading model from model.pnml
pnml2lts-mc( 0/ 4): Edge label is id
pnml2lts-mc( 0/ 4): Petri net has 198 places, 176 transitions and 730 arcs
pnml2lts-mc( 0/ 4): Petri net ParamProductionCell-PT-0 analyzed
pnml2lts-mc( 0/ 4): There are no safe places
pnml2lts-mc( 3/ 4): LTL layer: formula: /tmp/ltl_10_
pnml2lts-mc( 0/ 4): Loading Petri net took 0.050 real 0.020 user 0.030 sys
pnml2lts-mc( 0/ 4): Weak Buchi automaton detected, adding non-accepting as progress label.
pnml2lts-mc( 0/ 4): There are 200 state labels and 1 edge labels
pnml2lts-mc( 0/ 4): State length is 199, there are 186 groups
pnml2lts-mc( 0/ 4): Running ufscc using 4 cores
pnml2lts-mc( 0/ 4): Using a tree table with 2^30 elements
pnml2lts-mc( 0/ 4): Successor permutation: dynamic
pnml2lts-mc( 0/ 4): Global bits: 0, count bits: 0, local bits: 0
pnml2lts-mc( 0/ 4):
pnml2lts-mc( 0/ 4): total scc count: 1
pnml2lts-mc( 0/ 4): unique states count: 1
pnml2lts-mc( 0/ 4): unique transitions count: 0
pnml2lts-mc( 0/ 4): - self-loop count: 0
pnml2lts-mc( 0/ 4): - claim dead count: 0
pnml2lts-mc( 0/ 4): - claim found count: 0
pnml2lts-mc( 0/ 4): - claim success count: 4
pnml2lts-mc( 0/ 4): - cum. max stack depth: 4
pnml2lts-mc( 0/ 4):
pnml2lts-mc( 0/ 4): Explored 4 states 4 transitions, fanout: 1.000
pnml2lts-mc( 0/ 4): Total exploration time 0.030 sec (0.010 sec minimum, 0.023 sec on average)
pnml2lts-mc( 0/ 4): States per second: 133, Transitions per second: 133
pnml2lts-mc( 0/ 4):
pnml2lts-mc( 0/ 4): Queue width: 12B, total height: 0, memory: 0.00MB
pnml2lts-mc( 0/ 4): Tree memory: 0.0MB, 368.0 B/state, compr.: 46.1%
pnml2lts-mc( 0/ 4): Tree fill ratio (roots/leafs): 0.0%/0.0%
pnml2lts-mc( 0/ 4): Stored 176 string chucks using 0MB
pnml2lts-mc( 0/ 4): Total memory used for chunk indexing: 0MB
pnml2lts-mc( 0/ 4): Est. total memory use: 0.0MB (~8192.0MB paged-in)
ltl formula name ParamProductionCell-PT-0-LTLCardinality-11
ltl formula formula --ltl=/tmp/ltl_11_
pnml2lts-mc( 0/ 4): Loading model from model.pnml
pnml2lts-mc( 0/ 4): Edge label is id
pnml2lts-mc( 0/ 4): Petri net has 198 places, 176 transitions and 730 arcs
pnml2lts-mc( 0/ 4): Petri net ParamProductionCell-PT-0 analyzed
pnml2lts-mc( 0/ 4): There are no safe places
pnml2lts-mc( 3/ 4): LTL layer: formula: /tmp/ltl_11_
pnml2lts-mc( 0/ 4): Loading Petri net took 0.030 real 0.010 user 0.030 sys
pnml2lts-mc( 0/ 4): Weak Buchi automaton detected, adding non-accepting as progress label.
pnml2lts-mc( 0/ 4): There are 200 state labels and 1 edge labels
pnml2lts-mc( 0/ 4): State length is 199, there are 178 groups
pnml2lts-mc( 0/ 4): Running ufscc using 4 cores
pnml2lts-mc( 0/ 4): Using a tree table with 2^30 elements
pnml2lts-mc( 0/ 4): Successor permutation: dynamic
pnml2lts-mc( 0/ 4): Global bits: 0, count bits: 0, local bits: 0
pnml2lts-mc( 1/ 4):
pnml2lts-mc( 1/ 4): Accepting cycle FOUND at depth ~139!
pnml2lts-mc( 1/ 4):
pnml2lts-mc( 0/ 4):
pnml2lts-mc( 0/ 4): total scc count: 0
pnml2lts-mc( 0/ 4): unique states count: 541
pnml2lts-mc( 0/ 4): unique transitions count: 1221
pnml2lts-mc( 0/ 4): - self-loop count: 0
pnml2lts-mc( 0/ 4): - claim dead count: 0
pnml2lts-mc( 0/ 4): - claim found count: 1
pnml2lts-mc( 0/ 4): - claim success count: 573
pnml2lts-mc( 0/ 4): - cum. max stack depth: 573
pnml2lts-mc( 0/ 4):
pnml2lts-mc( 0/ 4): Explored 573 states 1272 transitions, fanout: 2.220
pnml2lts-mc( 0/ 4): Total exploration time 0.090 sec (0.050 sec minimum, 0.070 sec on average)
pnml2lts-mc( 0/ 4): States per second: 6367, Transitions per second: 14133
pnml2lts-mc( 0/ 4):
pnml2lts-mc( 0/ 4): Queue width: 12B, total height: 0, memory: 0.00MB
pnml2lts-mc( 0/ 4): Tree memory: 0.0MB, 23.3 B/state, compr.: 2.9%
pnml2lts-mc( 0/ 4): Tree fill ratio (roots/leafs): 0.0%/0.0%
pnml2lts-mc( 0/ 4): Stored 176 string chucks using 0MB
pnml2lts-mc( 0/ 4): Total memory used for chunk indexing: 0MB
pnml2lts-mc( 0/ 4): Est. total memory use: 0.0MB (~8192.0MB paged-in)
ltl formula name ParamProductionCell-PT-0-LTLCardinality-12
ltl formula formula --ltl=/tmp/ltl_12_
pnml2lts-mc( 0/ 4): Loading model from model.pnml
pnml2lts-mc( 0/ 4): Edge label is id
pnml2lts-mc( 0/ 4): Petri net has 198 places, 176 transitions and 730 arcs
pnml2lts-mc( 0/ 4): Petri net ParamProductionCell-PT-0 analyzed
pnml2lts-mc( 0/ 4): There are no safe places
pnml2lts-mc( 0/ 4): Loading Petri net took 0.120 real 0.320 user 0.040 sys
pnml2lts-mc( 3/ 4): LTL layer: formula: /tmp/ltl_12_
pnml2lts-mc( 0/ 4): Weak Buchi automaton detected, adding non-accepting as progress label.
pnml2lts-mc( 0/ 4): There are 200 state labels and 1 edge labels
pnml2lts-mc( 0/ 4): State length is 199, there are 182 groups
pnml2lts-mc( 0/ 4): Running ufscc using 4 cores
pnml2lts-mc( 0/ 4): Using a tree table with 2^30 elements
pnml2lts-mc( 0/ 4): Successor permutation: dynamic
pnml2lts-mc( 0/ 4): Global bits: 0, count bits: 0, local bits: 0
pnml2lts-mc( 1/ 4):
pnml2lts-mc( 1/ 4): Accepting cycle FOUND at depth ~286!
pnml2lts-mc( 1/ 4):
pnml2lts-mc( 0/ 4):
pnml2lts-mc( 0/ 4): total scc count: 0
pnml2lts-mc( 0/ 4): unique states count: 731
pnml2lts-mc( 0/ 4): unique transitions count: 1420
pnml2lts-mc( 0/ 4): - self-loop count: 0
pnml2lts-mc( 0/ 4): - claim dead count: 0
pnml2lts-mc( 0/ 4): - claim found count: 1
pnml2lts-mc( 0/ 4): - claim success count: 803
pnml2lts-mc( 0/ 4): - cum. max stack depth: 803
pnml2lts-mc( 0/ 4):
pnml2lts-mc( 0/ 4): Explored 803 states 1507 transitions, fanout: 1.877
pnml2lts-mc( 0/ 4): Total exploration time 0.050 sec (0.030 sec minimum, 0.045 sec on average)
pnml2lts-mc( 0/ 4): States per second: 16060, Transitions per second: 30140
pnml2lts-mc( 0/ 4):
pnml2lts-mc( 0/ 4): Queue width: 12B, total height: 0, memory: 0.00MB
pnml2lts-mc( 0/ 4): Tree memory: 0.0MB, 22.9 B/state, compr.: 2.9%
pnml2lts-mc( 0/ 4): Tree fill ratio (roots/leafs): 0.0%/0.0%
pnml2lts-mc( 0/ 4): Stored 176 string chucks using 0MB
pnml2lts-mc( 0/ 4): Total memory used for chunk indexing: 0MB
pnml2lts-mc( 0/ 4): Est. total memory use: 0.0MB (~8192.0MB paged-in)
ltl formula name ParamProductionCell-PT-0-LTLCardinality-13
ltl formula formula --ltl=/tmp/ltl_13_
pnml2lts-mc( 0/ 4): Loading model from model.pnml
pnml2lts-mc( 0/ 4): Edge label is id
pnml2lts-mc( 0/ 4): Petri net has 198 places, 176 transitions and 730 arcs
pnml2lts-mc( 0/ 4): Petri net ParamProductionCell-PT-0 analyzed
pnml2lts-mc( 0/ 4): There are no safe places
pnml2lts-mc( 0/ 4): Loading Petri net took 0.060 real 0.060 user 0.030 sys
pnml2lts-mc( 0/ 4): LTL layer: formula: /tmp/ltl_13_
pnml2lts-mc( 0/ 4): buchi has 2 states
pnml2lts-mc( 0/ 4): Weak Buchi automaton detected, adding non-accepting as progress label.
pnml2lts-mc( 0/ 4): There are 200 state labels and 1 edge labels
pnml2lts-mc( 0/ 4): State length is 199, there are 178 groups
pnml2lts-mc( 0/ 4): Running ufscc using 4 cores
pnml2lts-mc( 0/ 4): Using a tree table with 2^30 elements
pnml2lts-mc( 0/ 4): Successor permutation: dynamic
pnml2lts-mc( 0/ 4): Global bits: 0, count bits: 0, local bits: 0
pnml2lts-mc( 0/ 4):
pnml2lts-mc( 0/ 4): total scc count: 1
pnml2lts-mc( 0/ 4): unique states count: 1
pnml2lts-mc( 0/ 4): unique transitions count: 0
pnml2lts-mc( 0/ 4): - self-loop count: 0
pnml2lts-mc( 0/ 4): - claim dead count: 0
pnml2lts-mc( 0/ 4): - claim found count: 0
pnml2lts-mc( 0/ 4): - claim success count: 4
pnml2lts-mc( 0/ 4): - cum. max stack depth: 4
pnml2lts-mc( 0/ 4):
pnml2lts-mc( 0/ 4): Explored 4 states 4 transitions, fanout: 1.000
pnml2lts-mc( 0/ 4): Total exploration time 0.030 sec (0.020 sec minimum, 0.025 sec on average)
pnml2lts-mc( 0/ 4): States per second: 133, Transitions per second: 133
pnml2lts-mc( 0/ 4):
pnml2lts-mc( 0/ 4): Queue width: 12B, total height: 0, memory: 0.00MB
pnml2lts-mc( 0/ 4): Tree memory: 0.0MB, 368.0 B/state, compr.: 46.1%
pnml2lts-mc( 0/ 4): Tree fill ratio (roots/leafs): 0.0%/0.0%
pnml2lts-mc( 0/ 4): Stored 176 string chucks using 0MB
pnml2lts-mc( 0/ 4): Total memory used for chunk indexing: 0MB
pnml2lts-mc( 0/ 4): Est. total memory use: 0.0MB (~8192.0MB paged-in)
ltl formula name ParamProductionCell-PT-0-LTLCardinality-14
ltl formula formula --ltl=/tmp/ltl_14_
pnml2lts-mc( 0/ 4): Loading model from model.pnml
pnml2lts-mc( 0/ 4): Edge label is id
pnml2lts-mc( 0/ 4): Petri net has 198 places, 176 transitions and 730 arcs
pnml2lts-mc( 0/ 4): Petri net ParamProductionCell-PT-0 analyzed
pnml2lts-mc( 0/ 4): There are no safe places
pnml2lts-mc( 0/ 4): Loading Petri net took 0.030 real 0.020 user 0.020 sys
pnml2lts-mc( 2/ 4): LTL layer: formula: /tmp/ltl_14_
pnml2lts-mc( 0/ 4): There are 199 state labels and 1 edge labels
pnml2lts-mc( 0/ 4): State length is 199, there are 180 groups
pnml2lts-mc( 0/ 4): Running ufscc using 4 cores
pnml2lts-mc( 0/ 4): Using a tree table with 2^30 elements
pnml2lts-mc( 0/ 4): Successor permutation: dynamic
pnml2lts-mc( 0/ 4): Global bits: 0, count bits: 0, local bits: 0
pnml2lts-mc( 2/ 4):
pnml2lts-mc( 2/ 4): Accepting cycle FOUND at depth ~165!
pnml2lts-mc( 2/ 4):
pnml2lts-mc( 0/ 4):
pnml2lts-mc( 0/ 4): total scc count: 0
pnml2lts-mc( 0/ 4): unique states count: 578
pnml2lts-mc( 0/ 4): unique transitions count: 1208
pnml2lts-mc( 0/ 4): - self-loop count: 0
pnml2lts-mc( 0/ 4): - claim dead count: 0
pnml2lts-mc( 0/ 4): - claim found count: 1
pnml2lts-mc( 0/ 4): - claim success count: 670
pnml2lts-mc( 0/ 4): - cum. max stack depth: 670
pnml2lts-mc( 0/ 4):
pnml2lts-mc( 0/ 4): Explored 670 states 1329 transitions, fanout: 1.984
pnml2lts-mc( 0/ 4): Total exploration time 0.060 sec (0.050 sec minimum, 0.055 sec on average)
pnml2lts-mc( 0/ 4): States per second: 11167, Transitions per second: 22150
pnml2lts-mc( 0/ 4):
pnml2lts-mc( 0/ 4): Queue width: 12B, total height: 0, memory: 0.00MB
pnml2lts-mc( 0/ 4): Tree memory: 0.0MB, 22.6 B/state, compr.: 2.8%
pnml2lts-mc( 0/ 4): Tree fill ratio (roots/leafs): 0.0%/0.0%
pnml2lts-mc( 0/ 4): Stored 176 string chucks using 0MB
pnml2lts-mc( 0/ 4): Total memory used for chunk indexing: 0MB
pnml2lts-mc( 0/ 4): Est. total memory use: 0.0MB (~8192.0MB paged-in)
ltl formula name ParamProductionCell-PT-0-LTLCardinality-15
ltl formula formula --ltl=/tmp/ltl_15_
pnml2lts-mc( 0/ 4): Loading model from model.pnml
pnml2lts-mc( 0/ 4): Edge label is id
pnml2lts-mc( 0/ 4): Petri net has 198 places, 176 transitions and 730 arcs
pnml2lts-mc( 0/ 4): Petri net ParamProductionCell-PT-0 analyzed
pnml2lts-mc( 0/ 4): There are no safe places
pnml2lts-mc( 2/ 4): LTL layer: formula: /tmp/ltl_15_
pnml2lts-mc( 0/ 4): Loading Petri net took 0.200 real 0.550 user 0.060 sys
pnml2lts-mc( 0/ 4): There are 199 state labels and 1 edge labels
pnml2lts-mc( 0/ 4): State length is 199, there are 187 groups
pnml2lts-mc( 0/ 4): Running ufscc using 4 cores
pnml2lts-mc( 0/ 4): Using a tree table with 2^30 elements
pnml2lts-mc( 0/ 4): Successor permutation: dynamic
pnml2lts-mc( 0/ 4): Global bits: 0, count bits: 0, local bits: 0
pnml2lts-mc( 1/ 4):
pnml2lts-mc( 1/ 4): Accepting cycle FOUND at depth ~311!
pnml2lts-mc( 1/ 4):
pnml2lts-mc( 0/ 4):
pnml2lts-mc( 0/ 4): total scc count: 0
pnml2lts-mc( 0/ 4): unique states count: 1093
pnml2lts-mc( 0/ 4): unique transitions count: 2417
pnml2lts-mc( 0/ 4): - self-loop count: 0
pnml2lts-mc( 0/ 4): - claim dead count: 0
pnml2lts-mc( 0/ 4): - claim found count: 81
pnml2lts-mc( 0/ 4): - claim success count: 1179
pnml2lts-mc( 0/ 4): - cum. max stack depth: 1168
pnml2lts-mc( 0/ 4):
pnml2lts-mc( 0/ 4): Explored 1179 states 2559 transitions, fanout: 2.170
pnml2lts-mc( 0/ 4): Total exploration time 0.100 sec (0.080 sec minimum, 0.090 sec on average)
pnml2lts-mc( 0/ 4): States per second: 11790, Transitions per second: 25590
pnml2lts-mc( 0/ 4):
pnml2lts-mc( 0/ 4): Queue width: 12B, total height: 0, memory: 0.00MB
pnml2lts-mc( 0/ 4): Tree memory: 0.0MB, 20.9 B/state, compr.: 2.6%
pnml2lts-mc( 0/ 4): Tree fill ratio (roots/leafs): 0.0%/0.0%
pnml2lts-mc( 0/ 4): Stored 176 string chucks using 0MB
pnml2lts-mc( 0/ 4): Total memory used for chunk indexing: 0MB
pnml2lts-mc( 0/ 4): Est. total memory use: 0.0MB (~8192.0MB paged-in)
Sequence of Actions to be Executed by the VM
This is useful if one wants to reexecute the tool in the VM from the submitted image disk.
set -x
# this is for BenchKit: configuration of major elements for the test
export BK_INPUT="ParamProductionCell-PT-0"
export BK_EXAMINATION="LTLCardinality"
export BK_TOOL="ltsmin"
export BK_RESULT_DIR="/tmp/BK_RESULTS/OUTPUTS"
export BK_TIME_CONFINEMENT="3600"
export BK_MEMORY_CONFINEMENT="16384"
# this is specific to your benchmark or test
export BIN_DIR="$HOME/BenchKit/bin"
# remove the execution directoty if it exists (to avoid increse of .vmdk images)
if [ -d execution ] ; then
rm -rf execution
fi
tar xzf /home/mcc/BenchKit/INPUTS/ParamProductionCell-PT-0.tgz
mv ParamProductionCell-PT-0 execution
cd execution
pwd
ls -lh
# this is for BenchKit: explicit launching of the test
echo "====================================================================="
echo " Generated by BenchKit 2-3637"
echo " Executing tool ltsmin"
echo " Input is ParamProductionCell-PT-0, examination is LTLCardinality"
echo " Time confinement is $BK_TIME_CONFINEMENT seconds"
echo " Memory confinement is 16384 MBytes"
echo " Number of cores is 4"
echo " Run identifier is r257-csrt-152732583400099"
echo "====================================================================="
echo
echo "--------------------"
echo "content from stdout:"
echo
echo "=== Data for post analysis generated by BenchKit (invocation template)"
echo
if [ "LTLCardinality" = "UpperBounds" ] ; then
echo "The expected result is a vector of positive values"
echo NUM_VECTOR
elif [ "LTLCardinality" != "StateSpace" ] ; then
echo "The expected result is a vector of booleans"
echo BOOL_VECTOR
else
echo "no data necessary for post analysis"
fi
echo
if [ -f "LTLCardinality.txt" ] ; then
echo "here is the order used to build the result vector(from text file)"
for x in $(grep Property LTLCardinality.txt | cut -d ' ' -f 2 | sort -u) ; do
echo "FORMULA_NAME $x"
done
elif [ -f "LTLCardinality.xml" ] ; then # for cunf (txt files deleted;-)
echo echo "here is the order used to build the result vector(from xml file)"
for x in $(grep '
echo "FORMULA_NAME $x"
done
fi
echo
echo "=== Now, execution of the tool begins"
echo
echo -n "BK_START "
date -u +%s%3N
echo
timeout -s 9 $BK_TIME_CONFINEMENT bash -c "/home/mcc/BenchKit/BenchKit_head.sh 2> STDERR ; echo ; echo -n \"BK_STOP \" ; date -u +%s%3N"
if [ $? -eq 137 ] ; then
echo
echo "BK_TIME_CONFINEMENT_REACHED"
fi
echo
echo "--------------------"
echo "content from stderr:"
echo
cat STDERR ;