

About the Execution of LTSMin for GlobalResAllocation-PT-05
| Execution Summary | |||||
| Max Memory Used (MB) |
Time wait (ms) | CPU Usage (ms) | I/O Wait (ms) | Computed Result | Execution Status |
| 7261.070 | 516158.00 | 1143749.00 | 45.80 | FT?TFFTTTFTFFFTT | normal |
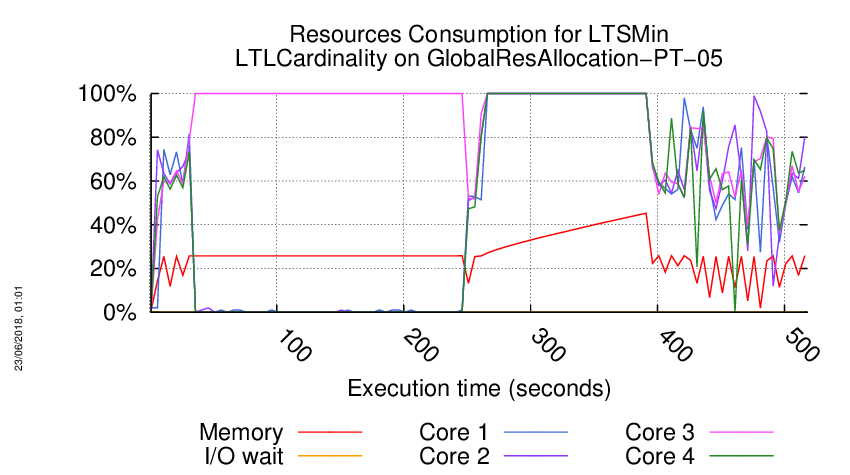
Execution Chart
We display below the execution chart for this examination (boot time has been removed).
Trace from the execution
Waiting for the VM to be ready (probing ssh)
...............
/home/mcc/execution
total 111M
-rw-r--r-- 1 mcc users 11K May 15 18:54 CTLCardinality.txt
-rw-r--r-- 1 mcc users 36K May 15 18:54 CTLCardinality.xml
-rw-r--r-- 1 mcc users 5.1M May 15 18:54 CTLFireability.txt
-rw-r--r-- 1 mcc users 16M May 15 18:54 CTLFireability.xml
-rw-r--r-- 1 mcc users 4.0K May 15 18:50 GenericPropertiesDefinition.xml
-rw-r--r-- 1 mcc users 6.0K May 15 18:50 GenericPropertiesVerdict.xml
-rw-r--r-- 1 mcc users 6.9K May 26 09:26 LTLCardinality.txt
-rw-r--r-- 1 mcc users 21K May 26 09:26 LTLCardinality.xml
-rw-r--r-- 1 mcc users 121K May 26 09:26 LTLFireability.txt
-rw-r--r-- 1 mcc users 403K May 26 09:26 LTLFireability.xml
-rw-r--r-- 1 mcc users 22K May 15 18:54 ReachabilityCardinality.txt
-rw-r--r-- 1 mcc users 67K May 15 18:54 ReachabilityCardinality.xml
-rw-r--r-- 1 mcc users 116 May 15 18:54 ReachabilityDeadlock.txt
-rw-r--r-- 1 mcc users 354 May 15 18:54 ReachabilityDeadlock.xml
-rw-r--r-- 1 mcc users 5.3M May 15 18:54 ReachabilityFireability.txt
-rw-r--r-- 1 mcc users 16M May 15 18:54 ReachabilityFireability.xml
-rw-r--r-- 1 mcc users 3.4K May 15 18:54 UpperBounds.txt
-rw-r--r-- 1 mcc users 7.2K May 15 18:54 UpperBounds.xml
-rw-r--r-- 1 mcc users 5 May 15 18:50 equiv_col
-rw-r--r-- 1 mcc users 3 May 15 18:50 instance
-rw-r--r-- 1 mcc users 6 May 15 18:50 iscolored
-rw-r--r-- 1 mcc users 70M May 15 18:50 model.pnml
=====================================================================
Generated by BenchKit 2-3637
Executing tool ltsmin
Input is GlobalResAllocation-PT-05, examination is LTLCardinality
Time confinement is 3600 seconds
Memory confinement is 16384 MBytes
Number of cores is 4
Run identifier is r245-blw7-152732547700119
=====================================================================
--------------------
content from stdout:
=== Data for post analysis generated by BenchKit (invocation template)
The expected result is a vector of booleans
BOOL_VECTOR
here is the order used to build the result vector(from text file)
FORMULA_NAME GlobalResAllocation-PT-05-LTLCardinality-00
FORMULA_NAME GlobalResAllocation-PT-05-LTLCardinality-01
FORMULA_NAME GlobalResAllocation-PT-05-LTLCardinality-02
FORMULA_NAME GlobalResAllocation-PT-05-LTLCardinality-03
FORMULA_NAME GlobalResAllocation-PT-05-LTLCardinality-04
FORMULA_NAME GlobalResAllocation-PT-05-LTLCardinality-05
FORMULA_NAME GlobalResAllocation-PT-05-LTLCardinality-06
FORMULA_NAME GlobalResAllocation-PT-05-LTLCardinality-07
FORMULA_NAME GlobalResAllocation-PT-05-LTLCardinality-08
FORMULA_NAME GlobalResAllocation-PT-05-LTLCardinality-09
FORMULA_NAME GlobalResAllocation-PT-05-LTLCardinality-10
FORMULA_NAME GlobalResAllocation-PT-05-LTLCardinality-11
FORMULA_NAME GlobalResAllocation-PT-05-LTLCardinality-12
FORMULA_NAME GlobalResAllocation-PT-05-LTLCardinality-13
FORMULA_NAME GlobalResAllocation-PT-05-LTLCardinality-14
FORMULA_NAME GlobalResAllocation-PT-05-LTLCardinality-15
=== Now, execution of the tool begins
BK_START 1527921924519
FORMULA GlobalResAllocation-PT-05-LTLCardinality-00 FALSE TECHNIQUES EXPLICIT PARALLEL_PROCESSING USE_NUPN
FORMULA GlobalResAllocation-PT-05-LTLCardinality-01 TRUE TECHNIQUES EXPLICIT PARALLEL_PROCESSING USE_NUPN
FORMULA GlobalResAllocation-PT-05-LTLCardinality-02 CANNOT_COMPUTE
FORMULA GlobalResAllocation-PT-05-LTLCardinality-03 TRUE TECHNIQUES EXPLICIT PARALLEL_PROCESSING USE_NUPN
FORMULA GlobalResAllocation-PT-05-LTLCardinality-04 FALSE TECHNIQUES EXPLICIT PARALLEL_PROCESSING USE_NUPN
FORMULA GlobalResAllocation-PT-05-LTLCardinality-05 FALSE TECHNIQUES EXPLICIT PARALLEL_PROCESSING USE_NUPN
FORMULA GlobalResAllocation-PT-05-LTLCardinality-06 TRUE TECHNIQUES EXPLICIT PARALLEL_PROCESSING USE_NUPN
FORMULA GlobalResAllocation-PT-05-LTLCardinality-07 TRUE TECHNIQUES EXPLICIT PARALLEL_PROCESSING USE_NUPN
FORMULA GlobalResAllocation-PT-05-LTLCardinality-08 TRUE TECHNIQUES EXPLICIT PARALLEL_PROCESSING USE_NUPN
FORMULA GlobalResAllocation-PT-05-LTLCardinality-09 FALSE TECHNIQUES EXPLICIT PARALLEL_PROCESSING USE_NUPN
FORMULA GlobalResAllocation-PT-05-LTLCardinality-10 TRUE TECHNIQUES EXPLICIT PARALLEL_PROCESSING USE_NUPN
FORMULA GlobalResAllocation-PT-05-LTLCardinality-11 FALSE TECHNIQUES EXPLICIT PARALLEL_PROCESSING USE_NUPN
FORMULA GlobalResAllocation-PT-05-LTLCardinality-12 FALSE TECHNIQUES EXPLICIT PARALLEL_PROCESSING USE_NUPN
FORMULA GlobalResAllocation-PT-05-LTLCardinality-13 FALSE TECHNIQUES EXPLICIT PARALLEL_PROCESSING USE_NUPN
FORMULA GlobalResAllocation-PT-05-LTLCardinality-14 TRUE TECHNIQUES EXPLICIT PARALLEL_PROCESSING USE_NUPN
FORMULA GlobalResAllocation-PT-05-LTLCardinality-15 TRUE TECHNIQUES EXPLICIT PARALLEL_PROCESSING USE_NUPN
BK_STOP 1527922440677
--------------------
content from stderr:
mcc2018
ltl formula name GlobalResAllocation-PT-05-LTLCardinality-00
ltl formula formula --ltl=/tmp/ltl_0_
pnml2lts-mc( 0/ 4): Loading model from model.pnml
pnml2lts-mc( 0/ 4): Edge label is id
pnml2lts-mc( 0/ 4): Petri net has 75 places, 56105 transitions and 492760 arcs
pnml2lts-mc( 0/ 4): Petri net GlobalResAllocation-PT-05 analyzed
pnml2lts-mc( 0/ 4): There are no safe places
pnml2lts-mc( 0/ 4): Loading Petri net took 3.930 real 7.130 user 3.020 sys
pnml2lts-mc( 2/ 4): LTL layer: formula: /tmp/ltl_0_
pnml2lts-mc( 0/ 4): There are 161 state labels and 1 edge labels
pnml2lts-mc( 0/ 4): State length is 76, there are 56109 groups
pnml2lts-mc( 0/ 4): Running ufscc using 4 cores
pnml2lts-mc( 0/ 4): Using a tree table with 2^30 elements
pnml2lts-mc( 0/ 4): Successor permutation: dynamic
pnml2lts-mc( 0/ 4): Global bits: 0, count bits: 0, local bits: 0
pnml2lts-mc( 1/ 4):
pnml2lts-mc( 1/ 4): Accepting cycle FOUND at depth ~8!
pnml2lts-mc( 1/ 4):
pnml2lts-mc( 0/ 4):
pnml2lts-mc( 0/ 4): total scc count: 0
pnml2lts-mc( 0/ 4): unique states count: 33
pnml2lts-mc( 0/ 4): unique transitions count: 38954
pnml2lts-mc( 0/ 4): - self-loop count: 0
pnml2lts-mc( 0/ 4): - claim dead count: 0
pnml2lts-mc( 0/ 4): - claim found count: 2
pnml2lts-mc( 0/ 4): - claim success count: 36
pnml2lts-mc( 0/ 4): - cum. max stack depth: 36
pnml2lts-mc( 0/ 4):
pnml2lts-mc( 0/ 4): Explored 36 states 126858 transitions, fanout: 3523.833
pnml2lts-mc( 0/ 4): Total exploration time 0.140 sec (0.140 sec minimum, 0.140 sec on average)
pnml2lts-mc( 0/ 4): States per second: 257, Transitions per second: 906129
pnml2lts-mc( 0/ 4):
pnml2lts-mc( 0/ 4): Queue width: 12B, total height: 0, memory: 0.00MB
pnml2lts-mc( 0/ 4): Tree memory: 0.1MB, 28.9 B/state, compr.: 9.4%
pnml2lts-mc( 0/ 4): Tree fill ratio (roots/leafs): 0.0%/0.0%
pnml2lts-mc( 0/ 4): Stored 57088 string chucks using 1MB
pnml2lts-mc( 0/ 4): Total memory used for chunk indexing: 3MB
pnml2lts-mc( 0/ 4): Est. total memory use: 3.1MB (~8195.0MB paged-in)
ltl formula name GlobalResAllocation-PT-05-LTLCardinality-01
ltl formula formula --ltl=/tmp/ltl_1_
pnml2lts-mc( 0/ 4): Loading model from model.pnml
pnml2lts-mc( 0/ 4): Edge label is id
pnml2lts-mc( 0/ 4): Petri net has 75 places, 56105 transitions and 492760 arcs
pnml2lts-mc( 0/ 4): Petri net GlobalResAllocation-PT-05 analyzed
pnml2lts-mc( 0/ 4): There are no safe places
pnml2lts-mc( 0/ 4): Loading Petri net took 3.770 real 7.150 user 2.990 sys
pnml2lts-mc( 3/ 4): LTL layer: formula: /tmp/ltl_1_
pnml2lts-mc( 0/ 4): Weak Buchi automaton detected, adding non-accepting as progress label.
pnml2lts-mc( 0/ 4): There are 162 state labels and 1 edge labels
pnml2lts-mc( 0/ 4): State length is 76, there are 56106 groups
pnml2lts-mc( 0/ 4): Running ufscc using 4 cores
pnml2lts-mc( 0/ 4): Using a tree table with 2^30 elements
pnml2lts-mc( 0/ 4): Successor permutation: dynamic
pnml2lts-mc( 0/ 4): Global bits: 0, count bits: 0, local bits: 0
pnml2lts-mc( 0/ 4):
pnml2lts-mc( 0/ 4): total scc count: 1
pnml2lts-mc( 0/ 4): unique states count: 1
pnml2lts-mc( 0/ 4): unique transitions count: 0
pnml2lts-mc( 0/ 4): - self-loop count: 0
pnml2lts-mc( 0/ 4): - claim dead count: 0
pnml2lts-mc( 0/ 4): - claim found count: 0
pnml2lts-mc( 0/ 4): - claim success count: 4
pnml2lts-mc( 0/ 4): - cum. max stack depth: 4
pnml2lts-mc( 0/ 4):
pnml2lts-mc( 0/ 4): Explored 4 states 4 transitions, fanout: 1.000
pnml2lts-mc( 0/ 4): Total exploration time 0.010 sec (0.010 sec minimum, 0.010 sec on average)
pnml2lts-mc( 0/ 4): States per second: 400, Transitions per second: 400
pnml2lts-mc( 0/ 4):
pnml2lts-mc( 0/ 4): Queue width: 12B, total height: 0, memory: 0.00MB
pnml2lts-mc( 0/ 4): Tree memory: 0.0MB, 96.0 B/state, compr.: 31.4%
pnml2lts-mc( 0/ 4): Tree fill ratio (roots/leafs): 0.0%/0.0%
pnml2lts-mc( 0/ 4): Stored 57088 string chucks using 1MB
pnml2lts-mc( 0/ 4): Total memory used for chunk indexing: 3MB
pnml2lts-mc( 0/ 4): Est. total memory use: 3.0MB (~8195.0MB paged-in)
ltl formula name GlobalResAllocation-PT-05-LTLCardinality-02
ltl formula formula --ltl=/tmp/ltl_2_
pnml2lts-mc( 0/ 4): Loading model from model.pnml
pnml2lts-mc( 0/ 4): Edge label is id
pnml2lts-mc( 0/ 4): Petri net has 75 places, 56105 transitions and 492760 arcs
pnml2lts-mc( 0/ 4): Petri net GlobalResAllocation-PT-05 analyzed
pnml2lts-mc( 0/ 4): There are no safe places
pnml2lts-mc( 0/ 4): Loading Petri net took 3.790 real 6.650 user 2.900 sys
pnml2lts-mc( 1/ 4): LTL layer: formula: /tmp/ltl_2_
ltl formula name GlobalResAllocation-PT-05-LTLCardinality-03
ltl formula formula --ltl=/tmp/ltl_3_
pnml2lts-mc( 0/ 4): Loading model from model.pnml
pnml2lts-mc( 0/ 4): Edge label is id
pnml2lts-mc( 0/ 4): Petri net has 75 places, 56105 transitions and 492760 arcs
pnml2lts-mc( 0/ 4): Petri net GlobalResAllocation-PT-05 analyzed
pnml2lts-mc( 0/ 4): There are no safe places
pnml2lts-mc( 0/ 4): Loading Petri net took 6.960 real 8.760 user 5.390 sys
pnml2lts-mc( 1/ 4): LTL layer: formula: /tmp/ltl_3_
pnml2lts-mc( 0/ 4): There are 161 state labels and 1 edge labels
pnml2lts-mc( 0/ 4): State length is 76, there are 56117 groups
pnml2lts-mc( 0/ 4): Running ufscc using 4 cores
pnml2lts-mc( 0/ 4): Using a tree table with 2^30 elements
pnml2lts-mc( 0/ 4): Successor permutation: dynamic
pnml2lts-mc( 0/ 4): Global bits: 0, count bits: 0, local bits: 0
pnml2lts-mc( 2/ 4): ~3 levels ~10000 states ~217060 transitions
pnml2lts-mc( 2/ 4): ~3 levels ~20000 states ~318860 transitions
pnml2lts-mc( 2/ 4): ~3 levels ~40000 states ~520500 transitions
pnml2lts-mc( 2/ 4): ~3 levels ~80000 states ~936020 transitions
pnml2lts-mc( 2/ 4): ~3 levels ~160000 states ~1892904 transitions
pnml2lts-mc( 2/ 4): ~3 levels ~320000 states ~4453176 transitions
pnml2lts-mc( 0/ 4):
pnml2lts-mc( 0/ 4): total scc count: 336406
pnml2lts-mc( 0/ 4): unique states count: 336406
pnml2lts-mc( 0/ 4): unique transitions count: 7451050
pnml2lts-mc( 0/ 4): - self-loop count: 0
pnml2lts-mc( 0/ 4): - claim dead count: 7214891
pnml2lts-mc( 0/ 4): - claim found count: 0
pnml2lts-mc( 0/ 4): - claim success count: 336539
pnml2lts-mc( 0/ 4): - cum. max stack depth: 12
pnml2lts-mc( 0/ 4):
pnml2lts-mc( 0/ 4): Explored 336539 states 7766564 transitions, fanout: 23.078
pnml2lts-mc( 0/ 4): Total exploration time 129.480 sec (129.460 sec minimum, 129.470 sec on average)
pnml2lts-mc( 0/ 4): States per second: 2599, Transitions per second: 59983
pnml2lts-mc( 0/ 4):
pnml2lts-mc( 0/ 4): Queue width: 12B, total height: 0, memory: 0.00MB
pnml2lts-mc( 0/ 4): Tree memory: 3.8MB, 11.9 B/state, compr.: 3.9%
pnml2lts-mc( 0/ 4): Tree fill ratio (roots/leafs): 0.0%/0.0%
pnml2lts-mc( 0/ 4): Stored 57088 string chucks using 1MB
pnml2lts-mc( 0/ 4): Total memory used for chunk indexing: 3MB
pnml2lts-mc( 0/ 4): Est. total memory use: 6.8MB (~8195.0MB paged-in)
ltl formula name GlobalResAllocation-PT-05-LTLCardinality-04
ltl formula formula --ltl=/tmp/ltl_4_
pnml2lts-mc( 0/ 4): Loading model from model.pnml
pnml2lts-mc( 0/ 4): Edge label is id
pnml2lts-mc( 0/ 4): Petri net has 75 places, 56105 transitions and 492760 arcs
pnml2lts-mc( 0/ 4): Petri net GlobalResAllocation-PT-05 analyzed
pnml2lts-mc( 0/ 4): There are no safe places
pnml2lts-mc( 0/ 4): Loading Petri net took 4.000 real 7.410 user 3.200 sys
pnml2lts-mc( 1/ 4): LTL layer: formula: /tmp/ltl_4_
pnml2lts-mc( 0/ 4): Weak Buchi automaton detected, adding non-accepting as progress label.
pnml2lts-mc( 0/ 4): There are 162 state labels and 1 edge labels
pnml2lts-mc( 0/ 4): State length is 76, there are 56107 groups
pnml2lts-mc( 0/ 4): Running ufscc using 4 cores
pnml2lts-mc( 0/ 4): Using a tree table with 2^30 elements
pnml2lts-mc( 0/ 4): Successor permutation: dynamic
pnml2lts-mc( 0/ 4): Global bits: 0, count bits: 0, local bits: 0
pnml2lts-mc( 2/ 4):
pnml2lts-mc( 2/ 4): Accepting cycle FOUND at depth ~5!
pnml2lts-mc( 2/ 4):
pnml2lts-mc( 0/ 4):
pnml2lts-mc( 0/ 4): total scc count: 2990
pnml2lts-mc( 0/ 4): unique states count: 3005
pnml2lts-mc( 0/ 4): unique transitions count: 168424
pnml2lts-mc( 0/ 4): - self-loop count: 0
pnml2lts-mc( 0/ 4): - claim dead count: 9313
pnml2lts-mc( 0/ 4): - claim found count: 1
pnml2lts-mc( 0/ 4): - claim success count: 3009
pnml2lts-mc( 0/ 4): - cum. max stack depth: 18
pnml2lts-mc( 0/ 4):
pnml2lts-mc( 0/ 4): Explored 3009 states 256328 transitions, fanout: 85.187
pnml2lts-mc( 0/ 4): Total exploration time 1.520 sec (1.510 sec minimum, 1.513 sec on average)
pnml2lts-mc( 0/ 4): States per second: 1980, Transitions per second: 168637
pnml2lts-mc( 0/ 4):
pnml2lts-mc( 0/ 4): Queue width: 12B, total height: 0, memory: 0.00MB
pnml2lts-mc( 0/ 4): Tree memory: 0.2MB, 21.4 B/state, compr.: 7.0%
pnml2lts-mc( 0/ 4): Tree fill ratio (roots/leafs): 0.0%/0.0%
pnml2lts-mc( 0/ 4): Stored 57088 string chucks using 1MB
pnml2lts-mc( 0/ 4): Total memory used for chunk indexing: 3MB
pnml2lts-mc( 0/ 4): Est. total memory use: 3.2MB (~8195.0MB paged-in)
ltl formula name GlobalResAllocation-PT-05-LTLCardinality-05
ltl formula formula --ltl=/tmp/ltl_5_
pnml2lts-mc( 0/ 4): Loading model from model.pnml
pnml2lts-mc( 0/ 4): Edge label is id
pnml2lts-mc( 0/ 4): Petri net has 75 places, 56105 transitions and 492760 arcs
pnml2lts-mc( 0/ 4): Petri net GlobalResAllocation-PT-05 analyzed
pnml2lts-mc( 0/ 4): There are no safe places
pnml2lts-mc( 0/ 4): Loading Petri net took 3.760 real 6.740 user 2.950 sys
pnml2lts-mc( 1/ 4): LTL layer: formula: /tmp/ltl_5_
pnml2lts-mc( 0/ 4): Weak Buchi automaton detected, adding non-accepting as progress label.
pnml2lts-mc( 0/ 4): There are 162 state labels and 1 edge labels
pnml2lts-mc( 0/ 4): State length is 76, there are 56108 groups
pnml2lts-mc( 0/ 4): Running ufscc using 4 cores
pnml2lts-mc( 0/ 4): Using a tree table with 2^30 elements
pnml2lts-mc( 0/ 4): Successor permutation: dynamic
pnml2lts-mc( 0/ 4): Global bits: 0, count bits: 0, local bits: 0
pnml2lts-mc( 2/ 4):
pnml2lts-mc( 2/ 4): Accepting cycle FOUND at depth ~26!
pnml2lts-mc( 2/ 4):
pnml2lts-mc( 0/ 4):
pnml2lts-mc( 0/ 4): total scc count: 101
pnml2lts-mc( 0/ 4): unique states count: 272
pnml2lts-mc( 0/ 4): unique transitions count: 111152
pnml2lts-mc( 0/ 4): - self-loop count: 0
pnml2lts-mc( 0/ 4): - claim dead count: 161
pnml2lts-mc( 0/ 4): - claim found count: 108
pnml2lts-mc( 0/ 4): - claim success count: 275
pnml2lts-mc( 0/ 4): - cum. max stack depth: 174
pnml2lts-mc( 0/ 4):
pnml2lts-mc( 0/ 4): Explored 275 states 286956 transitions, fanout: 1043.476
pnml2lts-mc( 0/ 4): Total exploration time 0.320 sec (0.320 sec minimum, 0.320 sec on average)
pnml2lts-mc( 0/ 4): States per second: 859, Transitions per second: 896738
pnml2lts-mc( 0/ 4):
pnml2lts-mc( 0/ 4): Queue width: 12B, total height: 0, memory: 0.00MB
pnml2lts-mc( 0/ 4): Tree memory: 0.2MB, 24.0 B/state, compr.: 7.8%
pnml2lts-mc( 0/ 4): Tree fill ratio (roots/leafs): 0.0%/0.0%
pnml2lts-mc( 0/ 4): Stored 57088 string chucks using 1MB
pnml2lts-mc( 0/ 4): Total memory used for chunk indexing: 3MB
pnml2lts-mc( 0/ 4): Est. total memory use: 3.2MB (~8195.0MB paged-in)
ltl formula name GlobalResAllocation-PT-05-LTLCardinality-06
ltl formula formula --ltl=/tmp/ltl_6_
pnml2lts-mc( 0/ 4): Loading model from model.pnml
pnml2lts-mc( 0/ 4): Edge label is id
pnml2lts-mc( 0/ 4): Petri net has 75 places, 56105 transitions and 492760 arcs
pnml2lts-mc( 0/ 4): Petri net GlobalResAllocation-PT-05 analyzed
pnml2lts-mc( 0/ 4): There are no safe places
pnml2lts-mc( 0/ 4): Loading Petri net took 3.950 real 7.070 user 2.970 sys
pnml2lts-mc( 2/ 4): LTL layer: formula: /tmp/ltl_6_
pnml2lts-mc( 0/ 4): Weak Buchi automaton detected, adding non-accepting as progress label.
pnml2lts-mc( 0/ 4): There are 162 state labels and 1 edge labels
pnml2lts-mc( 0/ 4): State length is 76, there are 56107 groups
pnml2lts-mc( 0/ 4): Running ufscc using 4 cores
pnml2lts-mc( 0/ 4): Using a tree table with 2^30 elements
pnml2lts-mc( 0/ 4): Successor permutation: dynamic
pnml2lts-mc( 0/ 4): Global bits: 0, count bits: 0, local bits: 0
pnml2lts-mc( 0/ 4):
pnml2lts-mc( 0/ 4): total scc count: 1
pnml2lts-mc( 0/ 4): unique states count: 1
pnml2lts-mc( 0/ 4): unique transitions count: 0
pnml2lts-mc( 0/ 4): - self-loop count: 0
pnml2lts-mc( 0/ 4): - claim dead count: 0
pnml2lts-mc( 0/ 4): - claim found count: 0
pnml2lts-mc( 0/ 4): - claim success count: 4
pnml2lts-mc( 0/ 4): - cum. max stack depth: 4
pnml2lts-mc( 0/ 4):
pnml2lts-mc( 0/ 4): Explored 4 states 4 transitions, fanout: 1.000
pnml2lts-mc( 0/ 4): Total exploration time 0.010 sec (0.000 sec minimum, 0.005 sec on average)
pnml2lts-mc( 0/ 4): States per second: 400, Transitions per second: 400
pnml2lts-mc( 0/ 4):
pnml2lts-mc( 0/ 4): Queue width: 12B, total height: 0, memory: 0.00MB
pnml2lts-mc( 0/ 4): Tree memory: 0.0MB, 96.0 B/state, compr.: 31.4%
pnml2lts-mc( 0/ 4): Tree fill ratio (roots/leafs): 0.0%/0.0%
pnml2lts-mc( 0/ 4): Stored 57088 string chucks using 1MB
pnml2lts-mc( 0/ 4): Total memory used for chunk indexing: 3MB
pnml2lts-mc( 0/ 4): Est. total memory use: 3.0MB (~8195.0MB paged-in)
ltl formula name GlobalResAllocation-PT-05-LTLCardinality-07
ltl formula formula --ltl=/tmp/ltl_7_
pnml2lts-mc( 0/ 4): Loading model from model.pnml
pnml2lts-mc( 0/ 4): Edge label is id
pnml2lts-mc( 0/ 4): Petri net has 75 places, 56105 transitions and 492760 arcs
pnml2lts-mc( 0/ 4): Petri net GlobalResAllocation-PT-05 analyzed
pnml2lts-mc( 0/ 4): There are no safe places
pnml2lts-mc( 0/ 4): Loading Petri net took 3.750 real 6.450 user 3.250 sys
pnml2lts-mc( 2/ 4): LTL layer: formula: /tmp/ltl_7_
pnml2lts-mc( 0/ 4): Weak Buchi automaton detected, adding non-accepting as progress label.
pnml2lts-mc( 0/ 4): There are 162 state labels and 1 edge labels
pnml2lts-mc( 0/ 4): State length is 76, there are 56107 groups
pnml2lts-mc( 0/ 4): Running ufscc using 4 cores
pnml2lts-mc( 0/ 4): Using a tree table with 2^30 elements
pnml2lts-mc( 0/ 4): Successor permutation: dynamic
pnml2lts-mc( 0/ 4): Global bits: 0, count bits: 0, local bits: 0
pnml2lts-mc( 0/ 4):
pnml2lts-mc( 0/ 4): total scc count: 1
pnml2lts-mc( 0/ 4): unique states count: 1
pnml2lts-mc( 0/ 4): unique transitions count: 0
pnml2lts-mc( 0/ 4): - self-loop count: 0
pnml2lts-mc( 0/ 4): - claim dead count: 0
pnml2lts-mc( 0/ 4): - claim found count: 0
pnml2lts-mc( 0/ 4): - claim success count: 4
pnml2lts-mc( 0/ 4): - cum. max stack depth: 4
pnml2lts-mc( 0/ 4):
pnml2lts-mc( 0/ 4): Explored 4 states 4 transitions, fanout: 1.000
pnml2lts-mc( 0/ 4): Total exploration time 0.010 sec (0.000 sec minimum, 0.007 sec on average)
pnml2lts-mc( 0/ 4): States per second: 400, Transitions per second: 400
pnml2lts-mc( 0/ 4):
pnml2lts-mc( 0/ 4): Queue width: 12B, total height: 0, memory: 0.00MB
pnml2lts-mc( 0/ 4): Tree memory: 0.0MB, 96.0 B/state, compr.: 31.4%
pnml2lts-mc( 0/ 4): Tree fill ratio (roots/leafs): 0.0%/0.0%
pnml2lts-mc( 0/ 4): Stored 57088 string chucks using 1MB
pnml2lts-mc( 0/ 4): Total memory used for chunk indexing: 3MB
pnml2lts-mc( 0/ 4): Est. total memory use: 3.0MB (~8195.0MB paged-in)
ltl formula name GlobalResAllocation-PT-05-LTLCardinality-08
ltl formula formula --ltl=/tmp/ltl_8_
pnml2lts-mc( 0/ 4): Loading model from model.pnml
pnml2lts-mc( 0/ 4): Edge label is id
pnml2lts-mc( 0/ 4): Petri net has 75 places, 56105 transitions and 492760 arcs
pnml2lts-mc( 0/ 4): Petri net GlobalResAllocation-PT-05 analyzed
pnml2lts-mc( 0/ 4): There are no safe places
pnml2lts-mc( 0/ 4): Loading Petri net took 3.620 real 6.670 user 2.970 sys
pnml2lts-mc( 1/ 4): LTL layer: formula: /tmp/ltl_8_
pnml2lts-mc( 0/ 4): Weak Buchi automaton detected, adding non-accepting as progress label.
pnml2lts-mc( 0/ 4): There are 162 state labels and 1 edge labels
pnml2lts-mc( 0/ 4): State length is 76, there are 56107 groups
pnml2lts-mc( 0/ 4): Running ufscc using 4 cores
pnml2lts-mc( 0/ 4): Using a tree table with 2^30 elements
pnml2lts-mc( 0/ 4): Successor permutation: dynamic
pnml2lts-mc( 0/ 4): Global bits: 0, count bits: 0, local bits: 0
pnml2lts-mc( 0/ 4):
pnml2lts-mc( 0/ 4): total scc count: 1
pnml2lts-mc( 0/ 4): unique states count: 1
pnml2lts-mc( 0/ 4): unique transitions count: 0
pnml2lts-mc( 0/ 4): - self-loop count: 0
pnml2lts-mc( 0/ 4): - claim dead count: 0
pnml2lts-mc( 0/ 4): - claim found count: 0
pnml2lts-mc( 0/ 4): - claim success count: 4
pnml2lts-mc( 0/ 4): - cum. max stack depth: 4
pnml2lts-mc( 0/ 4):
pnml2lts-mc( 0/ 4): Explored 4 states 4 transitions, fanout: 1.000
pnml2lts-mc( 0/ 4): Total exploration time 0.010 sec (0.000 sec minimum, 0.007 sec on average)
pnml2lts-mc( 0/ 4): States per second: 400, Transitions per second: 400
pnml2lts-mc( 0/ 4):
pnml2lts-mc( 0/ 4): Queue width: 12B, total height: 0, memory: 0.00MB
pnml2lts-mc( 0/ 4): Tree memory: 0.0MB, 96.0 B/state, compr.: 31.4%
pnml2lts-mc( 0/ 4): Tree fill ratio (roots/leafs): 0.0%/0.0%
pnml2lts-mc( 0/ 4): Stored 57088 string chucks using 1MB
pnml2lts-mc( 0/ 4): Total memory used for chunk indexing: 3MB
pnml2lts-mc( 0/ 4): Est. total memory use: 3.0MB (~8195.0MB paged-in)
ltl formula name GlobalResAllocation-PT-05-LTLCardinality-09
ltl formula formula --ltl=/tmp/ltl_9_
pnml2lts-mc( 0/ 4): Loading model from model.pnml
pnml2lts-mc( 0/ 4): Edge label is id
pnml2lts-mc( 0/ 4): Petri net has 75 places, 56105 transitions and 492760 arcs
pnml2lts-mc( 0/ 4): Petri net GlobalResAllocation-PT-05 analyzed
pnml2lts-mc( 0/ 4): There are no safe places
pnml2lts-mc( 0/ 4): Loading Petri net took 4.210 real 7.270 user 3.020 sys
pnml2lts-mc( 1/ 4): LTL layer: formula: /tmp/ltl_9_
pnml2lts-mc( 0/ 4): Weak Buchi automaton detected, adding non-accepting as progress label.
pnml2lts-mc( 0/ 4): There are 162 state labels and 1 edge labels
pnml2lts-mc( 0/ 4): State length is 76, there are 56113 groups
pnml2lts-mc( 0/ 4): Running ufscc using 4 cores
pnml2lts-mc( 0/ 4): Using a tree table with 2^30 elements
pnml2lts-mc( 0/ 4): Successor permutation: dynamic
pnml2lts-mc( 0/ 4): Global bits: 0, count bits: 0, local bits: 0
pnml2lts-mc( 1/ 4):
pnml2lts-mc( 1/ 4): Accepting cycle FOUND at depth ~10!
pnml2lts-mc( 1/ 4):
pnml2lts-mc( 0/ 4):
pnml2lts-mc( 0/ 4): total scc count: 0
pnml2lts-mc( 0/ 4): unique states count: 32
pnml2lts-mc( 0/ 4): unique transitions count: 56481
pnml2lts-mc( 0/ 4): - self-loop count: 0
pnml2lts-mc( 0/ 4): - claim dead count: 0
pnml2lts-mc( 0/ 4): - claim found count: 1
pnml2lts-mc( 0/ 4): - claim success count: 35
pnml2lts-mc( 0/ 4): - cum. max stack depth: 35
pnml2lts-mc( 0/ 4):
pnml2lts-mc( 0/ 4): Explored 35 states 144385 transitions, fanout: 4125.286
pnml2lts-mc( 0/ 4): Total exploration time 0.120 sec (0.110 sec minimum, 0.112 sec on average)
pnml2lts-mc( 0/ 4): States per second: 292, Transitions per second: 1203208
pnml2lts-mc( 0/ 4):
pnml2lts-mc( 0/ 4): Queue width: 12B, total height: 0, memory: 0.00MB
pnml2lts-mc( 0/ 4): Tree memory: 0.1MB, 28.4 B/state, compr.: 9.3%
pnml2lts-mc( 0/ 4): Tree fill ratio (roots/leafs): 0.0%/0.0%
pnml2lts-mc( 0/ 4): Stored 57088 string chucks using 1MB
pnml2lts-mc( 0/ 4): Total memory used for chunk indexing: 3MB
pnml2lts-mc( 0/ 4): Est. total memory use: 3.1MB (~8195.0MB paged-in)
ltl formula name GlobalResAllocation-PT-05-LTLCardinality-10
ltl formula formula --ltl=/tmp/ltl_10_
pnml2lts-mc( 0/ 4): Loading model from model.pnml
pnml2lts-mc( 0/ 4): Edge label is id
pnml2lts-mc( 0/ 4): Petri net has 75 places, 56105 transitions and 492760 arcs
pnml2lts-mc( 0/ 4): Petri net GlobalResAllocation-PT-05 analyzed
pnml2lts-mc( 0/ 4): There are no safe places
pnml2lts-mc( 0/ 4): Loading Petri net took 3.760 real 6.850 user 2.870 sys
pnml2lts-mc( 2/ 4): LTL layer: formula: /tmp/ltl_10_
pnml2lts-mc( 0/ 4): Weak Buchi automaton detected, adding non-accepting as progress label.
pnml2lts-mc( 0/ 4): There are 162 state labels and 1 edge labels
pnml2lts-mc( 0/ 4): State length is 76, there are 56107 groups
pnml2lts-mc( 0/ 4): Running ufscc using 4 cores
pnml2lts-mc( 0/ 4): Using a tree table with 2^30 elements
pnml2lts-mc( 0/ 4): Successor permutation: dynamic
pnml2lts-mc( 0/ 4): Global bits: 0, count bits: 0, local bits: 0
pnml2lts-mc( 0/ 4):
pnml2lts-mc( 0/ 4): total scc count: 1
pnml2lts-mc( 0/ 4): unique states count: 1
pnml2lts-mc( 0/ 4): unique transitions count: 0
pnml2lts-mc( 0/ 4): - self-loop count: 0
pnml2lts-mc( 0/ 4): - claim dead count: 0
pnml2lts-mc( 0/ 4): - claim found count: 0
pnml2lts-mc( 0/ 4): - claim success count: 4
pnml2lts-mc( 0/ 4): - cum. max stack depth: 4
pnml2lts-mc( 0/ 4):
pnml2lts-mc( 0/ 4): Explored 4 states 4 transitions, fanout: 1.000
pnml2lts-mc( 0/ 4): Total exploration time 0.010 sec (0.000 sec minimum, 0.007 sec on average)
pnml2lts-mc( 0/ 4): States per second: 400, Transitions per second: 400
pnml2lts-mc( 0/ 4):
pnml2lts-mc( 0/ 4): Queue width: 12B, total height: 0, memory: 0.00MB
pnml2lts-mc( 0/ 4): Tree memory: 0.0MB, 96.0 B/state, compr.: 31.4%
pnml2lts-mc( 0/ 4): Tree fill ratio (roots/leafs): 0.0%/0.0%
pnml2lts-mc( 0/ 4): Stored 57088 string chucks using 1MB
pnml2lts-mc( 0/ 4): Total memory used for chunk indexing: 3MB
pnml2lts-mc( 0/ 4): Est. total memory use: 3.0MB (~8195.0MB paged-in)
ltl formula name GlobalResAllocation-PT-05-LTLCardinality-11
ltl formula formula --ltl=/tmp/ltl_11_
pnml2lts-mc( 0/ 4): Loading model from model.pnml
pnml2lts-mc( 0/ 4): Edge label is id
pnml2lts-mc( 0/ 4): Petri net has 75 places, 56105 transitions and 492760 arcs
pnml2lts-mc( 0/ 4): Petri net GlobalResAllocation-PT-05 analyzed
pnml2lts-mc( 0/ 4): There are no safe places
pnml2lts-mc( 0/ 4): Loading Petri net took 3.840 real 6.740 user 3.130 sys
pnml2lts-mc( 0/ 4): LTL layer: formula: /tmp/ltl_11_
pnml2lts-mc( 0/ 4): buchi has 7 states
pnml2lts-mc( 0/ 4): There are 161 state labels and 1 edge labels
pnml2lts-mc( 0/ 4): State length is 76, there are 56120 groups
pnml2lts-mc( 0/ 4): Running ufscc using 4 cores
pnml2lts-mc( 0/ 4): Using a tree table with 2^30 elements
pnml2lts-mc( 0/ 4): Successor permutation: dynamic
pnml2lts-mc( 0/ 4): Global bits: 0, count bits: 0, local bits: 0
pnml2lts-mc( 2/ 4):
pnml2lts-mc( 2/ 4): Accepting cycle FOUND at depth ~91!
pnml2lts-mc( 2/ 4):
pnml2lts-mc( 0/ 4):
pnml2lts-mc( 0/ 4): total scc count: 168
pnml2lts-mc( 0/ 4): unique states count: 598
pnml2lts-mc( 0/ 4): unique transitions count: 277286
pnml2lts-mc( 0/ 4): - self-loop count: 0
pnml2lts-mc( 0/ 4): - claim dead count: 164
pnml2lts-mc( 0/ 4): - claim found count: 510
pnml2lts-mc( 0/ 4): - claim success count: 601
pnml2lts-mc( 0/ 4): - cum. max stack depth: 434
pnml2lts-mc( 0/ 4):
pnml2lts-mc( 0/ 4): Explored 601 states 365190 transitions, fanout: 607.637
pnml2lts-mc( 0/ 4): Total exploration time 0.630 sec (0.620 sec minimum, 0.627 sec on average)
pnml2lts-mc( 0/ 4): States per second: 954, Transitions per second: 579667
pnml2lts-mc( 0/ 4):
pnml2lts-mc( 0/ 4): Queue width: 12B, total height: 0, memory: 0.00MB
pnml2lts-mc( 0/ 4): Tree memory: 0.5MB, 20.9 B/state, compr.: 6.8%
pnml2lts-mc( 0/ 4): Tree fill ratio (roots/leafs): 0.0%/0.0%
pnml2lts-mc( 0/ 4): Stored 57088 string chucks using 1MB
pnml2lts-mc( 0/ 4): Total memory used for chunk indexing: 3MB
pnml2lts-mc( 0/ 4): Est. total memory use: 3.5MB (~8195.0MB paged-in)
ltl formula name GlobalResAllocation-PT-05-LTLCardinality-12
ltl formula formula --ltl=/tmp/ltl_12_
pnml2lts-mc( 0/ 4): Loading model from model.pnml
pnml2lts-mc( 0/ 4): Edge label is id
pnml2lts-mc( 0/ 4): Petri net has 75 places, 56105 transitions and 492760 arcs
pnml2lts-mc( 0/ 4): Petri net GlobalResAllocation-PT-05 analyzed
pnml2lts-mc( 0/ 4): There are no safe places
pnml2lts-mc( 0/ 4): Loading Petri net took 4.600 real 7.450 user 3.360 sys
pnml2lts-mc( 2/ 4): LTL layer: formula: /tmp/ltl_12_
pnml2lts-mc( 0/ 4): Weak Buchi automaton detected, adding non-accepting as progress label.
pnml2lts-mc( 0/ 4): There are 162 state labels and 1 edge labels
pnml2lts-mc( 0/ 4): State length is 76, there are 56107 groups
pnml2lts-mc( 0/ 4): Running ufscc using 4 cores
pnml2lts-mc( 0/ 4): Using a tree table with 2^30 elements
pnml2lts-mc( 0/ 4): Successor permutation: dynamic
pnml2lts-mc( 0/ 4): Global bits: 0, count bits: 0, local bits: 0
pnml2lts-mc( 0/ 4):
pnml2lts-mc( 0/ 4): Accepting cycle FOUND at depth ~14!
pnml2lts-mc( 0/ 4):
pnml2lts-mc( 0/ 4):
pnml2lts-mc( 0/ 4): total scc count: 0
pnml2lts-mc( 0/ 4): unique states count: 43
pnml2lts-mc( 0/ 4): unique transitions count: 44912
pnml2lts-mc( 0/ 4): - self-loop count: 0
pnml2lts-mc( 0/ 4): - claim dead count: 0
pnml2lts-mc( 0/ 4): - claim found count: 1
pnml2lts-mc( 0/ 4): - claim success count: 46
pnml2lts-mc( 0/ 4): - cum. max stack depth: 46
pnml2lts-mc( 0/ 4):
pnml2lts-mc( 0/ 4): Explored 46 states 132816 transitions, fanout: 2887.304
pnml2lts-mc( 0/ 4): Total exploration time 0.210 sec (0.210 sec minimum, 0.210 sec on average)
pnml2lts-mc( 0/ 4): States per second: 219, Transitions per second: 632457
pnml2lts-mc( 0/ 4):
pnml2lts-mc( 0/ 4): Queue width: 12B, total height: 0, memory: 0.00MB
pnml2lts-mc( 0/ 4): Tree memory: 0.1MB, 29.0 B/state, compr.: 9.5%
pnml2lts-mc( 0/ 4): Tree fill ratio (roots/leafs): 0.0%/0.0%
pnml2lts-mc( 0/ 4): Stored 57088 string chucks using 1MB
pnml2lts-mc( 0/ 4): Total memory used for chunk indexing: 3MB
pnml2lts-mc( 0/ 4): Est. total memory use: 3.1MB (~8195.0MB paged-in)
ltl formula name GlobalResAllocation-PT-05-LTLCardinality-13
ltl formula formula --ltl=/tmp/ltl_13_
pnml2lts-mc( 0/ 4): Loading model from model.pnml
pnml2lts-mc( 0/ 4): Edge label is id
pnml2lts-mc( 0/ 4): Petri net has 75 places, 56105 transitions and 492760 arcs
pnml2lts-mc( 0/ 4): Petri net GlobalResAllocation-PT-05 analyzed
pnml2lts-mc( 0/ 4): There are no safe places
pnml2lts-mc( 0/ 4): Loading Petri net took 4.070 real 7.090 user 3.180 sys
pnml2lts-mc( 2/ 4): LTL layer: formula: /tmp/ltl_13_
pnml2lts-mc( 0/ 4): Weak Buchi automaton detected, adding non-accepting as progress label.
pnml2lts-mc( 0/ 4): There are 162 state labels and 1 edge labels
pnml2lts-mc( 0/ 4): State length is 76, there are 56108 groups
pnml2lts-mc( 0/ 4): Running ufscc using 4 cores
pnml2lts-mc( 0/ 4): Using a tree table with 2^30 elements
pnml2lts-mc( 0/ 4): Successor permutation: dynamic
pnml2lts-mc( 0/ 4): Global bits: 0, count bits: 0, local bits: 0
pnml2lts-mc( 1/ 4):
pnml2lts-mc( 1/ 4): Accepting cycle FOUND at depth ~12!
pnml2lts-mc( 1/ 4):
pnml2lts-mc( 0/ 4):
pnml2lts-mc( 0/ 4): total scc count: 76
pnml2lts-mc( 0/ 4): unique states count: 110
pnml2lts-mc( 0/ 4): unique transitions count: 41981
pnml2lts-mc( 0/ 4): - self-loop count: 0
pnml2lts-mc( 0/ 4): - claim dead count: 4
pnml2lts-mc( 0/ 4): - claim found count: 1
pnml2lts-mc( 0/ 4): - claim success count: 113
pnml2lts-mc( 0/ 4): - cum. max stack depth: 37
pnml2lts-mc( 0/ 4):
pnml2lts-mc( 0/ 4): Explored 113 states 129885 transitions, fanout: 1149.425
pnml2lts-mc( 0/ 4): Total exploration time 0.490 sec (0.470 sec minimum, 0.485 sec on average)
pnml2lts-mc( 0/ 4): States per second: 231, Transitions per second: 265071
pnml2lts-mc( 0/ 4):
pnml2lts-mc( 0/ 4): Queue width: 12B, total height: 0, memory: 0.00MB
pnml2lts-mc( 0/ 4): Tree memory: 0.1MB, 28.3 B/state, compr.: 9.2%
pnml2lts-mc( 0/ 4): Tree fill ratio (roots/leafs): 0.0%/0.0%
pnml2lts-mc( 0/ 4): Stored 57088 string chucks using 1MB
pnml2lts-mc( 0/ 4): Total memory used for chunk indexing: 3MB
pnml2lts-mc( 0/ 4): Est. total memory use: 3.1MB (~8195.0MB paged-in)
ltl formula name GlobalResAllocation-PT-05-LTLCardinality-14
ltl formula formula --ltl=/tmp/ltl_14_
pnml2lts-mc( 0/ 4): Loading model from model.pnml
pnml2lts-mc( 0/ 4): Edge label is id
pnml2lts-mc( 0/ 4): Petri net has 75 places, 56105 transitions and 492760 arcs
pnml2lts-mc( 0/ 4): Petri net GlobalResAllocation-PT-05 analyzed
pnml2lts-mc( 0/ 4): There are no safe places
pnml2lts-mc( 0/ 4): Loading Petri net took 5.740 real 7.950 user 4.660 sys
pnml2lts-mc( 2/ 4): LTL layer: formula: /tmp/ltl_14_
pnml2lts-mc( 0/ 4): Weak Buchi automaton detected, adding non-accepting as progress label.
pnml2lts-mc( 0/ 4): There are 162 state labels and 1 edge labels
pnml2lts-mc( 0/ 4): State length is 76, there are 56107 groups
pnml2lts-mc( 0/ 4): Running ufscc using 4 cores
pnml2lts-mc( 0/ 4): Using a tree table with 2^30 elements
pnml2lts-mc( 0/ 4): Successor permutation: dynamic
pnml2lts-mc( 0/ 4): Global bits: 0, count bits: 0, local bits: 0
pnml2lts-mc( 0/ 4):
pnml2lts-mc( 0/ 4): total scc count: 1
pnml2lts-mc( 0/ 4): unique states count: 1
pnml2lts-mc( 0/ 4): unique transitions count: 0
pnml2lts-mc( 0/ 4): - self-loop count: 0
pnml2lts-mc( 0/ 4): - claim dead count: 0
pnml2lts-mc( 0/ 4): - claim found count: 0
pnml2lts-mc( 0/ 4): - claim success count: 4
pnml2lts-mc( 0/ 4): - cum. max stack depth: 4
pnml2lts-mc( 0/ 4):
pnml2lts-mc( 0/ 4): Explored 4 states 4 transitions, fanout: 1.000
pnml2lts-mc( 0/ 4): Total exploration time 0.040 sec (0.020 sec minimum, 0.035 sec on average)
pnml2lts-mc( 0/ 4): States per second: 100, Transitions per second: 100
pnml2lts-mc( 0/ 4):
pnml2lts-mc( 0/ 4): Queue width: 12B, total height: 0, memory: 0.00MB
pnml2lts-mc( 0/ 4): Tree memory: 0.0MB, 96.0 B/state, compr.: 31.4%
pnml2lts-mc( 0/ 4): Tree fill ratio (roots/leafs): 0.0%/0.0%
pnml2lts-mc( 0/ 4): Stored 57088 string chucks using 1MB
pnml2lts-mc( 0/ 4): Total memory used for chunk indexing: 3MB
pnml2lts-mc( 0/ 4): Est. total memory use: 3.0MB (~8195.0MB paged-in)
ltl formula name GlobalResAllocation-PT-05-LTLCardinality-15
ltl formula formula --ltl=/tmp/ltl_15_
pnml2lts-mc( 0/ 4): Loading model from model.pnml
pnml2lts-mc( 0/ 4): Edge label is id
pnml2lts-mc( 0/ 4): Petri net has 75 places, 56105 transitions and 492760 arcs
pnml2lts-mc( 0/ 4): Petri net GlobalResAllocation-PT-05 analyzed
pnml2lts-mc( 0/ 4): There are no safe places
pnml2lts-mc( 0/ 4): Loading Petri net took 4.040 real 6.620 user 2.950 sys
pnml2lts-mc( 3/ 4): LTL layer: formula: /tmp/ltl_15_
pnml2lts-mc( 0/ 4): Weak Buchi automaton detected, adding non-accepting as progress label.
pnml2lts-mc( 0/ 4): There are 162 state labels and 1 edge labels
pnml2lts-mc( 0/ 4): State length is 76, there are 56107 groups
pnml2lts-mc( 0/ 4): Running ufscc using 4 cores
pnml2lts-mc( 0/ 4): Using a tree table with 2^30 elements
pnml2lts-mc( 0/ 4): Successor permutation: dynamic
pnml2lts-mc( 0/ 4): Global bits: 0, count bits: 0, local bits: 0
pnml2lts-mc( 0/ 4):
pnml2lts-mc( 0/ 4): total scc count: 1
pnml2lts-mc( 0/ 4): unique states count: 1
pnml2lts-mc( 0/ 4): unique transitions count: 0
pnml2lts-mc( 0/ 4): - self-loop count: 0
pnml2lts-mc( 0/ 4): - claim dead count: 0
pnml2lts-mc( 0/ 4): - claim found count: 0
pnml2lts-mc( 0/ 4): - claim success count: 4
pnml2lts-mc( 0/ 4): - cum. max stack depth: 4
pnml2lts-mc( 0/ 4):
pnml2lts-mc( 0/ 4): Explored 4 states 4 transitions, fanout: 1.000
pnml2lts-mc( 0/ 4): Total exploration time 0.020 sec (0.000 sec minimum, 0.010 sec on average)
pnml2lts-mc( 0/ 4): States per second: 200, Transitions per second: 200
pnml2lts-mc( 0/ 4):
pnml2lts-mc( 0/ 4): Queue width: 12B, total height: 0, memory: 0.00MB
pnml2lts-mc( 0/ 4): Tree memory: 0.0MB, 96.0 B/state, compr.: 31.4%
pnml2lts-mc( 0/ 4): Tree fill ratio (roots/leafs): 0.0%/0.0%
pnml2lts-mc( 0/ 4): Stored 57088 string chucks using 1MB
pnml2lts-mc( 0/ 4): Total memory used for chunk indexing: 3MB
pnml2lts-mc( 0/ 4): Est. total memory use: 3.0MB (~8195.0MB paged-in)
Sequence of Actions to be Executed by the VM
This is useful if one wants to reexecute the tool in the VM from the submitted image disk.
set -x
# this is for BenchKit: configuration of major elements for the test
export BK_INPUT="GlobalResAllocation-PT-05"
export BK_EXAMINATION="LTLCardinality"
export BK_TOOL="ltsmin"
export BK_RESULT_DIR="/tmp/BK_RESULTS/OUTPUTS"
export BK_TIME_CONFINEMENT="3600"
export BK_MEMORY_CONFINEMENT="16384"
# this is specific to your benchmark or test
export BIN_DIR="$HOME/BenchKit/bin"
# remove the execution directoty if it exists (to avoid increse of .vmdk images)
if [ -d execution ] ; then
rm -rf execution
fi
tar xzf /home/mcc/BenchKit/INPUTS/GlobalResAllocation-PT-05.tgz
mv GlobalResAllocation-PT-05 execution
cd execution
pwd
ls -lh
# this is for BenchKit: explicit launching of the test
echo "====================================================================="
echo " Generated by BenchKit 2-3637"
echo " Executing tool ltsmin"
echo " Input is GlobalResAllocation-PT-05, examination is LTLCardinality"
echo " Time confinement is $BK_TIME_CONFINEMENT seconds"
echo " Memory confinement is 16384 MBytes"
echo " Number of cores is 4"
echo " Run identifier is r245-blw7-152732547700119"
echo "====================================================================="
echo
echo "--------------------"
echo "content from stdout:"
echo
echo "=== Data for post analysis generated by BenchKit (invocation template)"
echo
if [ "LTLCardinality" = "UpperBounds" ] ; then
echo "The expected result is a vector of positive values"
echo NUM_VECTOR
elif [ "LTLCardinality" != "StateSpace" ] ; then
echo "The expected result is a vector of booleans"
echo BOOL_VECTOR
else
echo "no data necessary for post analysis"
fi
echo
if [ -f "LTLCardinality.txt" ] ; then
echo "here is the order used to build the result vector(from text file)"
for x in $(grep Property LTLCardinality.txt | cut -d ' ' -f 2 | sort -u) ; do
echo "FORMULA_NAME $x"
done
elif [ -f "LTLCardinality.xml" ] ; then # for cunf (txt files deleted;-)
echo echo "here is the order used to build the result vector(from xml file)"
for x in $(grep '
echo "FORMULA_NAME $x"
done
fi
echo
echo "=== Now, execution of the tool begins"
echo
echo -n "BK_START "
date -u +%s%3N
echo
timeout -s 9 $BK_TIME_CONFINEMENT bash -c "/home/mcc/BenchKit/BenchKit_head.sh 2> STDERR ; echo ; echo -n \"BK_STOP \" ; date -u +%s%3N"
if [ $? -eq 137 ] ; then
echo
echo "BK_TIME_CONFINEMENT_REACHED"
fi
echo
echo "--------------------"
echo "content from stderr:"
echo
cat STDERR ;