

About the Execution of LTSMin for FlexibleBarrier-PT-20a
| Execution Summary | |||||
| Max Memory Used (MB) |
Time wait (ms) | CPU Usage (ms) | I/O Wait (ms) | Computed Result | Execution Status |
| 14063.820 | 51571.00 | 190060.00 | 45.40 | FFFFFFFFFFFFTFFF | normal |
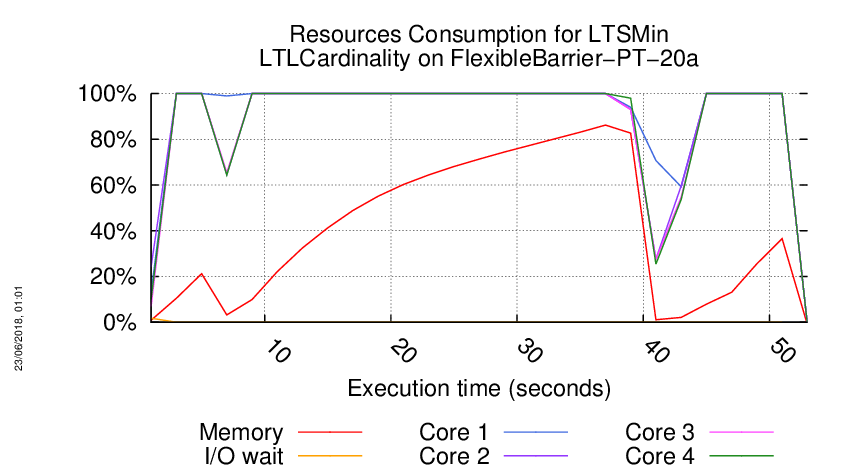
Execution Chart
We display below the execution chart for this examination (boot time has been removed).
Trace from the execution
Waiting for the VM to be ready (probing ssh)
...........................
/home/mcc/execution
total 484K
-rw-r--r-- 1 mcc users 3.5K May 15 18:54 CTLCardinality.txt
-rw-r--r-- 1 mcc users 20K May 15 18:54 CTLCardinality.xml
-rw-r--r-- 1 mcc users 2.2K May 15 18:54 CTLFireability.txt
-rw-r--r-- 1 mcc users 13K May 15 18:54 CTLFireability.xml
-rw-r--r-- 1 mcc users 4.0K May 15 18:50 GenericPropertiesDefinition.xml
-rw-r--r-- 1 mcc users 6.1K May 15 18:50 GenericPropertiesVerdict.xml
-rw-r--r-- 1 mcc users 2.4K May 26 09:26 LTLCardinality.txt
-rw-r--r-- 1 mcc users 11K May 26 09:26 LTLCardinality.xml
-rw-r--r-- 1 mcc users 1.9K May 26 09:26 LTLFireability.txt
-rw-r--r-- 1 mcc users 8.2K May 26 09:26 LTLFireability.xml
-rw-r--r-- 1 mcc users 3.4K May 15 18:54 ReachabilityCardinality.txt
-rw-r--r-- 1 mcc users 17K May 15 18:54 ReachabilityCardinality.xml
-rw-r--r-- 1 mcc users 113 May 15 18:54 ReachabilityDeadlock.txt
-rw-r--r-- 1 mcc users 351 May 15 18:54 ReachabilityDeadlock.xml
-rw-r--r-- 1 mcc users 2.5K May 15 18:54 ReachabilityFireability.txt
-rw-r--r-- 1 mcc users 13K May 15 18:54 ReachabilityFireability.xml
-rw-r--r-- 1 mcc users 1.7K May 15 18:54 UpperBounds.txt
-rw-r--r-- 1 mcc users 3.7K May 15 18:54 UpperBounds.xml
-rw-r--r-- 1 mcc users 6 May 15 18:50 equiv_col
-rw-r--r-- 1 mcc users 4 May 15 18:50 instance
-rw-r--r-- 1 mcc users 6 May 15 18:50 iscolored
-rw-r--r-- 1 mcc users 321K May 15 18:50 model.pnml
=====================================================================
Generated by BenchKit 2-3637
Executing tool ltsmin
Input is FlexibleBarrier-PT-20a, examination is LTLCardinality
Time confinement is 3600 seconds
Memory confinement is 16384 MBytes
Number of cores is 4
Run identifier is r245-blw7-152732547600061
=====================================================================
--------------------
content from stdout:
=== Data for post analysis generated by BenchKit (invocation template)
The expected result is a vector of booleans
BOOL_VECTOR
here is the order used to build the result vector(from text file)
FORMULA_NAME FlexibleBarrier-PT-20a-LTLCardinality-00
FORMULA_NAME FlexibleBarrier-PT-20a-LTLCardinality-01
FORMULA_NAME FlexibleBarrier-PT-20a-LTLCardinality-02
FORMULA_NAME FlexibleBarrier-PT-20a-LTLCardinality-03
FORMULA_NAME FlexibleBarrier-PT-20a-LTLCardinality-04
FORMULA_NAME FlexibleBarrier-PT-20a-LTLCardinality-05
FORMULA_NAME FlexibleBarrier-PT-20a-LTLCardinality-06
FORMULA_NAME FlexibleBarrier-PT-20a-LTLCardinality-07
FORMULA_NAME FlexibleBarrier-PT-20a-LTLCardinality-08
FORMULA_NAME FlexibleBarrier-PT-20a-LTLCardinality-09
FORMULA_NAME FlexibleBarrier-PT-20a-LTLCardinality-10
FORMULA_NAME FlexibleBarrier-PT-20a-LTLCardinality-11
FORMULA_NAME FlexibleBarrier-PT-20a-LTLCardinality-12
FORMULA_NAME FlexibleBarrier-PT-20a-LTLCardinality-13
FORMULA_NAME FlexibleBarrier-PT-20a-LTLCardinality-14
FORMULA_NAME FlexibleBarrier-PT-20a-LTLCardinality-15
=== Now, execution of the tool begins
BK_START 1527920634576
FORMULA FlexibleBarrier-PT-20a-LTLCardinality-00 FALSE TECHNIQUES EXPLICIT PARALLEL_PROCESSING USE_NUPN
FORMULA FlexibleBarrier-PT-20a-LTLCardinality-01 FALSE TECHNIQUES EXPLICIT PARALLEL_PROCESSING USE_NUPN
FORMULA FlexibleBarrier-PT-20a-LTLCardinality-02 FALSE TECHNIQUES EXPLICIT PARALLEL_PROCESSING USE_NUPN
FORMULA FlexibleBarrier-PT-20a-LTLCardinality-03 FALSE TECHNIQUES EXPLICIT PARALLEL_PROCESSING USE_NUPN
FORMULA FlexibleBarrier-PT-20a-LTLCardinality-04 FALSE TECHNIQUES EXPLICIT PARALLEL_PROCESSING USE_NUPN
FORMULA FlexibleBarrier-PT-20a-LTLCardinality-05 FALSE TECHNIQUES EXPLICIT PARALLEL_PROCESSING USE_NUPN
FORMULA FlexibleBarrier-PT-20a-LTLCardinality-06 FALSE TECHNIQUES EXPLICIT PARALLEL_PROCESSING USE_NUPN
FORMULA FlexibleBarrier-PT-20a-LTLCardinality-07 FALSE TECHNIQUES EXPLICIT PARALLEL_PROCESSING USE_NUPN
FORMULA FlexibleBarrier-PT-20a-LTLCardinality-08 FALSE TECHNIQUES EXPLICIT PARALLEL_PROCESSING USE_NUPN
FORMULA FlexibleBarrier-PT-20a-LTLCardinality-09 FALSE TECHNIQUES EXPLICIT PARALLEL_PROCESSING USE_NUPN
FORMULA FlexibleBarrier-PT-20a-LTLCardinality-10 FALSE TECHNIQUES EXPLICIT PARALLEL_PROCESSING USE_NUPN
FORMULA FlexibleBarrier-PT-20a-LTLCardinality-11 FALSE TECHNIQUES EXPLICIT PARALLEL_PROCESSING USE_NUPN
FORMULA FlexibleBarrier-PT-20a-LTLCardinality-12 TRUE TECHNIQUES EXPLICIT PARALLEL_PROCESSING USE_NUPN
FORMULA FlexibleBarrier-PT-20a-LTLCardinality-13 FALSE TECHNIQUES EXPLICIT PARALLEL_PROCESSING USE_NUPN
FORMULA FlexibleBarrier-PT-20a-LTLCardinality-14 FALSE TECHNIQUES EXPLICIT PARALLEL_PROCESSING USE_NUPN
FORMULA FlexibleBarrier-PT-20a-LTLCardinality-15 FALSE TECHNIQUES EXPLICIT PARALLEL_PROCESSING USE_NUPN
BK_STOP 1527920686147
--------------------
content from stderr:
mcc2018
ltl formula name FlexibleBarrier-PT-20a-LTLCardinality-00
ltl formula formula --ltl=/tmp/ltl_0_
pnml2lts-mc( 0/ 4): Loading model from model.pnml
pnml2lts-mc( 0/ 4): Edge label is id
pnml2lts-mc( 0/ 4): Petri net has 243 places, 1064 transitions and 5317 arcs
pnml2lts-mc( 0/ 4): Petri net FlexibleBarrier-PT-20a analyzed
pnml2lts-mc( 0/ 4): There are safe places
pnml2lts-mc( 0/ 4): Loading Petri net took 0.090 real 0.060 user 0.110 sys
pnml2lts-mc( 0/ 4): LTL layer: formula: /tmp/ltl_0_
pnml2lts-mc( 0/ 4): buchi has 3 states
pnml2lts-mc( 0/ 4): Weak Buchi automaton detected, adding non-accepting as progress label.
pnml2lts-mc( 0/ 4): There are 245 state labels and 1 edge labels
pnml2lts-mc( 0/ 4): State length is 244, there are 1071 groups
pnml2lts-mc( 0/ 4): Running ufscc using 4 cores
pnml2lts-mc( 0/ 4): Using a tree table with 2^30 elements
pnml2lts-mc( 0/ 4): Successor permutation: dynamic
pnml2lts-mc( 0/ 4): Global bits: 0, count bits: 0, local bits: 0
pnml2lts-mc( 0/ 4): ~2500 levels ~10000 states ~1277980 transitions
pnml2lts-mc( 0/ 4): ~5000 levels ~20000 states ~2645060 transitions
pnml2lts-mc( 0/ 4): ~10000 levels ~40000 states ~5388648 transitions
pnml2lts-mc( 2/ 4):
pnml2lts-mc( 2/ 4): Accepting cycle FOUND at depth ~15130!
pnml2lts-mc( 2/ 4):
pnml2lts-mc( 0/ 4):
pnml2lts-mc( 0/ 4): total scc count: 0
pnml2lts-mc( 0/ 4): unique states count: 66662
pnml2lts-mc( 0/ 4): unique transitions count: 7092822
pnml2lts-mc( 0/ 4): - self-loop count: 0
pnml2lts-mc( 0/ 4): - claim dead count: 0
pnml2lts-mc( 0/ 4): - claim found count: 1609438
pnml2lts-mc( 0/ 4): - claim success count: 66668
pnml2lts-mc( 0/ 4): - cum. max stack depth: 66668
pnml2lts-mc( 0/ 4):
pnml2lts-mc( 0/ 4): Explored 66668 states 7092892 transitions, fanout: 106.391
pnml2lts-mc( 0/ 4): Total exploration time 5.190 sec (5.190 sec minimum, 5.190 sec on average)
pnml2lts-mc( 0/ 4): States per second: 12845, Transitions per second: 1366646
pnml2lts-mc( 0/ 4):
pnml2lts-mc( 0/ 4): Queue width: 12B, total height: 0, memory: 0.00MB
pnml2lts-mc( 0/ 4): Tree memory: 10.8MB, 8.4 B/state, compr.: 0.9%
pnml2lts-mc( 0/ 4): Tree fill ratio (roots/leafs): 0.0%/0.0%
pnml2lts-mc( 0/ 4): Stored 1094 string chucks using 0MB
pnml2lts-mc( 0/ 4): Total memory used for chunk indexing: 0MB
pnml2lts-mc( 0/ 4): Est. total memory use: 10.8MB (~8192.0MB paged-in)
ltl formula name FlexibleBarrier-PT-20a-LTLCardinality-01
ltl formula formula --ltl=/tmp/ltl_1_
pnml2lts-mc( 0/ 4): Loading model from model.pnml
pnml2lts-mc( 0/ 4): Edge label is id
pnml2lts-mc( 0/ 4): Petri net has 243 places, 1064 transitions and 5317 arcs
pnml2lts-mc( 0/ 4): Petri net FlexibleBarrier-PT-20a analyzed
pnml2lts-mc( 0/ 4): There are safe places
pnml2lts-mc( 0/ 4): Loading Petri net took 0.070 real 0.070 user 0.070 sys
pnml2lts-mc( 3/ 4): LTL layer: formula: /tmp/ltl_1_
pnml2lts-mc( 0/ 4): There are 244 state labels and 1 edge labels
pnml2lts-mc( 0/ 4): State length is 244, there are 1070 groups
pnml2lts-mc( 0/ 4): Running ufscc using 4 cores
pnml2lts-mc( 0/ 4): Using a tree table with 2^30 elements
pnml2lts-mc( 0/ 4): Successor permutation: dynamic
pnml2lts-mc( 0/ 4): Global bits: 0, count bits: 0, local bits: 0
pnml2lts-mc( 3/ 4):
pnml2lts-mc( 3/ 4): Accepting cycle FOUND at depth ~4!
pnml2lts-mc( 3/ 4):
pnml2lts-mc( 0/ 4):
pnml2lts-mc( 0/ 4): total scc count: 0
pnml2lts-mc( 0/ 4): unique states count: 9
pnml2lts-mc( 0/ 4): unique transitions count: 429
pnml2lts-mc( 0/ 4): - self-loop count: 0
pnml2lts-mc( 0/ 4): - claim dead count: 0
pnml2lts-mc( 0/ 4): - claim found count: 1
pnml2lts-mc( 0/ 4): - claim success count: 16
pnml2lts-mc( 0/ 4): - cum. max stack depth: 16
pnml2lts-mc( 0/ 4):
pnml2lts-mc( 0/ 4): Explored 16 states 560 transitions, fanout: 35.000
pnml2lts-mc( 0/ 4): Total exploration time 0.010 sec (0.010 sec minimum, 0.010 sec on average)
pnml2lts-mc( 0/ 4): States per second: 1600, Transitions per second: 56000
pnml2lts-mc( 0/ 4):
pnml2lts-mc( 0/ 4): Queue width: 12B, total height: 0, memory: 0.00MB
pnml2lts-mc( 0/ 4): Tree memory: 0.0MB, 19.3 B/state, compr.: 2.0%
pnml2lts-mc( 0/ 4): Tree fill ratio (roots/leafs): 0.0%/0.0%
pnml2lts-mc( 0/ 4): Stored 1094 string chucks using 0MB
pnml2lts-mc( 0/ 4): Total memory used for chunk indexing: 0MB
pnml2lts-mc( 0/ 4): Est. total memory use: 0.0MB (~8192.0MB paged-in)
ltl formula name FlexibleBarrier-PT-20a-LTLCardinality-02
ltl formula formula --ltl=/tmp/ltl_2_
pnml2lts-mc( 0/ 4): Loading model from model.pnml
pnml2lts-mc( 0/ 4): Edge label is id
pnml2lts-mc( 0/ 4): Petri net has 243 places, 1064 transitions and 5317 arcs
pnml2lts-mc( 0/ 4): Petri net FlexibleBarrier-PT-20a analyzed
pnml2lts-mc( 0/ 4): There are safe places
pnml2lts-mc( 0/ 4): Loading Petri net took 0.060 real 0.080 user 0.060 sys
pnml2lts-mc( 2/ 4): LTL layer: formula: /tmp/ltl_2_
pnml2lts-mc( 0/ 4): Weak Buchi automaton detected, adding non-accepting as progress label.
pnml2lts-mc( 0/ 4): There are 245 state labels and 1 edge labels
pnml2lts-mc( 0/ 4): State length is 244, there are 1066 groups
pnml2lts-mc( 0/ 4): Running ufscc using 4 cores
pnml2lts-mc( 0/ 4): Using a tree table with 2^30 elements
pnml2lts-mc( 0/ 4): Successor permutation: dynamic
pnml2lts-mc( 0/ 4): Global bits: 0, count bits: 0, local bits: 0
pnml2lts-mc( 3/ 4):
pnml2lts-mc( 3/ 4): Accepting cycle FOUND at depth ~4!
pnml2lts-mc( 3/ 4):
pnml2lts-mc( 0/ 4):
pnml2lts-mc( 0/ 4): total scc count: 0
pnml2lts-mc( 0/ 4): unique states count: 10
pnml2lts-mc( 0/ 4): unique transitions count: 450
pnml2lts-mc( 0/ 4): - self-loop count: 0
pnml2lts-mc( 0/ 4): - claim dead count: 0
pnml2lts-mc( 0/ 4): - claim found count: 2
pnml2lts-mc( 0/ 4): - claim success count: 16
pnml2lts-mc( 0/ 4): - cum. max stack depth: 16
pnml2lts-mc( 0/ 4):
pnml2lts-mc( 0/ 4): Explored 16 states 520 transitions, fanout: 32.500
pnml2lts-mc( 0/ 4): Total exploration time 0.000 sec (0.000 sec minimum, 0.000 sec on average)
pnml2lts-mc( 0/ 4): States per second: inf, Transitions per second: inf
pnml2lts-mc( 0/ 4):
pnml2lts-mc( 0/ 4): Queue width: 12B, total height: 0, memory: 0.00MB
pnml2lts-mc( 0/ 4): Tree memory: 0.0MB, 18.8 B/state, compr.: 1.9%
pnml2lts-mc( 0/ 4): Tree fill ratio (roots/leafs): 0.0%/0.0%
pnml2lts-mc( 0/ 4): Stored 1094 string chucks using 0MB
pnml2lts-mc( 0/ 4): Total memory used for chunk indexing: 0MB
pnml2lts-mc( 0/ 4): Est. total memory use: 0.0MB (~8192.0MB paged-in)
ltl formula name FlexibleBarrier-PT-20a-LTLCardinality-03
ltl formula formula --ltl=/tmp/ltl_3_
pnml2lts-mc( 0/ 4): Loading model from model.pnml
pnml2lts-mc( 0/ 4): Edge label is id
pnml2lts-mc( 0/ 4): Petri net has 243 places, 1064 transitions and 5317 arcs
pnml2lts-mc( 0/ 4): Petri net FlexibleBarrier-PT-20a analyzed
pnml2lts-mc( 0/ 4): There are safe places
pnml2lts-mc( 0/ 4): Loading Petri net took 0.050 real 0.070 user 0.050 sys
pnml2lts-mc( 1/ 4): LTL layer: formula: /tmp/ltl_3_
pnml2lts-mc( 0/ 4): There are 244 state labels and 1 edge labels
pnml2lts-mc( 0/ 4): State length is 244, there are 1074 groups
pnml2lts-mc( 0/ 4): Running ufscc using 4 cores
pnml2lts-mc( 0/ 4): Using a tree table with 2^30 elements
pnml2lts-mc( 0/ 4): Successor permutation: dynamic
pnml2lts-mc( 0/ 4): Global bits: 0, count bits: 0, local bits: 0
pnml2lts-mc( 1/ 4):
pnml2lts-mc( 1/ 4): Accepting cycle FOUND at depth ~6!
pnml2lts-mc( 1/ 4):
pnml2lts-mc( 0/ 4):
pnml2lts-mc( 0/ 4): total scc count: 0
pnml2lts-mc( 0/ 4): unique states count: 15
pnml2lts-mc( 0/ 4): unique transitions count: 1353
pnml2lts-mc( 0/ 4): - self-loop count: 0
pnml2lts-mc( 0/ 4): - claim dead count: 0
pnml2lts-mc( 0/ 4): - claim found count: 11
pnml2lts-mc( 0/ 4): - claim success count: 22
pnml2lts-mc( 0/ 4): - cum. max stack depth: 22
pnml2lts-mc( 0/ 4):
pnml2lts-mc( 0/ 4): Explored 22 states 1605 transitions, fanout: 72.955
pnml2lts-mc( 0/ 4): Total exploration time 0.010 sec (0.010 sec minimum, 0.010 sec on average)
pnml2lts-mc( 0/ 4): States per second: 2200, Transitions per second: 160500
pnml2lts-mc( 0/ 4):
pnml2lts-mc( 0/ 4): Queue width: 12B, total height: 0, memory: 0.00MB
pnml2lts-mc( 0/ 4): Tree memory: 0.0MB, 14.6 B/state, compr.: 1.5%
pnml2lts-mc( 0/ 4): Tree fill ratio (roots/leafs): 0.0%/0.0%
pnml2lts-mc( 0/ 4): Stored 1094 string chucks using 0MB
pnml2lts-mc( 0/ 4): Total memory used for chunk indexing: 0MB
pnml2lts-mc( 0/ 4): Est. total memory use: 0.0MB (~8192.0MB paged-in)
ltl formula name FlexibleBarrier-PT-20a-LTLCardinality-04
ltl formula formula --ltl=/tmp/ltl_4_
pnml2lts-mc( 0/ 4): Loading model from model.pnml
pnml2lts-mc( 0/ 4): Edge label is id
pnml2lts-mc( 0/ 4): Petri net has 243 places, 1064 transitions and 5317 arcs
pnml2lts-mc( 0/ 4): Petri net FlexibleBarrier-PT-20a analyzed
pnml2lts-mc( 0/ 4): There are safe places
pnml2lts-mc( 0/ 4): Loading Petri net took 0.060 real 0.070 user 0.050 sys
pnml2lts-mc( 1/ 4): LTL layer: formula: /tmp/ltl_4_
pnml2lts-mc( 0/ 4): Weak Buchi automaton detected, adding non-accepting as progress label.
pnml2lts-mc( 0/ 4): There are 245 state labels and 1 edge labels
pnml2lts-mc( 0/ 4): State length is 244, there are 1067 groups
pnml2lts-mc( 0/ 4): Running ufscc using 4 cores
pnml2lts-mc( 0/ 4): Using a tree table with 2^30 elements
pnml2lts-mc( 0/ 4): Successor permutation: dynamic
pnml2lts-mc( 0/ 4): Global bits: 0, count bits: 0, local bits: 0
pnml2lts-mc( 1/ 4):
pnml2lts-mc( 1/ 4): Accepting cycle FOUND at depth ~4!
pnml2lts-mc( 1/ 4):
pnml2lts-mc( 0/ 4):
pnml2lts-mc( 0/ 4): total scc count: 0
pnml2lts-mc( 0/ 4): unique states count: 9
pnml2lts-mc( 0/ 4): unique transitions count: 494
pnml2lts-mc( 0/ 4): - self-loop count: 0
pnml2lts-mc( 0/ 4): - claim dead count: 0
pnml2lts-mc( 0/ 4): - claim found count: 2
pnml2lts-mc( 0/ 4): - claim success count: 16
pnml2lts-mc( 0/ 4): - cum. max stack depth: 16
pnml2lts-mc( 0/ 4):
pnml2lts-mc( 0/ 4): Explored 16 states 622 transitions, fanout: 38.875
pnml2lts-mc( 0/ 4): Total exploration time 0.000 sec (0.000 sec minimum, 0.000 sec on average)
pnml2lts-mc( 0/ 4): States per second: inf, Transitions per second: inf
pnml2lts-mc( 0/ 4):
pnml2lts-mc( 0/ 4): Queue width: 12B, total height: 0, memory: 0.00MB
pnml2lts-mc( 0/ 4): Tree memory: 0.0MB, 18.2 B/state, compr.: 1.9%
pnml2lts-mc( 0/ 4): Tree fill ratio (roots/leafs): 0.0%/0.0%
pnml2lts-mc( 0/ 4): Stored 1094 string chucks using 0MB
pnml2lts-mc( 0/ 4): Total memory used for chunk indexing: 0MB
pnml2lts-mc( 0/ 4): Est. total memory use: 0.0MB (~8192.0MB paged-in)
ltl formula name FlexibleBarrier-PT-20a-LTLCardinality-05
ltl formula formula --ltl=/tmp/ltl_5_
pnml2lts-mc( 0/ 4): Loading model from model.pnml
pnml2lts-mc( 0/ 4): Edge label is id
pnml2lts-mc( 0/ 4): Petri net has 243 places, 1064 transitions and 5317 arcs
pnml2lts-mc( 0/ 4): Petri net FlexibleBarrier-PT-20a analyzed
pnml2lts-mc( 0/ 4): There are safe places
pnml2lts-mc( 0/ 4): Loading Petri net took 0.050 real 0.070 user 0.060 sys
pnml2lts-mc( 0/ 4): LTL layer: formula: /tmp/ltl_5_
pnml2lts-mc( 0/ 4): buchi has 2 states
pnml2lts-mc( 0/ 4): Weak Buchi automaton detected, adding non-accepting as progress label.
pnml2lts-mc( 0/ 4): There are 245 state labels and 1 edge labels
pnml2lts-mc( 0/ 4): State length is 244, there are 1066 groups
pnml2lts-mc( 0/ 4): Running ufscc using 4 cores
pnml2lts-mc( 0/ 4): Using a tree table with 2^30 elements
pnml2lts-mc( 0/ 4): Successor permutation: dynamic
pnml2lts-mc( 0/ 4): Global bits: 0, count bits: 0, local bits: 0
pnml2lts-mc( 3/ 4):
pnml2lts-mc( 3/ 4): Accepting cycle FOUND at depth ~4!
pnml2lts-mc( 3/ 4):
pnml2lts-mc( 0/ 4):
pnml2lts-mc( 0/ 4): total scc count: 0
pnml2lts-mc( 0/ 4): unique states count: 9
pnml2lts-mc( 0/ 4): unique transitions count: 494
pnml2lts-mc( 0/ 4): - self-loop count: 0
pnml2lts-mc( 0/ 4): - claim dead count: 0
pnml2lts-mc( 0/ 4): - claim found count: 1
pnml2lts-mc( 0/ 4): - claim success count: 16
pnml2lts-mc( 0/ 4): - cum. max stack depth: 16
pnml2lts-mc( 0/ 4):
pnml2lts-mc( 0/ 4): Explored 16 states 622 transitions, fanout: 38.875
pnml2lts-mc( 0/ 4): Total exploration time 0.010 sec (0.010 sec minimum, 0.010 sec on average)
pnml2lts-mc( 0/ 4): States per second: 1600, Transitions per second: 62200
pnml2lts-mc( 0/ 4):
pnml2lts-mc( 0/ 4): Queue width: 12B, total height: 0, memory: 0.00MB
pnml2lts-mc( 0/ 4): Tree memory: 0.0MB, 16.8 B/state, compr.: 1.7%
pnml2lts-mc( 0/ 4): Tree fill ratio (roots/leafs): 0.0%/0.0%
pnml2lts-mc( 0/ 4): Stored 1094 string chucks using 0MB
pnml2lts-mc( 0/ 4): Total memory used for chunk indexing: 0MB
pnml2lts-mc( 0/ 4): Est. total memory use: 0.0MB (~8192.0MB paged-in)
ltl formula name FlexibleBarrier-PT-20a-LTLCardinality-06
ltl formula formula --ltl=/tmp/ltl_6_
pnml2lts-mc( 0/ 4): Loading model from model.pnml
pnml2lts-mc( 0/ 4): Edge label is id
pnml2lts-mc( 0/ 4): Petri net has 243 places, 1064 transitions and 5317 arcs
pnml2lts-mc( 0/ 4): Petri net FlexibleBarrier-PT-20a analyzed
pnml2lts-mc( 0/ 4): There are safe places
pnml2lts-mc( 0/ 4): Loading Petri net took 0.060 real 0.070 user 0.060 sys
pnml2lts-mc( 2/ 4): LTL layer: formula: /tmp/ltl_6_
pnml2lts-mc( 0/ 4): Weak Buchi automaton detected, adding non-accepting as progress label.
pnml2lts-mc( 0/ 4): There are 245 state labels and 1 edge labels
pnml2lts-mc( 0/ 4): State length is 244, there are 1067 groups
pnml2lts-mc( 0/ 4): Running ufscc using 4 cores
pnml2lts-mc( 0/ 4): Using a tree table with 2^30 elements
pnml2lts-mc( 0/ 4): Successor permutation: dynamic
pnml2lts-mc( 0/ 4): Global bits: 0, count bits: 0, local bits: 0
pnml2lts-mc( 1/ 4): ~2500 levels ~10000 states ~1040140 transitions
pnml2lts-mc( 1/ 4): ~5000 levels ~20000 states ~1530368 transitions
pnml2lts-mc( 1/ 4): ~10000 levels ~40000 states ~2258000 transitions
pnml2lts-mc( 1/ 4): ~20000 levels ~80000 states ~3642812 transitions
pnml2lts-mc( 1/ 4): ~40000 levels ~160000 states ~6273856 transitions
pnml2lts-mc( 1/ 4): ~80000 levels ~320000 states ~11222552 transitions
pnml2lts-mc( 1/ 4): ~160000 levels ~640000 states ~21105792 transitions
pnml2lts-mc( 1/ 4): ~320000 levels ~1280000 states ~40284860 transitions
pnml2lts-mc( 0/ 4):
pnml2lts-mc( 0/ 4): Accepting cycle FOUND at depth ~265048!
pnml2lts-mc( 0/ 4):
pnml2lts-mc( 0/ 4):
pnml2lts-mc( 0/ 4): total scc count: 0
pnml2lts-mc( 0/ 4): unique states count: 1119088
pnml2lts-mc( 0/ 4): unique transitions count: 61884591
pnml2lts-mc( 0/ 4): - self-loop count: 0
pnml2lts-mc( 0/ 4): - claim dead count: 0
pnml2lts-mc( 0/ 4): - claim found count: 15947296
pnml2lts-mc( 0/ 4): - claim success count: 1119095
pnml2lts-mc( 0/ 4): - cum. max stack depth: 1119095
pnml2lts-mc( 0/ 4):
pnml2lts-mc( 0/ 4): Explored 1119095 states 61884719 transitions, fanout: 55.299
pnml2lts-mc( 0/ 4): Total exploration time 31.120 sec (31.120 sec minimum, 31.120 sec on average)
pnml2lts-mc( 0/ 4): States per second: 35961, Transitions per second: 1988584
pnml2lts-mc( 0/ 4):
pnml2lts-mc( 0/ 4): Queue width: 12B, total height: 0, memory: 0.00MB
pnml2lts-mc( 0/ 4): Tree memory: 156.7MB, 8.2 B/state, compr.: 0.8%
pnml2lts-mc( 0/ 4): Tree fill ratio (roots/leafs): 1.0%/0.0%
pnml2lts-mc( 0/ 4): Stored 1094 string chucks using 0MB
pnml2lts-mc( 0/ 4): Total memory used for chunk indexing: 0MB
pnml2lts-mc( 0/ 4): Est. total memory use: 156.7MB (~8192.0MB paged-in)
ltl formula name FlexibleBarrier-PT-20a-LTLCardinality-07
ltl formula formula --ltl=/tmp/ltl_7_
pnml2lts-mc( 0/ 4): Loading model from model.pnml
pnml2lts-mc( 0/ 4): Edge label is id
pnml2lts-mc( 0/ 4): Petri net has 243 places, 1064 transitions and 5317 arcs
pnml2lts-mc( 0/ 4): Petri net FlexibleBarrier-PT-20a analyzed
pnml2lts-mc( 0/ 4): There are safe places
pnml2lts-mc( 2/ 4): LTL layer: formula: /tmp/ltl_7_
pnml2lts-mc( 0/ 4): Loading Petri net took 0.220 real 0.080 user 0.210 sys
pnml2lts-mc( 0/ 4): There are 244 state labels and 1 edge labels
pnml2lts-mc( 0/ 4): State length is 244, there are 1068 groups
pnml2lts-mc( 0/ 4): Running ufscc using 4 cores
pnml2lts-mc( 0/ 4): Using a tree table with 2^30 elements
pnml2lts-mc( 0/ 4): Successor permutation: dynamic
pnml2lts-mc( 0/ 4): Global bits: 0, count bits: 0, local bits: 0
pnml2lts-mc( 0/ 4):
pnml2lts-mc( 0/ 4): Accepting cycle FOUND at depth ~4!
pnml2lts-mc( 0/ 4):
pnml2lts-mc( 0/ 4):
pnml2lts-mc( 0/ 4): total scc count: 0
pnml2lts-mc( 0/ 4): unique states count: 10
pnml2lts-mc( 0/ 4): unique transitions count: 520
pnml2lts-mc( 0/ 4): - self-loop count: 0
pnml2lts-mc( 0/ 4): - claim dead count: 0
pnml2lts-mc( 0/ 4): - claim found count: 1
pnml2lts-mc( 0/ 4): - claim success count: 17
pnml2lts-mc( 0/ 4): - cum. max stack depth: 17
pnml2lts-mc( 0/ 4):
pnml2lts-mc( 0/ 4): Explored 17 states 648 transitions, fanout: 38.118
pnml2lts-mc( 0/ 4): Total exploration time 0.040 sec (0.030 sec minimum, 0.035 sec on average)
pnml2lts-mc( 0/ 4): States per second: 425, Transitions per second: 16200
pnml2lts-mc( 0/ 4):
pnml2lts-mc( 0/ 4): Queue width: 12B, total height: 0, memory: 0.00MB
pnml2lts-mc( 0/ 4): Tree memory: 0.0MB, 17.8 B/state, compr.: 1.8%
pnml2lts-mc( 0/ 4): Tree fill ratio (roots/leafs): 0.0%/0.0%
pnml2lts-mc( 0/ 4): Stored 1094 string chucks using 0MB
pnml2lts-mc( 0/ 4): Total memory used for chunk indexing: 0MB
pnml2lts-mc( 0/ 4): Est. total memory use: 0.0MB (~8192.0MB paged-in)
ltl formula name FlexibleBarrier-PT-20a-LTLCardinality-08
ltl formula formula --ltl=/tmp/ltl_8_
pnml2lts-mc( 0/ 4): Loading model from model.pnml
pnml2lts-mc( 0/ 4): Edge label is id
pnml2lts-mc( 0/ 4): Petri net has 243 places, 1064 transitions and 5317 arcs
pnml2lts-mc( 0/ 4): Petri net FlexibleBarrier-PT-20a analyzed
pnml2lts-mc( 0/ 4): There are safe places
pnml2lts-mc( 0/ 4): Loading Petri net took 0.210 real 0.050 user 0.250 sys
pnml2lts-mc( 1/ 4): LTL layer: formula: /tmp/ltl_8_
pnml2lts-mc( 0/ 4): Weak Buchi automaton detected, adding non-accepting as progress label.
pnml2lts-mc( 0/ 4): There are 245 state labels and 1 edge labels
pnml2lts-mc( 0/ 4): State length is 244, there are 1067 groups
pnml2lts-mc( 0/ 4): Running ufscc using 4 cores
pnml2lts-mc( 0/ 4): Using a tree table with 2^30 elements
pnml2lts-mc( 0/ 4): Successor permutation: dynamic
pnml2lts-mc( 0/ 4): Global bits: 0, count bits: 0, local bits: 0
pnml2lts-mc( 0/ 4):
pnml2lts-mc( 0/ 4): Accepting cycle FOUND at depth ~212!
pnml2lts-mc( 0/ 4):
pnml2lts-mc( 0/ 4):
pnml2lts-mc( 0/ 4): total scc count: 1
pnml2lts-mc( 0/ 4): unique states count: 643
pnml2lts-mc( 0/ 4): unique transitions count: 90293
pnml2lts-mc( 0/ 4): - self-loop count: 0
pnml2lts-mc( 0/ 4): - claim dead count: 0
pnml2lts-mc( 0/ 4): - claim found count: 4009
pnml2lts-mc( 0/ 4): - claim success count: 649
pnml2lts-mc( 0/ 4): - cum. max stack depth: 648
pnml2lts-mc( 0/ 4):
pnml2lts-mc( 0/ 4): Explored 649 states 90363 transitions, fanout: 139.234
pnml2lts-mc( 0/ 4): Total exploration time 0.310 sec (0.300 sec minimum, 0.308 sec on average)
pnml2lts-mc( 0/ 4): States per second: 2094, Transitions per second: 291494
pnml2lts-mc( 0/ 4):
pnml2lts-mc( 0/ 4): Queue width: 12B, total height: 0, memory: 0.00MB
pnml2lts-mc( 0/ 4): Tree memory: 0.3MB, 9.5 B/state, compr.: 1.0%
pnml2lts-mc( 0/ 4): Tree fill ratio (roots/leafs): 0.0%/0.0%
pnml2lts-mc( 0/ 4): Stored 1094 string chucks using 0MB
pnml2lts-mc( 0/ 4): Total memory used for chunk indexing: 0MB
pnml2lts-mc( 0/ 4): Est. total memory use: 0.3MB (~8192.0MB paged-in)
ltl formula name FlexibleBarrier-PT-20a-LTLCardinality-09
ltl formula formula --ltl=/tmp/ltl_9_
pnml2lts-mc( 0/ 4): Loading model from model.pnml
pnml2lts-mc( 0/ 4): Edge label is id
pnml2lts-mc( 0/ 4): Petri net has 243 places, 1064 transitions and 5317 arcs
pnml2lts-mc( 0/ 4): Petri net FlexibleBarrier-PT-20a analyzed
pnml2lts-mc( 1/ 4): LTL layer: formula: /tmp/ltl_9_
pnml2lts-mc( 0/ 4): There are safe places
pnml2lts-mc( 0/ 4): Loading Petri net took 0.180 real 0.070 user 0.140 sys
pnml2lts-mc( 0/ 4): Weak Buchi automaton detected, adding non-accepting as progress label.
pnml2lts-mc( 0/ 4): There are 245 state labels and 1 edge labels
pnml2lts-mc( 0/ 4): State length is 244, there are 1067 groups
pnml2lts-mc( 0/ 4): Running ufscc using 4 cores
pnml2lts-mc( 0/ 4): Using a tree table with 2^30 elements
pnml2lts-mc( 0/ 4): Successor permutation: dynamic
pnml2lts-mc( 0/ 4): Global bits: 0, count bits: 0, local bits: 0
pnml2lts-mc( 3/ 4):
pnml2lts-mc( 3/ 4): Accepting cycle FOUND at depth ~4!
pnml2lts-mc( 3/ 4):
pnml2lts-mc( 0/ 4):
pnml2lts-mc( 0/ 4): total scc count: 0
pnml2lts-mc( 0/ 4): unique states count: 14
pnml2lts-mc( 0/ 4): unique transitions count: 1291
pnml2lts-mc( 0/ 4): - self-loop count: 0
pnml2lts-mc( 0/ 4): - claim dead count: 0
pnml2lts-mc( 0/ 4): - claim found count: 9
pnml2lts-mc( 0/ 4): - claim success count: 19
pnml2lts-mc( 0/ 4): - cum. max stack depth: 19
pnml2lts-mc( 0/ 4):
pnml2lts-mc( 0/ 4): Explored 19 states 1385 transitions, fanout: 72.895
pnml2lts-mc( 0/ 4): Total exploration time 0.040 sec (0.020 sec minimum, 0.035 sec on average)
pnml2lts-mc( 0/ 4): States per second: 475, Transitions per second: 34625
pnml2lts-mc( 0/ 4):
pnml2lts-mc( 0/ 4): Queue width: 12B, total height: 0, memory: 0.00MB
pnml2lts-mc( 0/ 4): Tree memory: 0.0MB, 14.6 B/state, compr.: 1.5%
pnml2lts-mc( 0/ 4): Tree fill ratio (roots/leafs): 0.0%/0.0%
pnml2lts-mc( 0/ 4): Stored 1094 string chucks using 0MB
pnml2lts-mc( 0/ 4): Total memory used for chunk indexing: 0MB
pnml2lts-mc( 0/ 4): Est. total memory use: 0.0MB (~8192.0MB paged-in)
ltl formula name FlexibleBarrier-PT-20a-LTLCardinality-10
ltl formula formula --ltl=/tmp/ltl_10_
pnml2lts-mc( 0/ 4): Loading model from model.pnml
pnml2lts-mc( 0/ 4): Edge label is id
pnml2lts-mc( 0/ 4): Petri net has 243 places, 1064 transitions and 5317 arcs
pnml2lts-mc( 0/ 4): Petri net FlexibleBarrier-PT-20a analyzed
pnml2lts-mc( 0/ 4): There are safe places
pnml2lts-mc( 0/ 4): Loading Petri net took 0.170 real 0.060 user 0.150 sys
pnml2lts-mc( 2/ 4): LTL layer: formula: /tmp/ltl_10_
pnml2lts-mc( 0/ 4): Weak Buchi automaton detected, adding non-accepting as progress label.
pnml2lts-mc( 0/ 4): There are 245 state labels and 1 edge labels
pnml2lts-mc( 0/ 4): State length is 244, there are 1068 groups
pnml2lts-mc( 0/ 4): Running ufscc using 4 cores
pnml2lts-mc( 0/ 4): Using a tree table with 2^30 elements
pnml2lts-mc( 0/ 4): Successor permutation: dynamic
pnml2lts-mc( 0/ 4): Global bits: 0, count bits: 0, local bits: 0
pnml2lts-mc( 3/ 4):
pnml2lts-mc( 3/ 4): Accepting cycle FOUND at depth ~4!
pnml2lts-mc( 3/ 4):
pnml2lts-mc( 0/ 4):
pnml2lts-mc( 0/ 4): total scc count: 0
pnml2lts-mc( 0/ 4): unique states count: 9
pnml2lts-mc( 0/ 4): unique transitions count: 429
pnml2lts-mc( 0/ 4): - self-loop count: 0
pnml2lts-mc( 0/ 4): - claim dead count: 0
pnml2lts-mc( 0/ 4): - claim found count: 1
pnml2lts-mc( 0/ 4): - claim success count: 15
pnml2lts-mc( 0/ 4): - cum. max stack depth: 15
pnml2lts-mc( 0/ 4):
pnml2lts-mc( 0/ 4): Explored 15 states 499 transitions, fanout: 33.267
pnml2lts-mc( 0/ 4): Total exploration time 0.030 sec (0.020 sec minimum, 0.027 sec on average)
pnml2lts-mc( 0/ 4): States per second: 500, Transitions per second: 16633
pnml2lts-mc( 0/ 4):
pnml2lts-mc( 0/ 4): Queue width: 12B, total height: 0, memory: 0.00MB
pnml2lts-mc( 0/ 4): Tree memory: 0.0MB, 20.0 B/state, compr.: 2.0%
pnml2lts-mc( 0/ 4): Tree fill ratio (roots/leafs): 0.0%/0.0%
pnml2lts-mc( 0/ 4): Stored 1094 string chucks using 0MB
pnml2lts-mc( 0/ 4): Total memory used for chunk indexing: 0MB
pnml2lts-mc( 0/ 4): Est. total memory use: 0.0MB (~8192.0MB paged-in)
ltl formula name FlexibleBarrier-PT-20a-LTLCardinality-11
ltl formula formula --ltl=/tmp/ltl_11_
pnml2lts-mc( 0/ 4): Loading model from model.pnml
pnml2lts-mc( 0/ 4): Edge label is id
pnml2lts-mc( 0/ 4): Petri net has 243 places, 1064 transitions and 5317 arcs
pnml2lts-mc( 0/ 4): Petri net FlexibleBarrier-PT-20a analyzed
pnml2lts-mc( 0/ 4): There are safe places
pnml2lts-mc( 2/ 4): LTL layer: formula: /tmp/ltl_11_
pnml2lts-mc( 0/ 4): Loading Petri net took 0.200 real 0.070 user 0.170 sys
pnml2lts-mc( 0/ 4): Weak Buchi automaton detected, adding non-accepting as progress label.
pnml2lts-mc( 0/ 4): There are 245 state labels and 1 edge labels
pnml2lts-mc( 0/ 4): State length is 244, there are 1072 groups
pnml2lts-mc( 0/ 4): Running ufscc using 4 cores
pnml2lts-mc( 0/ 4): Using a tree table with 2^30 elements
pnml2lts-mc( 0/ 4): Successor permutation: dynamic
pnml2lts-mc( 0/ 4): Global bits: 0, count bits: 0, local bits: 0
pnml2lts-mc( 0/ 4): ~2500 levels ~10000 states ~1594232 transitions
pnml2lts-mc( 1/ 4): ~5000 levels ~20000 states ~3851736 transitions
pnml2lts-mc( 0/ 4): ~10000 levels ~40000 states ~5359752 transitions
pnml2lts-mc( 0/ 4): ~20000 levels ~80000 states ~9745032 transitions
pnml2lts-mc( 0/ 4):
pnml2lts-mc( 0/ 4): Accepting cycle FOUND at depth ~25447!
pnml2lts-mc( 0/ 4):
pnml2lts-mc( 0/ 4):
pnml2lts-mc( 0/ 4): total scc count: 0
pnml2lts-mc( 0/ 4): unique states count: 97120
pnml2lts-mc( 0/ 4): unique transitions count: 10423636
pnml2lts-mc( 0/ 4): - self-loop count: 0
pnml2lts-mc( 0/ 4): - claim dead count: 0
pnml2lts-mc( 0/ 4): - claim found count: 2678795
pnml2lts-mc( 0/ 4): - claim success count: 97126
pnml2lts-mc( 0/ 4): - cum. max stack depth: 97126
pnml2lts-mc( 0/ 4):
pnml2lts-mc( 0/ 4): Explored 97126 states 10423769 transitions, fanout: 107.322
pnml2lts-mc( 0/ 4): Total exploration time 8.530 sec (8.520 sec minimum, 8.528 sec on average)
pnml2lts-mc( 0/ 4): States per second: 11386, Transitions per second: 1222013
pnml2lts-mc( 0/ 4):
pnml2lts-mc( 0/ 4): Queue width: 12B, total height: 0, memory: 0.00MB
pnml2lts-mc( 0/ 4): Tree memory: 16.2MB, 8.3 B/state, compr.: 0.9%
pnml2lts-mc( 0/ 4): Tree fill ratio (roots/leafs): 0.0%/0.0%
pnml2lts-mc( 0/ 4): Stored 1094 string chucks using 0MB
pnml2lts-mc( 0/ 4): Total memory used for chunk indexing: 0MB
pnml2lts-mc( 0/ 4): Est. total memory use: 16.2MB (~8192.0MB paged-in)
ltl formula name FlexibleBarrier-PT-20a-LTLCardinality-12
ltl formula formula --ltl=/tmp/ltl_12_
pnml2lts-mc( 0/ 4): Loading model from model.pnml
pnml2lts-mc( 0/ 4): Edge label is id
pnml2lts-mc( 0/ 4): Petri net has 243 places, 1064 transitions and 5317 arcs
pnml2lts-mc( 0/ 4): Petri net FlexibleBarrier-PT-20a analyzed
pnml2lts-mc( 0/ 4): There are safe places
pnml2lts-mc( 0/ 4): Loading Petri net took 0.070 real 0.060 user 0.080 sys
pnml2lts-mc( 1/ 4): LTL layer: formula: /tmp/ltl_12_
pnml2lts-mc( 0/ 4): Weak Buchi automaton detected, adding non-accepting as progress label.
pnml2lts-mc( 0/ 4): There are 245 state labels and 1 edge labels
pnml2lts-mc( 0/ 4): State length is 244, there are 1070 groups
pnml2lts-mc( 0/ 4): Running ufscc using 4 cores
pnml2lts-mc( 0/ 4): Using a tree table with 2^30 elements
pnml2lts-mc( 0/ 4): Successor permutation: dynamic
pnml2lts-mc( 0/ 4): Global bits: 0, count bits: 0, local bits: 0
pnml2lts-mc( 0/ 4):
pnml2lts-mc( 0/ 4): total scc count: 2
pnml2lts-mc( 0/ 4): unique states count: 2
pnml2lts-mc( 0/ 4): unique transitions count: 1
pnml2lts-mc( 0/ 4): - self-loop count: 0
pnml2lts-mc( 0/ 4): - claim dead count: 0
pnml2lts-mc( 0/ 4): - claim found count: 0
pnml2lts-mc( 0/ 4): - claim success count: 8
pnml2lts-mc( 0/ 4): - cum. max stack depth: 8
pnml2lts-mc( 0/ 4):
pnml2lts-mc( 0/ 4): Explored 8 states 8 transitions, fanout: 1.000
pnml2lts-mc( 0/ 4): Total exploration time 0.000 sec (0.000 sec minimum, 0.000 sec on average)
pnml2lts-mc( 0/ 4): States per second: inf, Transitions per second: inf
pnml2lts-mc( 0/ 4):
pnml2lts-mc( 0/ 4): Queue width: 12B, total height: 0, memory: 0.00MB
pnml2lts-mc( 0/ 4): Tree memory: 0.0MB, 112.0 B/state, compr.: 11.5%
pnml2lts-mc( 0/ 4): Tree fill ratio (roots/leafs): 0.0%/0.0%
pnml2lts-mc( 0/ 4): Stored 1094 string chucks using 0MB
pnml2lts-mc( 0/ 4): Total memory used for chunk indexing: 0MB
pnml2lts-mc( 0/ 4): Est. total memory use: 0.0MB (~8192.0MB paged-in)
ltl formula name FlexibleBarrier-PT-20a-LTLCardinality-13
ltl formula formula --ltl=/tmp/ltl_13_
pnml2lts-mc( 0/ 4): Loading model from model.pnml
pnml2lts-mc( 0/ 4): Edge label is id
pnml2lts-mc( 0/ 4): Petri net has 243 places, 1064 transitions and 5317 arcs
pnml2lts-mc( 0/ 4): Petri net FlexibleBarrier-PT-20a analyzed
pnml2lts-mc( 0/ 4): There are safe places
pnml2lts-mc( 0/ 4): Loading Petri net took 0.060 real 0.050 user 0.080 sys
pnml2lts-mc( 1/ 4): LTL layer: formula: /tmp/ltl_13_
pnml2lts-mc( 0/ 4): There are 244 state labels and 1 edge labels
pnml2lts-mc( 0/ 4): State length is 244, there are 1068 groups
pnml2lts-mc( 0/ 4): Running ufscc using 4 cores
pnml2lts-mc( 0/ 4): Using a tree table with 2^30 elements
pnml2lts-mc( 0/ 4): Successor permutation: dynamic
pnml2lts-mc( 0/ 4): Global bits: 0, count bits: 0, local bits: 0
pnml2lts-mc( 1/ 4):
pnml2lts-mc( 1/ 4): Accepting cycle FOUND at depth ~4!
pnml2lts-mc( 1/ 4):
pnml2lts-mc( 0/ 4):
pnml2lts-mc( 0/ 4): total scc count: 0
pnml2lts-mc( 0/ 4): unique states count: 10
pnml2lts-mc( 0/ 4): unique transitions count: 519
pnml2lts-mc( 0/ 4): - self-loop count: 0
pnml2lts-mc( 0/ 4): - claim dead count: 0
pnml2lts-mc( 0/ 4): - claim found count: 1
pnml2lts-mc( 0/ 4): - claim success count: 16
pnml2lts-mc( 0/ 4): - cum. max stack depth: 16
pnml2lts-mc( 0/ 4):
pnml2lts-mc( 0/ 4): Explored 16 states 589 transitions, fanout: 36.812
pnml2lts-mc( 0/ 4): Total exploration time 0.000 sec (0.000 sec minimum, 0.000 sec on average)
pnml2lts-mc( 0/ 4): States per second: inf, Transitions per second: inf
pnml2lts-mc( 0/ 4):
pnml2lts-mc( 0/ 4): Queue width: 12B, total height: 0, memory: 0.00MB
pnml2lts-mc( 0/ 4): Tree memory: 0.0MB, 17.7 B/state, compr.: 1.8%
pnml2lts-mc( 0/ 4): Tree fill ratio (roots/leafs): 0.0%/0.0%
pnml2lts-mc( 0/ 4): Stored 1094 string chucks using 0MB
pnml2lts-mc( 0/ 4): Total memory used for chunk indexing: 0MB
pnml2lts-mc( 0/ 4): Est. total memory use: 0.0MB (~8192.0MB paged-in)
ltl formula name FlexibleBarrier-PT-20a-LTLCardinality-14
ltl formula formula --ltl=/tmp/ltl_14_
pnml2lts-mc( 0/ 4): Loading model from model.pnml
pnml2lts-mc( 0/ 4): Edge label is id
pnml2lts-mc( 0/ 4): Petri net has 243 places, 1064 transitions and 5317 arcs
pnml2lts-mc( 0/ 4): Petri net FlexibleBarrier-PT-20a analyzed
pnml2lts-mc( 0/ 4): There are safe places
pnml2lts-mc( 0/ 4): Loading Petri net took 0.050 real 0.070 user 0.050 sys
pnml2lts-mc( 3/ 4): LTL layer: formula: /tmp/ltl_14_
pnml2lts-mc( 0/ 4): Weak Buchi automaton detected, adding non-accepting as progress label.
pnml2lts-mc( 0/ 4): There are 245 state labels and 1 edge labels
pnml2lts-mc( 0/ 4): State length is 244, there are 1066 groups
pnml2lts-mc( 0/ 4): Running ufscc using 4 cores
pnml2lts-mc( 0/ 4): Using a tree table with 2^30 elements
pnml2lts-mc( 0/ 4): Successor permutation: dynamic
pnml2lts-mc( 0/ 4): Global bits: 0, count bits: 0, local bits: 0
pnml2lts-mc( 1/ 4):
pnml2lts-mc( 1/ 4): Accepting cycle FOUND at depth ~4!
pnml2lts-mc( 1/ 4):
pnml2lts-mc( 0/ 4):
pnml2lts-mc( 0/ 4): total scc count: 0
pnml2lts-mc( 0/ 4): unique states count: 10
pnml2lts-mc( 0/ 4): unique transitions count: 486
pnml2lts-mc( 0/ 4): - self-loop count: 0
pnml2lts-mc( 0/ 4): - claim dead count: 0
pnml2lts-mc( 0/ 4): - claim found count: 2
pnml2lts-mc( 0/ 4): - claim success count: 16
pnml2lts-mc( 0/ 4): - cum. max stack depth: 16
pnml2lts-mc( 0/ 4):
pnml2lts-mc( 0/ 4): Explored 16 states 556 transitions, fanout: 34.750
pnml2lts-mc( 0/ 4): Total exploration time 0.000 sec (0.000 sec minimum, 0.000 sec on average)
pnml2lts-mc( 0/ 4): States per second: inf, Transitions per second: inf
pnml2lts-mc( 0/ 4):
pnml2lts-mc( 0/ 4): Queue width: 12B, total height: 0, memory: 0.00MB
pnml2lts-mc( 0/ 4): Tree memory: 0.0MB, 19.0 B/state, compr.: 1.9%
pnml2lts-mc( 0/ 4): Tree fill ratio (roots/leafs): 0.0%/0.0%
pnml2lts-mc( 0/ 4): Stored 1094 string chucks using 0MB
pnml2lts-mc( 0/ 4): Total memory used for chunk indexing: 0MB
pnml2lts-mc( 0/ 4): Est. total memory use: 0.0MB (~8192.0MB paged-in)
ltl formula name FlexibleBarrier-PT-20a-LTLCardinality-15
ltl formula formula --ltl=/tmp/ltl_15_
pnml2lts-mc( 0/ 4): Loading model from model.pnml
pnml2lts-mc( 0/ 4): Edge label is id
pnml2lts-mc( 0/ 4): Petri net has 243 places, 1064 transitions and 5317 arcs
pnml2lts-mc( 0/ 4): Petri net FlexibleBarrier-PT-20a analyzed
pnml2lts-mc( 0/ 4): There are safe places
pnml2lts-mc( 0/ 4): Loading Petri net took 0.060 real 0.080 user 0.040 sys
pnml2lts-mc( 1/ 4): LTL layer: formula: /tmp/ltl_15_
pnml2lts-mc( 0/ 4): There are 244 state labels and 1 edge labels
pnml2lts-mc( 0/ 4): State length is 244, there are 1068 groups
pnml2lts-mc( 0/ 4): Running ufscc using 4 cores
pnml2lts-mc( 0/ 4): Using a tree table with 2^30 elements
pnml2lts-mc( 0/ 4): Successor permutation: dynamic
pnml2lts-mc( 0/ 4): Global bits: 0, count bits: 0, local bits: 0
pnml2lts-mc( 0/ 4):
pnml2lts-mc( 0/ 4): Accepting cycle FOUND at depth ~4!
pnml2lts-mc( 0/ 4):
pnml2lts-mc( 0/ 4):
pnml2lts-mc( 0/ 4): total scc count: 0
pnml2lts-mc( 0/ 4): unique states count: 10
pnml2lts-mc( 0/ 4): unique transitions count: 486
pnml2lts-mc( 0/ 4): - self-loop count: 0
pnml2lts-mc( 0/ 4): - claim dead count: 0
pnml2lts-mc( 0/ 4): - claim found count: 1
pnml2lts-mc( 0/ 4): - claim success count: 16
pnml2lts-mc( 0/ 4): - cum. max stack depth: 16
pnml2lts-mc( 0/ 4):
pnml2lts-mc( 0/ 4): Explored 16 states 556 transitions, fanout: 34.750
pnml2lts-mc( 0/ 4): Total exploration time 0.000 sec (0.000 sec minimum, 0.000 sec on average)
pnml2lts-mc( 0/ 4): States per second: inf, Transitions per second: inf
pnml2lts-mc( 0/ 4):
pnml2lts-mc( 0/ 4): Queue width: 12B, total height: 0, memory: 0.00MB
pnml2lts-mc( 0/ 4): Tree memory: 0.0MB, 19.1 B/state, compr.: 2.0%
pnml2lts-mc( 0/ 4): Tree fill ratio (roots/leafs): 0.0%/0.0%
pnml2lts-mc( 0/ 4): Stored 1094 string chucks using 0MB
pnml2lts-mc( 0/ 4): Total memory used for chunk indexing: 0MB
pnml2lts-mc( 0/ 4): Est. total memory use: 0.0MB (~8192.0MB paged-in)
Sequence of Actions to be Executed by the VM
This is useful if one wants to reexecute the tool in the VM from the submitted image disk.
set -x
# this is for BenchKit: configuration of major elements for the test
export BK_INPUT="FlexibleBarrier-PT-20a"
export BK_EXAMINATION="LTLCardinality"
export BK_TOOL="ltsmin"
export BK_RESULT_DIR="/tmp/BK_RESULTS/OUTPUTS"
export BK_TIME_CONFINEMENT="3600"
export BK_MEMORY_CONFINEMENT="16384"
# this is specific to your benchmark or test
export BIN_DIR="$HOME/BenchKit/bin"
# remove the execution directoty if it exists (to avoid increse of .vmdk images)
if [ -d execution ] ; then
rm -rf execution
fi
tar xzf /home/mcc/BenchKit/INPUTS/FlexibleBarrier-PT-20a.tgz
mv FlexibleBarrier-PT-20a execution
cd execution
pwd
ls -lh
# this is for BenchKit: explicit launching of the test
echo "====================================================================="
echo " Generated by BenchKit 2-3637"
echo " Executing tool ltsmin"
echo " Input is FlexibleBarrier-PT-20a, examination is LTLCardinality"
echo " Time confinement is $BK_TIME_CONFINEMENT seconds"
echo " Memory confinement is 16384 MBytes"
echo " Number of cores is 4"
echo " Run identifier is r245-blw7-152732547600061"
echo "====================================================================="
echo
echo "--------------------"
echo "content from stdout:"
echo
echo "=== Data for post analysis generated by BenchKit (invocation template)"
echo
if [ "LTLCardinality" = "UpperBounds" ] ; then
echo "The expected result is a vector of positive values"
echo NUM_VECTOR
elif [ "LTLCardinality" != "StateSpace" ] ; then
echo "The expected result is a vector of booleans"
echo BOOL_VECTOR
else
echo "no data necessary for post analysis"
fi
echo
if [ -f "LTLCardinality.txt" ] ; then
echo "here is the order used to build the result vector(from text file)"
for x in $(grep Property LTLCardinality.txt | cut -d ' ' -f 2 | sort -u) ; do
echo "FORMULA_NAME $x"
done
elif [ -f "LTLCardinality.xml" ] ; then # for cunf (txt files deleted;-)
echo echo "here is the order used to build the result vector(from xml file)"
for x in $(grep '
echo "FORMULA_NAME $x"
done
fi
echo
echo "=== Now, execution of the tool begins"
echo
echo -n "BK_START "
date -u +%s%3N
echo
timeout -s 9 $BK_TIME_CONFINEMENT bash -c "/home/mcc/BenchKit/BenchKit_head.sh 2> STDERR ; echo ; echo -n \"BK_STOP \" ; date -u +%s%3N"
if [ $? -eq 137 ] ; then
echo
echo "BK_TIME_CONFINEMENT_REACHED"
fi
echo
echo "--------------------"
echo "content from stderr:"
echo
cat STDERR ;