

About the Execution of LTSMin for FlexibleBarrier-PT-16b
| Execution Summary | |||||
| Max Memory Used (MB) |
Time wait (ms) | CPU Usage (ms) | I/O Wait (ms) | Computed Result | Execution Status |
| 4881.880 | 685428.00 | 2714816.00 | 28.50 | ?FTF?FF?FTTFTFFF | normal |
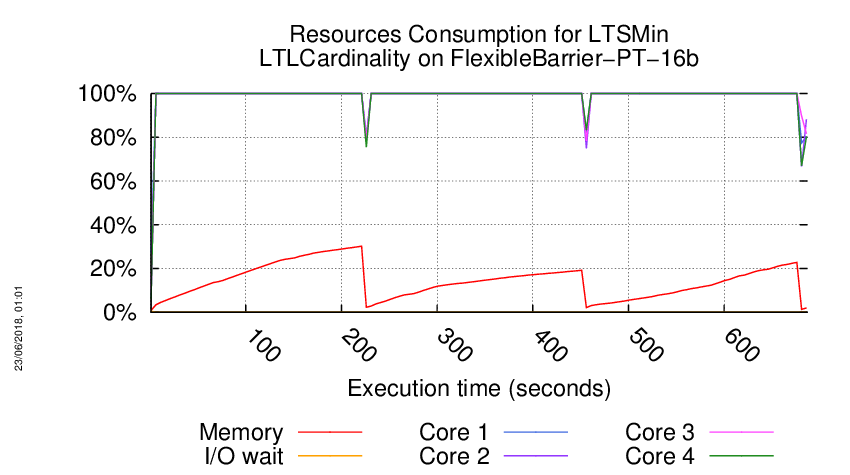
Execution Chart
We display below the execution chart for this examination (boot time has been removed).
Trace from the execution
Waiting for the VM to be ready (probing ssh)
................................
/home/mcc/execution
total 1.1M
-rw-r--r-- 1 mcc users 4.0K May 15 18:54 CTLCardinality.txt
-rw-r--r-- 1 mcc users 23K May 15 18:54 CTLCardinality.xml
-rw-r--r-- 1 mcc users 2.4K May 15 18:54 CTLFireability.txt
-rw-r--r-- 1 mcc users 15K May 15 18:54 CTLFireability.xml
-rw-r--r-- 1 mcc users 4.0K May 15 18:50 GenericPropertiesDefinition.xml
-rw-r--r-- 1 mcc users 6.1K May 15 18:50 GenericPropertiesVerdict.xml
-rw-r--r-- 1 mcc users 2.5K May 26 09:26 LTLCardinality.txt
-rw-r--r-- 1 mcc users 11K May 26 09:26 LTLCardinality.xml
-rw-r--r-- 1 mcc users 2.0K May 26 09:26 LTLFireability.txt
-rw-r--r-- 1 mcc users 9.8K May 26 09:26 LTLFireability.xml
-rw-r--r-- 1 mcc users 3.6K May 15 18:54 ReachabilityCardinality.txt
-rw-r--r-- 1 mcc users 18K May 15 18:54 ReachabilityCardinality.xml
-rw-r--r-- 1 mcc users 113 May 15 18:54 ReachabilityDeadlock.txt
-rw-r--r-- 1 mcc users 351 May 15 18:54 ReachabilityDeadlock.xml
-rw-r--r-- 1 mcc users 2.8K May 15 18:54 ReachabilityFireability.txt
-rw-r--r-- 1 mcc users 16K May 15 18:54 ReachabilityFireability.xml
-rw-r--r-- 1 mcc users 1.7K May 15 18:54 UpperBounds.txt
-rw-r--r-- 1 mcc users 3.7K May 15 18:54 UpperBounds.xml
-rw-r--r-- 1 mcc users 6 May 15 18:50 equiv_col
-rw-r--r-- 1 mcc users 4 May 15 18:50 instance
-rw-r--r-- 1 mcc users 6 May 15 18:50 iscolored
-rw-r--r-- 1 mcc users 945K May 15 18:50 model.pnml
=====================================================================
Generated by BenchKit 2-3637
Executing tool ltsmin
Input is FlexibleBarrier-PT-16b, examination is LTLCardinality
Time confinement is 3600 seconds
Memory confinement is 16384 MBytes
Number of cores is 4
Run identifier is r245-blw7-152732547600055
=====================================================================
--------------------
content from stdout:
=== Data for post analysis generated by BenchKit (invocation template)
The expected result is a vector of booleans
BOOL_VECTOR
here is the order used to build the result vector(from text file)
FORMULA_NAME FlexibleBarrier-PT-16b-LTLCardinality-00
FORMULA_NAME FlexibleBarrier-PT-16b-LTLCardinality-01
FORMULA_NAME FlexibleBarrier-PT-16b-LTLCardinality-02
FORMULA_NAME FlexibleBarrier-PT-16b-LTLCardinality-03
FORMULA_NAME FlexibleBarrier-PT-16b-LTLCardinality-04
FORMULA_NAME FlexibleBarrier-PT-16b-LTLCardinality-05
FORMULA_NAME FlexibleBarrier-PT-16b-LTLCardinality-06
FORMULA_NAME FlexibleBarrier-PT-16b-LTLCardinality-07
FORMULA_NAME FlexibleBarrier-PT-16b-LTLCardinality-08
FORMULA_NAME FlexibleBarrier-PT-16b-LTLCardinality-09
FORMULA_NAME FlexibleBarrier-PT-16b-LTLCardinality-10
FORMULA_NAME FlexibleBarrier-PT-16b-LTLCardinality-11
FORMULA_NAME FlexibleBarrier-PT-16b-LTLCardinality-12
FORMULA_NAME FlexibleBarrier-PT-16b-LTLCardinality-13
FORMULA_NAME FlexibleBarrier-PT-16b-LTLCardinality-14
FORMULA_NAME FlexibleBarrier-PT-16b-LTLCardinality-15
=== Now, execution of the tool begins
BK_START 1527920002565
FORMULA FlexibleBarrier-PT-16b-LTLCardinality-00 CANNOT_COMPUTE
FORMULA FlexibleBarrier-PT-16b-LTLCardinality-01 FALSE TECHNIQUES EXPLICIT PARALLEL_PROCESSING USE_NUPN
FORMULA FlexibleBarrier-PT-16b-LTLCardinality-02 TRUE TECHNIQUES EXPLICIT PARALLEL_PROCESSING USE_NUPN
FORMULA FlexibleBarrier-PT-16b-LTLCardinality-03 FALSE TECHNIQUES EXPLICIT PARALLEL_PROCESSING USE_NUPN
FORMULA FlexibleBarrier-PT-16b-LTLCardinality-04 CANNOT_COMPUTE
FORMULA FlexibleBarrier-PT-16b-LTLCardinality-05 FALSE TECHNIQUES EXPLICIT PARALLEL_PROCESSING USE_NUPN
FORMULA FlexibleBarrier-PT-16b-LTLCardinality-06 FALSE TECHNIQUES EXPLICIT PARALLEL_PROCESSING USE_NUPN
FORMULA FlexibleBarrier-PT-16b-LTLCardinality-07 CANNOT_COMPUTE
FORMULA FlexibleBarrier-PT-16b-LTLCardinality-08 FALSE TECHNIQUES EXPLICIT PARALLEL_PROCESSING USE_NUPN
FORMULA FlexibleBarrier-PT-16b-LTLCardinality-09 TRUE TECHNIQUES EXPLICIT PARALLEL_PROCESSING USE_NUPN
FORMULA FlexibleBarrier-PT-16b-LTLCardinality-10 TRUE TECHNIQUES EXPLICIT PARALLEL_PROCESSING USE_NUPN
FORMULA FlexibleBarrier-PT-16b-LTLCardinality-11 FALSE TECHNIQUES EXPLICIT PARALLEL_PROCESSING USE_NUPN
FORMULA FlexibleBarrier-PT-16b-LTLCardinality-12 TRUE TECHNIQUES EXPLICIT PARALLEL_PROCESSING USE_NUPN
FORMULA FlexibleBarrier-PT-16b-LTLCardinality-13 FALSE TECHNIQUES EXPLICIT PARALLEL_PROCESSING USE_NUPN
FORMULA FlexibleBarrier-PT-16b-LTLCardinality-14 FALSE TECHNIQUES EXPLICIT PARALLEL_PROCESSING USE_NUPN
FORMULA FlexibleBarrier-PT-16b-LTLCardinality-15 FALSE TECHNIQUES EXPLICIT PARALLEL_PROCESSING USE_NUPN
BK_STOP 1527920687993
--------------------
content from stderr:
mcc2018
ltl formula name FlexibleBarrier-PT-16b-LTLCardinality-00
ltl formula formula --ltl=/tmp/ltl_0_
pnml2lts-mc( 0/ 4): Loading model from model.pnml
pnml2lts-mc( 0/ 4): Edge label is id
pnml2lts-mc( 0/ 4): Petri net has 3472 places, 4001 transitions and 10043 arcs
pnml2lts-mc( 0/ 4): Petri net FlexibleBarrier-PT-16b analyzed
pnml2lts-mc( 0/ 4): There are safe places
pnml2lts-mc( 0/ 4): Loading Petri net took 0.290 real 0.300 user 0.330 sys
pnml2lts-mc( 0/ 4): LTL layer: formula: /tmp/ltl_0_
pnml2lts-mc( 0/ 4): buchi has 5 states
pnml2lts-mc( 0/ 4): There are 3473 state labels and 1 edge labels
pnml2lts-mc( 0/ 4): State length is 3473, there are 4014 groups
pnml2lts-mc( 0/ 4): Running ufscc using 4 cores
pnml2lts-mc( 0/ 4): Using a tree table with 2^30 elements
pnml2lts-mc( 0/ 4): Successor permutation: dynamic
pnml2lts-mc( 0/ 4): Global bits: 0, count bits: 0, local bits: 0
pnml2lts-mc( 2/ 4): ~151 levels ~10000 states ~25108 transitions
pnml2lts-mc( 2/ 4): ~151 levels ~20000 states ~47232 transitions
pnml2lts-mc( 2/ 4): ~151 levels ~40000 states ~91660 transitions
pnml2lts-mc( 2/ 4): ~210 levels ~80000 states ~207096 transitions
pnml2lts-mc( 2/ 4): ~546 levels ~160000 states ~466624 transitions
pnml2lts-mc( 2/ 4): ~548 levels ~320000 states ~999576 transitions
ltl formula name FlexibleBarrier-PT-16b-LTLCardinality-01
ltl formula formula --ltl=/tmp/ltl_1_
pnml2lts-mc( 0/ 4): Loading model from model.pnml
pnml2lts-mc( 0/ 4): Edge label is id
pnml2lts-mc( 0/ 4): Petri net has 3472 places, 4001 transitions and 10043 arcs
pnml2lts-mc( 0/ 4): Petri net FlexibleBarrier-PT-16b analyzed
pnml2lts-mc( 0/ 4): There are safe places
pnml2lts-mc( 0/ 4): Loading Petri net took 0.340 real 0.320 user 0.420 sys
pnml2lts-mc( 2/ 4): LTL layer: formula: /tmp/ltl_1_
pnml2lts-mc( 0/ 4): Weak Buchi automaton detected, adding non-accepting as progress label.
pnml2lts-mc( 0/ 4): There are 3474 state labels and 1 edge labels
pnml2lts-mc( 0/ 4): State length is 3473, there are 4002 groups
pnml2lts-mc( 0/ 4): Running ufscc using 4 cores
pnml2lts-mc( 0/ 4): Using a tree table with 2^30 elements
pnml2lts-mc( 0/ 4): Successor permutation: dynamic
pnml2lts-mc( 0/ 4): Global bits: 0, count bits: 0, local bits: 0
pnml2lts-mc( 3/ 4):
pnml2lts-mc( 3/ 4): Accepting cycle FOUND at depth ~99!
pnml2lts-mc( 3/ 4):
pnml2lts-mc( 0/ 4):
pnml2lts-mc( 0/ 4): total scc count: 0
pnml2lts-mc( 0/ 4): unique states count: 382
pnml2lts-mc( 0/ 4): unique transitions count: 3677
pnml2lts-mc( 0/ 4): - self-loop count: 0
pnml2lts-mc( 0/ 4): - claim dead count: 0
pnml2lts-mc( 0/ 4): - claim found count: 1
pnml2lts-mc( 0/ 4): - claim success count: 391
pnml2lts-mc( 0/ 4): - cum. max stack depth: 391
pnml2lts-mc( 0/ 4):
pnml2lts-mc( 0/ 4): Explored 391 states 3700 transitions, fanout: 9.463
pnml2lts-mc( 0/ 4): Total exploration time 0.510 sec (0.500 sec minimum, 0.505 sec on average)
pnml2lts-mc( 0/ 4): States per second: 767, Transitions per second: 7255
pnml2lts-mc( 0/ 4):
pnml2lts-mc( 0/ 4): Queue width: 12B, total height: 0, memory: 0.00MB
pnml2lts-mc( 0/ 4): Tree memory: 0.1MB, 31.3 B/state, compr.: 0.2%
pnml2lts-mc( 0/ 4): Tree fill ratio (roots/leafs): 0.0%/0.0%
pnml2lts-mc( 0/ 4): Stored 4120 string chucks using 0MB
pnml2lts-mc( 0/ 4): Total memory used for chunk indexing: 0MB
pnml2lts-mc( 0/ 4): Est. total memory use: 0.1MB (~8192.0MB paged-in)
ltl formula name FlexibleBarrier-PT-16b-LTLCardinality-02
ltl formula formula --ltl=/tmp/ltl_2_
pnml2lts-mc( 0/ 4): Loading model from model.pnml
pnml2lts-mc( 0/ 4): Edge label is id
pnml2lts-mc( 0/ 4): Petri net has 3472 places, 4001 transitions and 10043 arcs
pnml2lts-mc( 0/ 4): Petri net FlexibleBarrier-PT-16b analyzed
pnml2lts-mc( 0/ 4): There are safe places
pnml2lts-mc( 1/ 4): LTL layer: formula: /tmp/ltl_2_
pnml2lts-mc( 0/ 4): Loading Petri net took 1.380 real 0.200 user 2.270 sys
pnml2lts-mc( 0/ 4): Weak Buchi automaton detected, adding non-accepting as progress label.
pnml2lts-mc( 0/ 4): There are 3474 state labels and 1 edge labels
pnml2lts-mc( 0/ 4): State length is 3473, there are 4003 groups
pnml2lts-mc( 0/ 4): Running ufscc using 4 cores
pnml2lts-mc( 0/ 4): Using a tree table with 2^30 elements
pnml2lts-mc( 0/ 4): Successor permutation: dynamic
pnml2lts-mc( 0/ 4): Global bits: 0, count bits: 0, local bits: 0
pnml2lts-mc( 0/ 4):
pnml2lts-mc( 0/ 4): total scc count: 1
pnml2lts-mc( 0/ 4): unique states count: 1
pnml2lts-mc( 0/ 4): unique transitions count: 0
pnml2lts-mc( 0/ 4): - self-loop count: 0
pnml2lts-mc( 0/ 4): - claim dead count: 0
pnml2lts-mc( 0/ 4): - claim found count: 0
pnml2lts-mc( 0/ 4): - claim success count: 4
pnml2lts-mc( 0/ 4): - cum. max stack depth: 4
pnml2lts-mc( 0/ 4):
pnml2lts-mc( 0/ 4): Explored 4 states 4 transitions, fanout: 1.000
pnml2lts-mc( 0/ 4): Total exploration time 0.000 sec (0.000 sec minimum, 0.000 sec on average)
pnml2lts-mc( 0/ 4): States per second: inf, Transitions per second: inf
pnml2lts-mc( 0/ 4):
pnml2lts-mc( 0/ 4): Queue width: 12B, total height: 0, memory: 0.00MB
pnml2lts-mc( 0/ 4): Tree memory: 0.0MB, 96.0 B/state, compr.: 0.7%
pnml2lts-mc( 0/ 4): Tree fill ratio (roots/leafs): 0.0%/0.0%
pnml2lts-mc( 0/ 4): Stored 4120 string chucks using 0MB
pnml2lts-mc( 0/ 4): Total memory used for chunk indexing: 0MB
pnml2lts-mc( 0/ 4): Est. total memory use: 0.0MB (~8192.0MB paged-in)
ltl formula name FlexibleBarrier-PT-16b-LTLCardinality-03
ltl formula formula --ltl=/tmp/ltl_3_
pnml2lts-mc( 0/ 4): Loading model from model.pnml
pnml2lts-mc( 0/ 4): Edge label is id
pnml2lts-mc( 0/ 4): Petri net has 3472 places, 4001 transitions and 10043 arcs
pnml2lts-mc( 0/ 4): Petri net FlexibleBarrier-PT-16b analyzed
pnml2lts-mc( 0/ 4): There are safe places
pnml2lts-mc( 0/ 4): Loading Petri net took 0.240 real 0.250 user 0.310 sys
pnml2lts-mc( 2/ 4): LTL layer: formula: /tmp/ltl_3_
pnml2lts-mc( 0/ 4): Weak Buchi automaton detected, adding non-accepting as progress label.
pnml2lts-mc( 0/ 4): There are 3474 state labels and 1 edge labels
pnml2lts-mc( 0/ 4): State length is 3473, there are 4004 groups
pnml2lts-mc( 0/ 4): Running ufscc using 4 cores
pnml2lts-mc( 0/ 4): Using a tree table with 2^30 elements
pnml2lts-mc( 0/ 4): Successor permutation: dynamic
pnml2lts-mc( 0/ 4): Global bits: 0, count bits: 0, local bits: 0
pnml2lts-mc( 0/ 4):
pnml2lts-mc( 0/ 4): Accepting cycle FOUND at depth ~111!
pnml2lts-mc( 0/ 4):
pnml2lts-mc( 0/ 4):
pnml2lts-mc( 0/ 4): total scc count: 0
pnml2lts-mc( 0/ 4): unique states count: 378
pnml2lts-mc( 0/ 4): unique transitions count: 9094
pnml2lts-mc( 0/ 4): - self-loop count: 0
pnml2lts-mc( 0/ 4): - claim dead count: 0
pnml2lts-mc( 0/ 4): - claim found count: 2
pnml2lts-mc( 0/ 4): - claim success count: 389
pnml2lts-mc( 0/ 4): - cum. max stack depth: 389
pnml2lts-mc( 0/ 4):
pnml2lts-mc( 0/ 4): Explored 389 states 9594 transitions, fanout: 24.663
pnml2lts-mc( 0/ 4): Total exploration time 0.230 sec (0.230 sec minimum, 0.230 sec on average)
pnml2lts-mc( 0/ 4): States per second: 1691, Transitions per second: 41713
pnml2lts-mc( 0/ 4):
pnml2lts-mc( 0/ 4): Queue width: 12B, total height: 0, memory: 0.00MB
pnml2lts-mc( 0/ 4): Tree memory: 0.2MB, 21.0 B/state, compr.: 0.2%
pnml2lts-mc( 0/ 4): Tree fill ratio (roots/leafs): 0.0%/0.0%
pnml2lts-mc( 0/ 4): Stored 4120 string chucks using 0MB
pnml2lts-mc( 0/ 4): Total memory used for chunk indexing: 0MB
pnml2lts-mc( 0/ 4): Est. total memory use: 0.2MB (~8192.0MB paged-in)
ltl formula name FlexibleBarrier-PT-16b-LTLCardinality-04
ltl formula formula --ltl=/tmp/ltl_4_
pnml2lts-mc( 0/ 4): Loading model from model.pnml
pnml2lts-mc( 0/ 4): Edge label is id
pnml2lts-mc( 0/ 4): Petri net has 3472 places, 4001 transitions and 10043 arcs
pnml2lts-mc( 0/ 4): Petri net FlexibleBarrier-PT-16b analyzed
pnml2lts-mc( 0/ 4): There are safe places
pnml2lts-mc( 0/ 4): Loading Petri net took 0.230 real 0.260 user 0.300 sys
pnml2lts-mc( 0/ 4): LTL layer: formula: /tmp/ltl_4_
pnml2lts-mc( 0/ 4): buchi has 2 states
pnml2lts-mc( 0/ 4): There are 3473 state labels and 1 edge labels
pnml2lts-mc( 0/ 4): State length is 3473, there are 4005 groups
pnml2lts-mc( 0/ 4): Running ufscc using 4 cores
pnml2lts-mc( 0/ 4): Using a tree table with 2^30 elements
pnml2lts-mc( 0/ 4): Successor permutation: dynamic
pnml2lts-mc( 0/ 4): Global bits: 0, count bits: 0, local bits: 0
pnml2lts-mc( 2/ 4): ~144 levels ~10000 states ~23432 transitions
pnml2lts-mc( 2/ 4): ~156 levels ~20000 states ~45808 transitions
pnml2lts-mc( 3/ 4): ~210 levels ~40000 states ~83540 transitions
pnml2lts-mc( 2/ 4): ~483 levels ~80000 states ~218960 transitions
pnml2lts-mc( 3/ 4): ~315 levels ~160000 states ~313352 transitions
pnml2lts-mc( 2/ 4): ~483 levels ~320000 states ~893532 transitions
ltl formula name FlexibleBarrier-PT-16b-LTLCardinality-05
ltl formula formula --ltl=/tmp/ltl_5_
pnml2lts-mc( 0/ 4): Loading model from model.pnml
pnml2lts-mc( 0/ 4): Edge label is id
pnml2lts-mc( 0/ 4): Petri net has 3472 places, 4001 transitions and 10043 arcs
pnml2lts-mc( 0/ 4): Petri net FlexibleBarrier-PT-16b analyzed
pnml2lts-mc( 0/ 4): There are safe places
pnml2lts-mc( 2/ 4): LTL layer: formula: /tmp/ltl_5_
pnml2lts-mc( 0/ 4): Loading Petri net took 1.130 real 0.400 user 1.480 sys
pnml2lts-mc( 0/ 4): Weak Buchi automaton detected, adding non-accepting as progress label.
pnml2lts-mc( 0/ 4): There are 3474 state labels and 1 edge labels
pnml2lts-mc( 0/ 4): State length is 3473, there are 4006 groups
pnml2lts-mc( 0/ 4): Running ufscc using 4 cores
pnml2lts-mc( 0/ 4): Using a tree table with 2^30 elements
pnml2lts-mc( 0/ 4): Successor permutation: dynamic
pnml2lts-mc( 0/ 4): Global bits: 0, count bits: 0, local bits: 0
pnml2lts-mc( 2/ 4):
pnml2lts-mc( 2/ 4): Accepting cycle FOUND at depth ~108!
pnml2lts-mc( 2/ 4):
pnml2lts-mc( 0/ 4):
pnml2lts-mc( 0/ 4): total scc count: 0
pnml2lts-mc( 0/ 4): unique states count: 367
pnml2lts-mc( 0/ 4): unique transitions count: 3540
pnml2lts-mc( 0/ 4): - self-loop count: 1
pnml2lts-mc( 0/ 4): - claim dead count: 0
pnml2lts-mc( 0/ 4): - claim found count: 0
pnml2lts-mc( 0/ 4): - claim success count: 376
pnml2lts-mc( 0/ 4): - cum. max stack depth: 376
pnml2lts-mc( 0/ 4):
pnml2lts-mc( 0/ 4): Explored 376 states 3563 transitions, fanout: 9.476
pnml2lts-mc( 0/ 4): Total exploration time 0.230 sec (0.230 sec minimum, 0.230 sec on average)
pnml2lts-mc( 0/ 4): States per second: 1635, Transitions per second: 15491
pnml2lts-mc( 0/ 4):
pnml2lts-mc( 0/ 4): Queue width: 12B, total height: 0, memory: 0.00MB
pnml2lts-mc( 0/ 4): Tree memory: 0.1MB, 29.7 B/state, compr.: 0.2%
pnml2lts-mc( 0/ 4): Tree fill ratio (roots/leafs): 0.0%/0.0%
pnml2lts-mc( 0/ 4): Stored 4120 string chucks using 0MB
pnml2lts-mc( 0/ 4): Total memory used for chunk indexing: 0MB
pnml2lts-mc( 0/ 4): Est. total memory use: 0.1MB (~8192.0MB paged-in)
ltl formula name FlexibleBarrier-PT-16b-LTLCardinality-06
ltl formula formula --ltl=/tmp/ltl_6_
pnml2lts-mc( 0/ 4): Loading model from model.pnml
pnml2lts-mc( 0/ 4): Edge label is id
pnml2lts-mc( 0/ 4): Petri net has 3472 places, 4001 transitions and 10043 arcs
pnml2lts-mc( 0/ 4): Petri net FlexibleBarrier-PT-16b analyzed
pnml2lts-mc( 0/ 4): There are safe places
pnml2lts-mc( 0/ 4): Loading Petri net took 0.220 real 0.270 user 0.300 sys
pnml2lts-mc( 1/ 4): LTL layer: formula: /tmp/ltl_6_
pnml2lts-mc( 0/ 4): Weak Buchi automaton detected, adding non-accepting as progress label.
pnml2lts-mc( 0/ 4): There are 3474 state labels and 1 edge labels
pnml2lts-mc( 0/ 4): State length is 3473, there are 4002 groups
pnml2lts-mc( 0/ 4): Running ufscc using 4 cores
pnml2lts-mc( 0/ 4): Using a tree table with 2^30 elements
pnml2lts-mc( 0/ 4): Successor permutation: dynamic
pnml2lts-mc( 0/ 4): Global bits: 0, count bits: 0, local bits: 0
pnml2lts-mc( 0/ 4):
pnml2lts-mc( 0/ 4): Accepting cycle FOUND at depth ~103!
pnml2lts-mc( 0/ 4):
pnml2lts-mc( 0/ 4):
pnml2lts-mc( 0/ 4): total scc count: 0
pnml2lts-mc( 0/ 4): unique states count: 331
pnml2lts-mc( 0/ 4): unique transitions count: 3144
pnml2lts-mc( 0/ 4): - self-loop count: 1
pnml2lts-mc( 0/ 4): - claim dead count: 0
pnml2lts-mc( 0/ 4): - claim found count: 0
pnml2lts-mc( 0/ 4): - claim success count: 341
pnml2lts-mc( 0/ 4): - cum. max stack depth: 341
pnml2lts-mc( 0/ 4):
pnml2lts-mc( 0/ 4): Explored 341 states 3169 transitions, fanout: 9.293
pnml2lts-mc( 0/ 4): Total exploration time 0.190 sec (0.190 sec minimum, 0.190 sec on average)
pnml2lts-mc( 0/ 4): States per second: 1795, Transitions per second: 16679
pnml2lts-mc( 0/ 4):
pnml2lts-mc( 0/ 4): Queue width: 12B, total height: 0, memory: 0.00MB
pnml2lts-mc( 0/ 4): Tree memory: 0.1MB, 30.3 B/state, compr.: 0.2%
pnml2lts-mc( 0/ 4): Tree fill ratio (roots/leafs): 0.0%/0.0%
pnml2lts-mc( 0/ 4): Stored 4120 string chucks using 0MB
pnml2lts-mc( 0/ 4): Total memory used for chunk indexing: 0MB
pnml2lts-mc( 0/ 4): Est. total memory use: 0.1MB (~8192.0MB paged-in)
ltl formula name FlexibleBarrier-PT-16b-LTLCardinality-07
ltl formula formula --ltl=/tmp/ltl_7_
pnml2lts-mc( 0/ 4): Loading model from model.pnml
pnml2lts-mc( 0/ 4): Edge label is id
pnml2lts-mc( 0/ 4): Petri net has 3472 places, 4001 transitions and 10043 arcs
pnml2lts-mc( 0/ 4): Petri net FlexibleBarrier-PT-16b analyzed
pnml2lts-mc( 0/ 4): There are safe places
pnml2lts-mc( 0/ 4): Loading Petri net took 0.230 real 0.310 user 0.240 sys
pnml2lts-mc( 0/ 4): LTL layer: formula: /tmp/ltl_7_
pnml2lts-mc( 0/ 4): buchi has 2 states
pnml2lts-mc( 0/ 4): Weak Buchi automaton detected, adding non-accepting as progress label.
pnml2lts-mc( 0/ 4): There are 3474 state labels and 1 edge labels
pnml2lts-mc( 0/ 4): State length is 3473, there are 4004 groups
pnml2lts-mc( 0/ 4): Running ufscc using 4 cores
pnml2lts-mc( 0/ 4): Using a tree table with 2^30 elements
pnml2lts-mc( 0/ 4): Successor permutation: dynamic
pnml2lts-mc( 0/ 4): Global bits: 0, count bits: 0, local bits: 0
pnml2lts-mc( 3/ 4): ~135 levels ~10000 states ~22704 transitions
pnml2lts-mc( 3/ 4): ~145 levels ~20000 states ~42888 transitions
pnml2lts-mc( 2/ 4): ~421 levels ~40000 states ~111332 transitions
pnml2lts-mc( 3/ 4): ~550 levels ~80000 states ~215244 transitions
pnml2lts-mc( 3/ 4): ~552 levels ~160000 states ~459088 transitions
pnml2lts-mc( 3/ 4): ~552 levels ~320000 states ~914764 transitions
ltl formula name FlexibleBarrier-PT-16b-LTLCardinality-08
ltl formula formula --ltl=/tmp/ltl_8_
pnml2lts-mc( 0/ 4): Loading model from model.pnml
pnml2lts-mc( 0/ 4): Edge label is id
pnml2lts-mc( 0/ 4): Petri net has 3472 places, 4001 transitions and 10043 arcs
pnml2lts-mc( 0/ 4): Petri net FlexibleBarrier-PT-16b analyzed
pnml2lts-mc( 0/ 4): There are safe places
pnml2lts-mc( 0/ 4): Loading Petri net took 1.160 real 0.180 user 1.480 sys
pnml2lts-mc( 0/ 4): LTL layer: formula: /tmp/ltl_8_
pnml2lts-mc( 0/ 4): buchi has 3 states
pnml2lts-mc( 0/ 4): There are 3473 state labels and 1 edge labels
pnml2lts-mc( 0/ 4): State length is 3473, there are 4011 groups
pnml2lts-mc( 0/ 4): Running ufscc using 4 cores
pnml2lts-mc( 0/ 4): Using a tree table with 2^30 elements
pnml2lts-mc( 0/ 4): Successor permutation: dynamic
pnml2lts-mc( 0/ 4): Global bits: 0, count bits: 0, local bits: 0
pnml2lts-mc( 3/ 4):
pnml2lts-mc( 3/ 4): Accepting cycle FOUND at depth ~119!
pnml2lts-mc( 3/ 4):
pnml2lts-mc( 0/ 4):
pnml2lts-mc( 0/ 4): total scc count: 0
pnml2lts-mc( 0/ 4): unique states count: 367
pnml2lts-mc( 0/ 4): unique transitions count: 6771
pnml2lts-mc( 0/ 4): - self-loop count: 2
pnml2lts-mc( 0/ 4): - claim dead count: 0
pnml2lts-mc( 0/ 4): - claim found count: 6
pnml2lts-mc( 0/ 4): - claim success count: 376
pnml2lts-mc( 0/ 4): - cum. max stack depth: 376
pnml2lts-mc( 0/ 4):
pnml2lts-mc( 0/ 4): Explored 376 states 6811 transitions, fanout: 18.114
pnml2lts-mc( 0/ 4): Total exploration time 0.220 sec (0.220 sec minimum, 0.220 sec on average)
pnml2lts-mc( 0/ 4): States per second: 1709, Transitions per second: 30959
pnml2lts-mc( 0/ 4):
pnml2lts-mc( 0/ 4): Queue width: 12B, total height: 0, memory: 0.00MB
pnml2lts-mc( 0/ 4): Tree memory: 0.1MB, 32.0 B/state, compr.: 0.2%
pnml2lts-mc( 0/ 4): Tree fill ratio (roots/leafs): 0.0%/0.0%
pnml2lts-mc( 0/ 4): Stored 4120 string chucks using 0MB
pnml2lts-mc( 0/ 4): Total memory used for chunk indexing: 0MB
pnml2lts-mc( 0/ 4): Est. total memory use: 0.1MB (~8192.0MB paged-in)
ltl formula name FlexibleBarrier-PT-16b-LTLCardinality-09
ltl formula formula --ltl=/tmp/ltl_9_
pnml2lts-mc( 0/ 4): Loading model from model.pnml
pnml2lts-mc( 0/ 4): Edge label is id
pnml2lts-mc( 0/ 4): Petri net has 3472 places, 4001 transitions and 10043 arcs
pnml2lts-mc( 0/ 4): Petri net FlexibleBarrier-PT-16b analyzed
pnml2lts-mc( 0/ 4): There are safe places
pnml2lts-mc( 0/ 4): Loading Petri net took 0.240 real 0.310 user 0.280 sys
pnml2lts-mc( 2/ 4): LTL layer: formula: /tmp/ltl_9_
pnml2lts-mc( 0/ 4): Weak Buchi automaton detected, adding non-accepting as progress label.
pnml2lts-mc( 0/ 4): There are 3474 state labels and 1 edge labels
pnml2lts-mc( 0/ 4): State length is 3473, there are 4002 groups
pnml2lts-mc( 0/ 4): Running ufscc using 4 cores
pnml2lts-mc( 0/ 4): Using a tree table with 2^30 elements
pnml2lts-mc( 0/ 4): Successor permutation: dynamic
pnml2lts-mc( 0/ 4): Global bits: 0, count bits: 0, local bits: 0
pnml2lts-mc( 0/ 4):
pnml2lts-mc( 0/ 4): total scc count: 1
pnml2lts-mc( 0/ 4): unique states count: 1
pnml2lts-mc( 0/ 4): unique transitions count: 0
pnml2lts-mc( 0/ 4): - self-loop count: 0
pnml2lts-mc( 0/ 4): - claim dead count: 0
pnml2lts-mc( 0/ 4): - claim found count: 0
pnml2lts-mc( 0/ 4): - claim success count: 4
pnml2lts-mc( 0/ 4): - cum. max stack depth: 4
pnml2lts-mc( 0/ 4):
pnml2lts-mc( 0/ 4): Explored 4 states 4 transitions, fanout: 1.000
pnml2lts-mc( 0/ 4): Total exploration time 0.010 sec (0.000 sec minimum, 0.007 sec on average)
pnml2lts-mc( 0/ 4): States per second: 400, Transitions per second: 400
pnml2lts-mc( 0/ 4):
pnml2lts-mc( 0/ 4): Queue width: 12B, total height: 0, memory: 0.00MB
pnml2lts-mc( 0/ 4): Tree memory: 0.0MB, 96.0 B/state, compr.: 0.7%
pnml2lts-mc( 0/ 4): Tree fill ratio (roots/leafs): 0.0%/0.0%
pnml2lts-mc( 0/ 4): Stored 4120 string chucks using 0MB
pnml2lts-mc( 0/ 4): Total memory used for chunk indexing: 0MB
pnml2lts-mc( 0/ 4): Est. total memory use: 0.0MB (~8192.0MB paged-in)
ltl formula name FlexibleBarrier-PT-16b-LTLCardinality-10
ltl formula formula --ltl=/tmp/ltl_10_
pnml2lts-mc( 0/ 4): Loading model from model.pnml
pnml2lts-mc( 0/ 4): Edge label is id
pnml2lts-mc( 0/ 4): Petri net has 3472 places, 4001 transitions and 10043 arcs
pnml2lts-mc( 0/ 4): Petri net FlexibleBarrier-PT-16b analyzed
pnml2lts-mc( 0/ 4): There are safe places
pnml2lts-mc( 0/ 4): Loading Petri net took 0.250 real 0.360 user 0.250 sys
pnml2lts-mc( 1/ 4): LTL layer: formula: /tmp/ltl_10_
pnml2lts-mc( 0/ 4): Weak Buchi automaton detected, adding non-accepting as progress label.
pnml2lts-mc( 0/ 4): There are 3474 state labels and 1 edge labels
pnml2lts-mc( 0/ 4): State length is 3473, there are 4002 groups
pnml2lts-mc( 0/ 4): Running ufscc using 4 cores
pnml2lts-mc( 0/ 4): Using a tree table with 2^30 elements
pnml2lts-mc( 0/ 4): Successor permutation: dynamic
pnml2lts-mc( 0/ 4): Global bits: 0, count bits: 0, local bits: 0
pnml2lts-mc( 0/ 4):
pnml2lts-mc( 0/ 4): total scc count: 1
pnml2lts-mc( 0/ 4): unique states count: 1
pnml2lts-mc( 0/ 4): unique transitions count: 0
pnml2lts-mc( 0/ 4): - self-loop count: 0
pnml2lts-mc( 0/ 4): - claim dead count: 0
pnml2lts-mc( 0/ 4): - claim found count: 0
pnml2lts-mc( 0/ 4): - claim success count: 4
pnml2lts-mc( 0/ 4): - cum. max stack depth: 4
pnml2lts-mc( 0/ 4):
pnml2lts-mc( 0/ 4): Explored 4 states 4 transitions, fanout: 1.000
pnml2lts-mc( 0/ 4): Total exploration time 0.010 sec (0.000 sec minimum, 0.002 sec on average)
pnml2lts-mc( 0/ 4): States per second: 400, Transitions per second: 400
pnml2lts-mc( 0/ 4):
pnml2lts-mc( 0/ 4): Queue width: 12B, total height: 0, memory: 0.00MB
pnml2lts-mc( 0/ 4): Tree memory: 0.0MB, 96.0 B/state, compr.: 0.7%
pnml2lts-mc( 0/ 4): Tree fill ratio (roots/leafs): 0.0%/0.0%
pnml2lts-mc( 0/ 4): Stored 4120 string chucks using 0MB
pnml2lts-mc( 0/ 4): Total memory used for chunk indexing: 0MB
pnml2lts-mc( 0/ 4): Est. total memory use: 0.0MB (~8192.0MB paged-in)
ltl formula name FlexibleBarrier-PT-16b-LTLCardinality-11
ltl formula formula --ltl=/tmp/ltl_11_
pnml2lts-mc( 0/ 4): Loading model from model.pnml
pnml2lts-mc( 0/ 4): Edge label is id
pnml2lts-mc( 0/ 4): Petri net has 3472 places, 4001 transitions and 10043 arcs
pnml2lts-mc( 0/ 4): Petri net FlexibleBarrier-PT-16b analyzed
pnml2lts-mc( 0/ 4): There are safe places
pnml2lts-mc( 0/ 4): Loading Petri net took 0.250 real 0.320 user 0.280 sys
pnml2lts-mc( 2/ 4): LTL layer: formula: /tmp/ltl_11_
pnml2lts-mc( 0/ 4): Weak Buchi automaton detected, adding non-accepting as progress label.
pnml2lts-mc( 0/ 4): There are 3474 state labels and 1 edge labels
pnml2lts-mc( 0/ 4): State length is 3473, there are 4003 groups
pnml2lts-mc( 0/ 4): Running ufscc using 4 cores
pnml2lts-mc( 0/ 4): Using a tree table with 2^30 elements
pnml2lts-mc( 0/ 4): Successor permutation: dynamic
pnml2lts-mc( 0/ 4): Global bits: 0, count bits: 0, local bits: 0
pnml2lts-mc( 2/ 4):
pnml2lts-mc( 2/ 4): Accepting cycle FOUND at depth ~104!
pnml2lts-mc( 2/ 4):
pnml2lts-mc( 0/ 4):
pnml2lts-mc( 0/ 4): total scc count: 0
pnml2lts-mc( 0/ 4): unique states count: 345
pnml2lts-mc( 0/ 4): unique transitions count: 3734
pnml2lts-mc( 0/ 4): - self-loop count: 1
pnml2lts-mc( 0/ 4): - claim dead count: 0
pnml2lts-mc( 0/ 4): - claim found count: 0
pnml2lts-mc( 0/ 4): - claim success count: 356
pnml2lts-mc( 0/ 4): - cum. max stack depth: 356
pnml2lts-mc( 0/ 4):
pnml2lts-mc( 0/ 4): Explored 356 states 3764 transitions, fanout: 10.573
pnml2lts-mc( 0/ 4): Total exploration time 0.170 sec (0.170 sec minimum, 0.170 sec on average)
pnml2lts-mc( 0/ 4): States per second: 2094, Transitions per second: 22141
pnml2lts-mc( 0/ 4):
pnml2lts-mc( 0/ 4): Queue width: 12B, total height: 0, memory: 0.00MB
pnml2lts-mc( 0/ 4): Tree memory: 0.1MB, 27.2 B/state, compr.: 0.2%
pnml2lts-mc( 0/ 4): Tree fill ratio (roots/leafs): 0.0%/0.0%
pnml2lts-mc( 0/ 4): Stored 4120 string chucks using 0MB
pnml2lts-mc( 0/ 4): Total memory used for chunk indexing: 0MB
pnml2lts-mc( 0/ 4): Est. total memory use: 0.1MB (~8192.0MB paged-in)
ltl formula name FlexibleBarrier-PT-16b-LTLCardinality-12
ltl formula formula --ltl=/tmp/ltl_12_
pnml2lts-mc( 0/ 4): Loading model from model.pnml
pnml2lts-mc( 0/ 4): Edge label is id
pnml2lts-mc( 0/ 4): Petri net has 3472 places, 4001 transitions and 10043 arcs
pnml2lts-mc( 0/ 4): Petri net FlexibleBarrier-PT-16b analyzed
pnml2lts-mc( 0/ 4): There are safe places
pnml2lts-mc( 0/ 4): Loading Petri net took 0.230 real 0.270 user 0.300 sys
pnml2lts-mc( 2/ 4): LTL layer: formula: /tmp/ltl_12_
pnml2lts-mc( 0/ 4): Weak Buchi automaton detected, adding non-accepting as progress label.
pnml2lts-mc( 0/ 4): There are 3474 state labels and 1 edge labels
pnml2lts-mc( 0/ 4): State length is 3473, there are 4003 groups
pnml2lts-mc( 0/ 4): Running ufscc using 4 cores
pnml2lts-mc( 0/ 4): Using a tree table with 2^30 elements
pnml2lts-mc( 0/ 4): Successor permutation: dynamic
pnml2lts-mc( 0/ 4): Global bits: 0, count bits: 0, local bits: 0
pnml2lts-mc( 0/ 4):
pnml2lts-mc( 0/ 4): total scc count: 2
pnml2lts-mc( 0/ 4): unique states count: 2
pnml2lts-mc( 0/ 4): unique transitions count: 1
pnml2lts-mc( 0/ 4): - self-loop count: 0
pnml2lts-mc( 0/ 4): - claim dead count: 0
pnml2lts-mc( 0/ 4): - claim found count: 0
pnml2lts-mc( 0/ 4): - claim success count: 7
pnml2lts-mc( 0/ 4): - cum. max stack depth: 7
pnml2lts-mc( 0/ 4):
pnml2lts-mc( 0/ 4): Explored 7 states 8 transitions, fanout: 1.143
pnml2lts-mc( 0/ 4): Total exploration time 0.000 sec (0.000 sec minimum, 0.000 sec on average)
pnml2lts-mc( 0/ 4): States per second: inf, Transitions per second: inf
pnml2lts-mc( 0/ 4):
pnml2lts-mc( 0/ 4): Queue width: 12B, total height: 0, memory: 0.00MB
pnml2lts-mc( 0/ 4): Tree memory: 0.0MB, 132.0 B/state, compr.: 1.0%
pnml2lts-mc( 0/ 4): Tree fill ratio (roots/leafs): 0.0%/0.0%
pnml2lts-mc( 0/ 4): Stored 4120 string chucks using 0MB
pnml2lts-mc( 0/ 4): Total memory used for chunk indexing: 0MB
pnml2lts-mc( 0/ 4): Est. total memory use: 0.0MB (~8192.0MB paged-in)
ltl formula name FlexibleBarrier-PT-16b-LTLCardinality-13
ltl formula formula --ltl=/tmp/ltl_13_
pnml2lts-mc( 0/ 4): Loading model from model.pnml
pnml2lts-mc( 0/ 4): Edge label is id
pnml2lts-mc( 0/ 4): Petri net has 3472 places, 4001 transitions and 10043 arcs
pnml2lts-mc( 0/ 4): Petri net FlexibleBarrier-PT-16b analyzed
pnml2lts-mc( 0/ 4): There are safe places
pnml2lts-mc( 0/ 4): Loading Petri net took 0.220 real 0.240 user 0.300 sys
pnml2lts-mc( 2/ 4): LTL layer: formula: /tmp/ltl_13_
pnml2lts-mc( 0/ 4): There are 3473 state labels and 1 edge labels
pnml2lts-mc( 0/ 4): State length is 3473, there are 4005 groups
pnml2lts-mc( 0/ 4): Running ufscc using 4 cores
pnml2lts-mc( 0/ 4): Using a tree table with 2^30 elements
pnml2lts-mc( 0/ 4): Successor permutation: dynamic
pnml2lts-mc( 0/ 4): Global bits: 0, count bits: 0, local bits: 0
pnml2lts-mc( 2/ 4):
pnml2lts-mc( 2/ 4): Accepting cycle FOUND at depth ~98!
pnml2lts-mc( 2/ 4):
pnml2lts-mc( 0/ 4):
pnml2lts-mc( 0/ 4): total scc count: 0
pnml2lts-mc( 0/ 4): unique states count: 314
pnml2lts-mc( 0/ 4): unique transitions count: 3044
pnml2lts-mc( 0/ 4): - self-loop count: 1
pnml2lts-mc( 0/ 4): - claim dead count: 0
pnml2lts-mc( 0/ 4): - claim found count: 0
pnml2lts-mc( 0/ 4): - claim success count: 327
pnml2lts-mc( 0/ 4): - cum. max stack depth: 327
pnml2lts-mc( 0/ 4):
pnml2lts-mc( 0/ 4): Explored 327 states 3078 transitions, fanout: 9.413
pnml2lts-mc( 0/ 4): Total exploration time 0.460 sec (0.450 sec minimum, 0.455 sec on average)
pnml2lts-mc( 0/ 4): States per second: 711, Transitions per second: 6691
pnml2lts-mc( 0/ 4):
pnml2lts-mc( 0/ 4): Queue width: 12B, total height: 0, memory: 0.00MB
pnml2lts-mc( 0/ 4): Tree memory: 0.1MB, 30.9 B/state, compr.: 0.2%
pnml2lts-mc( 0/ 4): Tree fill ratio (roots/leafs): 0.0%/0.0%
pnml2lts-mc( 0/ 4): Stored 4120 string chucks using 0MB
pnml2lts-mc( 0/ 4): Total memory used for chunk indexing: 0MB
pnml2lts-mc( 0/ 4): Est. total memory use: 0.1MB (~8192.0MB paged-in)
ltl formula name FlexibleBarrier-PT-16b-LTLCardinality-14
ltl formula formula --ltl=/tmp/ltl_14_
pnml2lts-mc( 0/ 4): Loading model from model.pnml
pnml2lts-mc( 0/ 4): Edge label is id
pnml2lts-mc( 0/ 4): Petri net has 3472 places, 4001 transitions and 10043 arcs
pnml2lts-mc( 0/ 4): Petri net FlexibleBarrier-PT-16b analyzed
pnml2lts-mc( 0/ 4): There are safe places
pnml2lts-mc( 0/ 4): Loading Petri net took 0.250 real 0.320 user 0.290 sys
pnml2lts-mc( 2/ 4): LTL layer: formula: /tmp/ltl_14_
pnml2lts-mc( 0/ 4): Weak Buchi automaton detected, adding non-accepting as progress label.
pnml2lts-mc( 0/ 4): There are 3474 state labels and 1 edge labels
pnml2lts-mc( 0/ 4): State length is 3473, there are 4004 groups
pnml2lts-mc( 0/ 4): Running ufscc using 4 cores
pnml2lts-mc( 0/ 4): Using a tree table with 2^30 elements
pnml2lts-mc( 0/ 4): Successor permutation: dynamic
pnml2lts-mc( 0/ 4): Global bits: 0, count bits: 0, local bits: 0
pnml2lts-mc( 2/ 4):
pnml2lts-mc( 2/ 4): Accepting cycle FOUND at depth ~78!
pnml2lts-mc( 2/ 4):
pnml2lts-mc( 0/ 4):
pnml2lts-mc( 0/ 4): total scc count: 0
pnml2lts-mc( 0/ 4): unique states count: 282
pnml2lts-mc( 0/ 4): unique transitions count: 2995
pnml2lts-mc( 0/ 4): - self-loop count: 0
pnml2lts-mc( 0/ 4): - claim dead count: 0
pnml2lts-mc( 0/ 4): - claim found count: 1
pnml2lts-mc( 0/ 4): - claim success count: 290
pnml2lts-mc( 0/ 4): - cum. max stack depth: 290
pnml2lts-mc( 0/ 4):
pnml2lts-mc( 0/ 4): Explored 290 states 3014 transitions, fanout: 10.393
pnml2lts-mc( 0/ 4): Total exploration time 0.150 sec (0.140 sec minimum, 0.143 sec on average)
pnml2lts-mc( 0/ 4): States per second: 1933, Transitions per second: 20093
pnml2lts-mc( 0/ 4):
pnml2lts-mc( 0/ 4): Queue width: 12B, total height: 0, memory: 0.00MB
pnml2lts-mc( 0/ 4): Tree memory: 0.1MB, 32.0 B/state, compr.: 0.2%
pnml2lts-mc( 0/ 4): Tree fill ratio (roots/leafs): 0.0%/0.0%
pnml2lts-mc( 0/ 4): Stored 4120 string chucks using 0MB
pnml2lts-mc( 0/ 4): Total memory used for chunk indexing: 0MB
pnml2lts-mc( 0/ 4): Est. total memory use: 0.1MB (~8192.0MB paged-in)
ltl formula name FlexibleBarrier-PT-16b-LTLCardinality-15
ltl formula formula --ltl=/tmp/ltl_15_
pnml2lts-mc( 0/ 4): Loading model from model.pnml
pnml2lts-mc( 0/ 4): Edge label is id
pnml2lts-mc( 0/ 4): Petri net has 3472 places, 4001 transitions and 10043 arcs
pnml2lts-mc( 0/ 4): Petri net FlexibleBarrier-PT-16b analyzed
pnml2lts-mc( 0/ 4): There are safe places
pnml2lts-mc( 0/ 4): Loading Petri net took 0.230 real 0.290 user 0.260 sys
pnml2lts-mc( 1/ 4): LTL layer: formula: /tmp/ltl_15_
pnml2lts-mc( 0/ 4): Weak Buchi automaton detected, adding non-accepting as progress label.
pnml2lts-mc( 0/ 4): There are 3474 state labels and 1 edge labels
pnml2lts-mc( 0/ 4): State length is 3473, there are 4003 groups
pnml2lts-mc( 0/ 4): Running ufscc using 4 cores
pnml2lts-mc( 0/ 4): Using a tree table with 2^30 elements
pnml2lts-mc( 0/ 4): Successor permutation: dynamic
pnml2lts-mc( 0/ 4): Global bits: 0, count bits: 0, local bits: 0
pnml2lts-mc( 3/ 4):
pnml2lts-mc( 3/ 4): Accepting cycle FOUND at depth ~64!
pnml2lts-mc( 3/ 4):
pnml2lts-mc( 0/ 4):
pnml2lts-mc( 0/ 4): total scc count: 0
pnml2lts-mc( 0/ 4): unique states count: 243
pnml2lts-mc( 0/ 4): unique transitions count: 2765
pnml2lts-mc( 0/ 4): - self-loop count: 0
pnml2lts-mc( 0/ 4): - claim dead count: 0
pnml2lts-mc( 0/ 4): - claim found count: 1
pnml2lts-mc( 0/ 4): - claim success count: 253
pnml2lts-mc( 0/ 4): - cum. max stack depth: 253
pnml2lts-mc( 0/ 4):
pnml2lts-mc( 0/ 4): Explored 253 states 2790 transitions, fanout: 11.028
pnml2lts-mc( 0/ 4): Total exploration time 0.120 sec (0.120 sec minimum, 0.120 sec on average)
pnml2lts-mc( 0/ 4): States per second: 2108, Transitions per second: 23250
pnml2lts-mc( 0/ 4):
pnml2lts-mc( 0/ 4): Queue width: 12B, total height: 0, memory: 0.00MB
pnml2lts-mc( 0/ 4): Tree memory: 0.1MB, 31.4 B/state, compr.: 0.2%
pnml2lts-mc( 0/ 4): Tree fill ratio (roots/leafs): 0.0%/0.0%
pnml2lts-mc( 0/ 4): Stored 4120 string chucks using 0MB
pnml2lts-mc( 0/ 4): Total memory used for chunk indexing: 0MB
pnml2lts-mc( 0/ 4): Est. total memory use: 0.1MB (~8192.0MB paged-in)
Sequence of Actions to be Executed by the VM
This is useful if one wants to reexecute the tool in the VM from the submitted image disk.
set -x
# this is for BenchKit: configuration of major elements for the test
export BK_INPUT="FlexibleBarrier-PT-16b"
export BK_EXAMINATION="LTLCardinality"
export BK_TOOL="ltsmin"
export BK_RESULT_DIR="/tmp/BK_RESULTS/OUTPUTS"
export BK_TIME_CONFINEMENT="3600"
export BK_MEMORY_CONFINEMENT="16384"
# this is specific to your benchmark or test
export BIN_DIR="$HOME/BenchKit/bin"
# remove the execution directoty if it exists (to avoid increse of .vmdk images)
if [ -d execution ] ; then
rm -rf execution
fi
tar xzf /home/mcc/BenchKit/INPUTS/FlexibleBarrier-PT-16b.tgz
mv FlexibleBarrier-PT-16b execution
cd execution
pwd
ls -lh
# this is for BenchKit: explicit launching of the test
echo "====================================================================="
echo " Generated by BenchKit 2-3637"
echo " Executing tool ltsmin"
echo " Input is FlexibleBarrier-PT-16b, examination is LTLCardinality"
echo " Time confinement is $BK_TIME_CONFINEMENT seconds"
echo " Memory confinement is 16384 MBytes"
echo " Number of cores is 4"
echo " Run identifier is r245-blw7-152732547600055"
echo "====================================================================="
echo
echo "--------------------"
echo "content from stdout:"
echo
echo "=== Data for post analysis generated by BenchKit (invocation template)"
echo
if [ "LTLCardinality" = "UpperBounds" ] ; then
echo "The expected result is a vector of positive values"
echo NUM_VECTOR
elif [ "LTLCardinality" != "StateSpace" ] ; then
echo "The expected result is a vector of booleans"
echo BOOL_VECTOR
else
echo "no data necessary for post analysis"
fi
echo
if [ -f "LTLCardinality.txt" ] ; then
echo "here is the order used to build the result vector(from text file)"
for x in $(grep Property LTLCardinality.txt | cut -d ' ' -f 2 | sort -u) ; do
echo "FORMULA_NAME $x"
done
elif [ -f "LTLCardinality.xml" ] ; then # for cunf (txt files deleted;-)
echo echo "here is the order used to build the result vector(from xml file)"
for x in $(grep '
echo "FORMULA_NAME $x"
done
fi
echo
echo "=== Now, execution of the tool begins"
echo
echo -n "BK_START "
date -u +%s%3N
echo
timeout -s 9 $BK_TIME_CONFINEMENT bash -c "/home/mcc/BenchKit/BenchKit_head.sh 2> STDERR ; echo ; echo -n \"BK_STOP \" ; date -u +%s%3N"
if [ $? -eq 137 ] ; then
echo
echo "BK_TIME_CONFINEMENT_REACHED"
fi
echo
echo "--------------------"
echo "content from stderr:"
echo
cat STDERR ;