

About the Execution of LTSMin for DatabaseWithMutex-PT-10
| Execution Summary | |||||
| Max Memory Used (MB) |
Time wait (ms) | CPU Usage (ms) | I/O Wait (ms) | Computed Result | Execution Status |
| 15918.800 | 1488052.00 | 2581685.00 | 1430.00 | ?T?F?F??FFT?F?T? | normal |
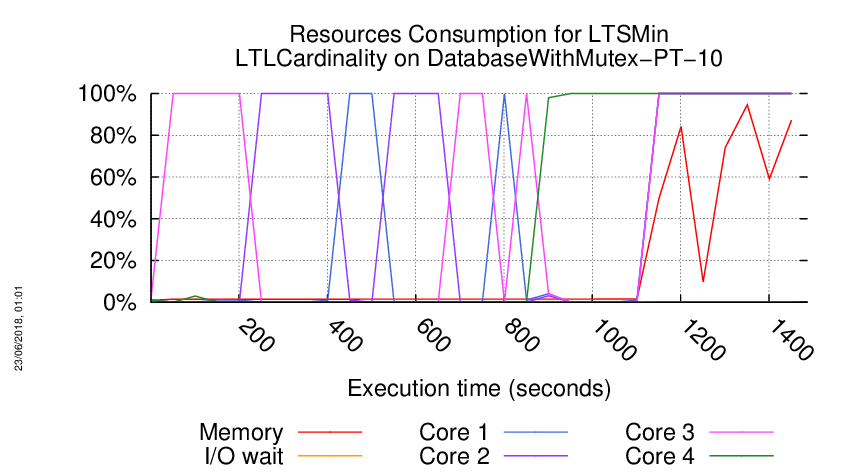
Execution Chart
We display below the execution chart for this examination (boot time has been removed).
Trace from the execution
Waiting for the VM to be ready (probing ssh)
.................
/home/mcc/execution
total 2.0M
-rw-r--r-- 1 mcc users 58K May 15 18:54 CTLCardinality.txt
-rw-r--r-- 1 mcc users 175K May 15 18:54 CTLCardinality.xml
-rw-r--r-- 1 mcc users 50K May 15 18:54 CTLFireability.txt
-rw-r--r-- 1 mcc users 188K May 15 18:54 CTLFireability.xml
-rw-r--r-- 1 mcc users 4.0K May 15 18:50 GenericPropertiesDefinition.xml
-rw-r--r-- 1 mcc users 6.3K May 15 18:50 GenericPropertiesVerdict.xml
-rw-r--r-- 1 mcc users 21K May 26 09:26 LTLCardinality.txt
-rw-r--r-- 1 mcc users 65K May 26 09:26 LTLCardinality.xml
-rw-r--r-- 1 mcc users 21K May 26 09:26 LTLFireability.txt
-rw-r--r-- 1 mcc users 72K May 26 09:26 LTLFireability.xml
-rw-r--r-- 1 mcc users 53K May 15 18:54 ReachabilityCardinality.txt
-rw-r--r-- 1 mcc users 158K May 15 18:54 ReachabilityCardinality.xml
-rw-r--r-- 1 mcc users 114 May 15 18:54 ReachabilityDeadlock.txt
-rw-r--r-- 1 mcc users 352 May 15 18:54 ReachabilityDeadlock.xml
-rw-r--r-- 1 mcc users 50K May 15 18:54 ReachabilityFireability.txt
-rw-r--r-- 1 mcc users 191K May 15 18:54 ReachabilityFireability.xml
-rw-r--r-- 1 mcc users 11K May 15 18:54 UpperBounds.txt
-rw-r--r-- 1 mcc users 23K May 15 18:54 UpperBounds.xml
-rw-r--r-- 1 mcc users 5 May 15 18:50 equiv_col
-rw-r--r-- 1 mcc users 3 May 15 18:50 instance
-rw-r--r-- 1 mcc users 6 May 15 18:50 iscolored
-rw-r--r-- 1 mcc users 816K May 15 18:50 model.pnml
=====================================================================
Generated by BenchKit 2-3637
Executing tool ltsmin
Input is DatabaseWithMutex-PT-10, examination is LTLCardinality
Time confinement is 3600 seconds
Memory confinement is 16384 MBytes
Number of cores is 4
Run identifier is r233-blw3-152732474800015
=====================================================================
--------------------
content from stdout:
=== Data for post analysis generated by BenchKit (invocation template)
The expected result is a vector of booleans
BOOL_VECTOR
here is the order used to build the result vector(from text file)
FORMULA_NAME DatabaseWithMutex-PT-10-LTLCardinality-00
FORMULA_NAME DatabaseWithMutex-PT-10-LTLCardinality-01
FORMULA_NAME DatabaseWithMutex-PT-10-LTLCardinality-02
FORMULA_NAME DatabaseWithMutex-PT-10-LTLCardinality-03
FORMULA_NAME DatabaseWithMutex-PT-10-LTLCardinality-04
FORMULA_NAME DatabaseWithMutex-PT-10-LTLCardinality-05
FORMULA_NAME DatabaseWithMutex-PT-10-LTLCardinality-06
FORMULA_NAME DatabaseWithMutex-PT-10-LTLCardinality-07
FORMULA_NAME DatabaseWithMutex-PT-10-LTLCardinality-08
FORMULA_NAME DatabaseWithMutex-PT-10-LTLCardinality-09
FORMULA_NAME DatabaseWithMutex-PT-10-LTLCardinality-10
FORMULA_NAME DatabaseWithMutex-PT-10-LTLCardinality-11
FORMULA_NAME DatabaseWithMutex-PT-10-LTLCardinality-12
FORMULA_NAME DatabaseWithMutex-PT-10-LTLCardinality-13
FORMULA_NAME DatabaseWithMutex-PT-10-LTLCardinality-14
FORMULA_NAME DatabaseWithMutex-PT-10-LTLCardinality-15
=== Now, execution of the tool begins
BK_START 1527891649787
FORMULA DatabaseWithMutex-PT-10-LTLCardinality-00 CANNOT_COMPUTE
FORMULA DatabaseWithMutex-PT-10-LTLCardinality-01 TRUE TECHNIQUES EXPLICIT PARALLEL_PROCESSING USE_NUPN
FORMULA DatabaseWithMutex-PT-10-LTLCardinality-02 CANNOT_COMPUTE
FORMULA DatabaseWithMutex-PT-10-LTLCardinality-03 FALSE TECHNIQUES EXPLICIT PARALLEL_PROCESSING USE_NUPN
FORMULA DatabaseWithMutex-PT-10-LTLCardinality-04 CANNOT_COMPUTE
FORMULA DatabaseWithMutex-PT-10-LTLCardinality-05 FALSE TECHNIQUES EXPLICIT PARALLEL_PROCESSING USE_NUPN
FORMULA DatabaseWithMutex-PT-10-LTLCardinality-06 CANNOT_COMPUTE
FORMULA DatabaseWithMutex-PT-10-LTLCardinality-07 CANNOT_COMPUTE
FORMULA DatabaseWithMutex-PT-10-LTLCardinality-08 FALSE TECHNIQUES EXPLICIT PARALLEL_PROCESSING USE_NUPN
FORMULA DatabaseWithMutex-PT-10-LTLCardinality-09 FALSE TECHNIQUES EXPLICIT PARALLEL_PROCESSING USE_NUPN
FORMULA DatabaseWithMutex-PT-10-LTLCardinality-10 TRUE TECHNIQUES EXPLICIT PARALLEL_PROCESSING USE_NUPN
FORMULA DatabaseWithMutex-PT-10-LTLCardinality-11 CANNOT_COMPUTE
FORMULA DatabaseWithMutex-PT-10-LTLCardinality-12 FALSE TECHNIQUES EXPLICIT PARALLEL_PROCESSING USE_NUPN
FORMULA DatabaseWithMutex-PT-10-LTLCardinality-13 CANNOT_COMPUTE
FORMULA DatabaseWithMutex-PT-10-LTLCardinality-14 TRUE TECHNIQUES EXPLICIT PARALLEL_PROCESSING USE_NUPN
FORMULA DatabaseWithMutex-PT-10-LTLCardinality-15 CANNOT_COMPUTE
BK_STOP 1527893137839
--------------------
content from stderr:
mcc2018
ltl formula name DatabaseWithMutex-PT-10-LTLCardinality-00
ltl formula formula --ltl=/tmp/ltl_0_
pnml2lts-mc( 0/ 4): Loading model from model.pnml
pnml2lts-mc( 0/ 4): Edge label is id
pnml2lts-mc( 0/ 4): Petri net has 830 places, 800 transitions and 3800 arcs
pnml2lts-mc( 0/ 4): Petri net DatabaseWithMutex-PT-10 analyzed
pnml2lts-mc( 1/ 4): LTL layer: formula: /tmp/ltl_0_
pnml2lts-mc( 0/ 4): There are no safe places
pnml2lts-mc( 0/ 4): Loading Petri net took 0.230 real 0.080 user 0.400 sys
ltl formula name DatabaseWithMutex-PT-10-LTLCardinality-01
ltl formula formula --ltl=/tmp/ltl_1_
pnml2lts-mc( 0/ 4): Loading model from model.pnml
pnml2lts-mc( 0/ 4): Edge label is id
pnml2lts-mc( 0/ 4): Petri net has 830 places, 800 transitions and 3800 arcs
pnml2lts-mc( 0/ 4): Petri net DatabaseWithMutex-PT-10 analyzed
pnml2lts-mc( 0/ 4): There are no safe places
pnml2lts-mc( 2/ 4): LTL layer: formula: /tmp/ltl_1_
pnml2lts-mc( 0/ 4): Loading Petri net took 0.240 real 0.050 user 0.430 sys
pnml2lts-mc( 0/ 4): Weak Buchi automaton detected, adding non-accepting as progress label.
pnml2lts-mc( 0/ 4): There are 832 state labels and 1 edge labels
pnml2lts-mc( 0/ 4): State length is 831, there are 802 groups
pnml2lts-mc( 0/ 4): Running ufscc using 4 cores
pnml2lts-mc( 0/ 4): Using a tree table with 2^30 elements
pnml2lts-mc( 0/ 4): Successor permutation: dynamic
pnml2lts-mc( 0/ 4): Global bits: 0, count bits: 0, local bits: 0
pnml2lts-mc( 0/ 4):
pnml2lts-mc( 0/ 4): total scc count: 1
pnml2lts-mc( 0/ 4): unique states count: 1
pnml2lts-mc( 0/ 4): unique transitions count: 0
pnml2lts-mc( 0/ 4): - self-loop count: 0
pnml2lts-mc( 0/ 4): - claim dead count: 0
pnml2lts-mc( 0/ 4): - claim found count: 0
pnml2lts-mc( 0/ 4): - claim success count: 4
pnml2lts-mc( 0/ 4): - cum. max stack depth: 4
pnml2lts-mc( 0/ 4):
pnml2lts-mc( 0/ 4): Explored 4 states 4 transitions, fanout: 1.000
pnml2lts-mc( 0/ 4): Total exploration time 0.020 sec (0.010 sec minimum, 0.017 sec on average)
pnml2lts-mc( 0/ 4): States per second: 200, Transitions per second: 200
pnml2lts-mc( 0/ 4):
pnml2lts-mc( 0/ 4): Queue width: 12B, total height: 0, memory: 0.00MB
pnml2lts-mc( 0/ 4): Tree memory: 0.0MB, 624.0 B/state, compr.: 18.8%
pnml2lts-mc( 0/ 4): Tree fill ratio (roots/leafs): 0.0%/0.0%
pnml2lts-mc( 0/ 4): Stored 809 string chucks using 0MB
pnml2lts-mc( 0/ 4): Total memory used for chunk indexing: 0MB
pnml2lts-mc( 0/ 4): Est. total memory use: 0.0MB (~8192.0MB paged-in)
ltl formula name DatabaseWithMutex-PT-10-LTLCardinality-02
ltl formula formula --ltl=/tmp/ltl_2_
pnml2lts-mc( 0/ 4): Loading model from model.pnml
pnml2lts-mc( 0/ 4): Edge label is id
pnml2lts-mc( 0/ 4): Petri net has 830 places, 800 transitions and 3800 arcs
pnml2lts-mc( 0/ 4): Petri net DatabaseWithMutex-PT-10 analyzed
pnml2lts-mc( 0/ 4): There are no safe places
pnml2lts-mc( 1/ 4): LTL layer: formula: /tmp/ltl_2_
pnml2lts-mc( 0/ 4): Loading Petri net took 0.220 real 0.080 user 0.400 sys
ltl formula name DatabaseWithMutex-PT-10-LTLCardinality-03
ltl formula formula --ltl=/tmp/ltl_3_
pnml2lts-mc( 0/ 4): Loading model from model.pnml
pnml2lts-mc( 0/ 4): Edge label is id
pnml2lts-mc( 0/ 4): Petri net has 830 places, 800 transitions and 3800 arcs
pnml2lts-mc( 0/ 4): Petri net DatabaseWithMutex-PT-10 analyzed
pnml2lts-mc( 0/ 4): There are no safe places
pnml2lts-mc( 2/ 4): LTL layer: formula: /tmp/ltl_3_
pnml2lts-mc( 0/ 4): Loading Petri net took 0.250 real 0.050 user 0.470 sys
pnml2lts-mc( 0/ 4): Weak Buchi automaton detected, adding non-accepting as progress label.
pnml2lts-mc( 0/ 4): There are 832 state labels and 1 edge labels
pnml2lts-mc( 0/ 4): State length is 831, there are 801 groups
pnml2lts-mc( 0/ 4): Running ufscc using 4 cores
pnml2lts-mc( 0/ 4): Using a tree table with 2^30 elements
pnml2lts-mc( 0/ 4): Successor permutation: dynamic
pnml2lts-mc( 0/ 4): Global bits: 0, count bits: 0, local bits: 0
pnml2lts-mc( 0/ 4):
pnml2lts-mc( 0/ 4): Accepting cycle FOUND at depth ~227!
pnml2lts-mc( 0/ 4):
pnml2lts-mc( 0/ 4):
pnml2lts-mc( 0/ 4): total scc count: 309
pnml2lts-mc( 0/ 4): unique states count: 956
pnml2lts-mc( 0/ 4): unique transitions count: 15353
pnml2lts-mc( 0/ 4): - self-loop count: 0
pnml2lts-mc( 0/ 4): - claim dead count: 0
pnml2lts-mc( 0/ 4): - claim found count: 1
pnml2lts-mc( 0/ 4): - claim success count: 959
pnml2lts-mc( 0/ 4): - cum. max stack depth: 650
pnml2lts-mc( 0/ 4):
pnml2lts-mc( 0/ 4): Explored 959 states 15657 transitions, fanout: 16.326
pnml2lts-mc( 0/ 4): Total exploration time 0.360 sec (0.350 sec minimum, 0.358 sec on average)
pnml2lts-mc( 0/ 4): States per second: 2664, Transitions per second: 43492
pnml2lts-mc( 0/ 4):
pnml2lts-mc( 0/ 4): Queue width: 12B, total height: 0, memory: 0.00MB
pnml2lts-mc( 0/ 4): Tree memory: 0.5MB, 33.0 B/state, compr.: 1.0%
pnml2lts-mc( 0/ 4): Tree fill ratio (roots/leafs): 0.0%/0.0%
pnml2lts-mc( 0/ 4): Stored 809 string chucks using 0MB
pnml2lts-mc( 0/ 4): Total memory used for chunk indexing: 0MB
pnml2lts-mc( 0/ 4): Est. total memory use: 0.5MB (~8192.0MB paged-in)
ltl formula name DatabaseWithMutex-PT-10-LTLCardinality-04
ltl formula formula --ltl=/tmp/ltl_4_
pnml2lts-mc( 0/ 4): Loading model from model.pnml
pnml2lts-mc( 0/ 4): Edge label is id
pnml2lts-mc( 0/ 4): Petri net has 830 places, 800 transitions and 3800 arcs
pnml2lts-mc( 0/ 4): Petri net DatabaseWithMutex-PT-10 analyzed
pnml2lts-mc( 0/ 4): There are no safe places
pnml2lts-mc( 0/ 4): Loading Petri net took 0.050 real 0.060 user 0.060 sys
pnml2lts-mc( 1/ 4): LTL layer: formula: /tmp/ltl_4_
ltl formula name DatabaseWithMutex-PT-10-LTLCardinality-05
ltl formula formula --ltl=/tmp/ltl_5_
pnml2lts-mc( 0/ 4): Loading model from model.pnml
pnml2lts-mc( 0/ 4): Edge label is id
pnml2lts-mc( 0/ 4): Petri net has 830 places, 800 transitions and 3800 arcs
pnml2lts-mc( 0/ 4): Petri net DatabaseWithMutex-PT-10 analyzed
pnml2lts-mc( 1/ 4): LTL layer: formula: /tmp/ltl_5_
pnml2lts-mc( 0/ 4): There are no safe places
pnml2lts-mc( 0/ 4): Loading Petri net took 0.260 real 0.110 user 0.420 sys
pnml2lts-mc( 0/ 4): There are 831 state labels and 1 edge labels
pnml2lts-mc( 0/ 4): State length is 831, there are 804 groups
pnml2lts-mc( 0/ 4): Running ufscc using 4 cores
pnml2lts-mc( 0/ 4): Using a tree table with 2^30 elements
pnml2lts-mc( 0/ 4): Successor permutation: dynamic
pnml2lts-mc( 0/ 4): Global bits: 0, count bits: 0, local bits: 0
pnml2lts-mc( 1/ 4): ~2500 levels ~10000 states ~144652 transitions
pnml2lts-mc( 3/ 4): ~5000 levels ~20000 states ~271596 transitions
pnml2lts-mc( 3/ 4): ~10000 levels ~40000 states ~539496 transitions
pnml2lts-mc( 1/ 4):
pnml2lts-mc( 1/ 4): Accepting cycle FOUND at depth ~10978!
pnml2lts-mc( 1/ 4):
pnml2lts-mc( 0/ 4):
pnml2lts-mc( 0/ 4): total scc count: 0
pnml2lts-mc( 0/ 4): unique states count: 43259
pnml2lts-mc( 0/ 4): unique transitions count: 604413
pnml2lts-mc( 0/ 4): - self-loop count: 0
pnml2lts-mc( 0/ 4): - claim dead count: 0
pnml2lts-mc( 0/ 4): - claim found count: 40806
pnml2lts-mc( 0/ 4): - claim success count: 43262
pnml2lts-mc( 0/ 4): - cum. max stack depth: 43262
pnml2lts-mc( 0/ 4):
pnml2lts-mc( 0/ 4): Explored 43262 states 604717 transitions, fanout: 13.978
pnml2lts-mc( 0/ 4): Total exploration time 4.500 sec (4.490 sec minimum, 4.497 sec on average)
pnml2lts-mc( 0/ 4): States per second: 9614, Transitions per second: 134382
pnml2lts-mc( 0/ 4):
pnml2lts-mc( 0/ 4): Queue width: 12B, total height: 0, memory: 0.00MB
pnml2lts-mc( 0/ 4): Tree memory: 9.5MB, 17.8 B/state, compr.: 0.5%
pnml2lts-mc( 0/ 4): Tree fill ratio (roots/leafs): 0.0%/0.0%
pnml2lts-mc( 0/ 4): Stored 809 string chucks using 0MB
pnml2lts-mc( 0/ 4): Total memory used for chunk indexing: 0MB
pnml2lts-mc( 0/ 4): Est. total memory use: 9.5MB (~8192.0MB paged-in)
ltl formula name DatabaseWithMutex-PT-10-LTLCardinality-06
ltl formula formula --ltl=/tmp/ltl_6_
pnml2lts-mc( 0/ 4): Loading model from model.pnml
pnml2lts-mc( 0/ 4): Edge label is id
pnml2lts-mc( 0/ 4): Petri net has 830 places, 800 transitions and 3800 arcs
pnml2lts-mc( 0/ 4): Petri net DatabaseWithMutex-PT-10 analyzed
pnml2lts-mc( 0/ 4): There are no safe places
pnml2lts-mc( 0/ 4): Loading Petri net took 0.080 real 0.050 user 0.070 sys
pnml2lts-mc( 3/ 4): LTL layer: formula: /tmp/ltl_6_
ltl formula name DatabaseWithMutex-PT-10-LTLCardinality-07
ltl formula formula --ltl=/tmp/ltl_7_
pnml2lts-mc( 0/ 4): Loading model from model.pnml
pnml2lts-mc( 0/ 4): Edge label is id
pnml2lts-mc( 0/ 4): Petri net has 830 places, 800 transitions and 3800 arcs
pnml2lts-mc( 0/ 4): Petri net DatabaseWithMutex-PT-10 analyzed
pnml2lts-mc( 0/ 4): There are no safe places
pnml2lts-mc( 0/ 4): Loading Petri net took 0.240 real 0.070 user 0.400 sys
pnml2lts-mc( 2/ 4): LTL layer: formula: /tmp/ltl_7_
ltl formula name DatabaseWithMutex-PT-10-LTLCardinality-08
ltl formula formula --ltl=/tmp/ltl_8_
pnml2lts-mc( 0/ 4): Loading model from model.pnml
pnml2lts-mc( 0/ 4): Edge label is id
pnml2lts-mc( 0/ 4): Petri net has 830 places, 800 transitions and 3800 arcs
pnml2lts-mc( 0/ 4): Petri net DatabaseWithMutex-PT-10 analyzed
pnml2lts-mc( 0/ 4): There are no safe places
pnml2lts-mc( 0/ 4): Loading Petri net took 0.220 real 0.060 user 0.480 sys
pnml2lts-mc( 0/ 4): LTL layer: formula: /tmp/ltl_8_
pnml2lts-mc( 0/ 4): buchi has 2 states
pnml2lts-mc( 0/ 4): Weak Buchi automaton detected, adding non-accepting as progress label.
pnml2lts-mc( 0/ 4): There are 832 state labels and 1 edge labels
pnml2lts-mc( 0/ 4): State length is 831, there are 803 groups
pnml2lts-mc( 0/ 4): Running ufscc using 4 cores
pnml2lts-mc( 0/ 4): Using a tree table with 2^30 elements
pnml2lts-mc( 0/ 4): Successor permutation: dynamic
pnml2lts-mc( 0/ 4): Global bits: 0, count bits: 0, local bits: 0
pnml2lts-mc( 2/ 4):
pnml2lts-mc( 2/ 4): Accepting cycle FOUND at depth ~411!
pnml2lts-mc( 2/ 4):
pnml2lts-mc( 0/ 4):
pnml2lts-mc( 0/ 4): total scc count: 0
pnml2lts-mc( 0/ 4): unique states count: 1427
pnml2lts-mc( 0/ 4): unique transitions count: 36085
pnml2lts-mc( 0/ 4): - self-loop count: 0
pnml2lts-mc( 0/ 4): - claim dead count: 0
pnml2lts-mc( 0/ 4): - claim found count: 2
pnml2lts-mc( 0/ 4): - claim success count: 1430
pnml2lts-mc( 0/ 4): - cum. max stack depth: 1430
pnml2lts-mc( 0/ 4):
pnml2lts-mc( 0/ 4): Explored 1430 states 36389 transitions, fanout: 25.447
pnml2lts-mc( 0/ 4): Total exploration time 0.900 sec (0.890 sec minimum, 0.898 sec on average)
pnml2lts-mc( 0/ 4): States per second: 1589, Transitions per second: 40432
pnml2lts-mc( 0/ 4):
pnml2lts-mc( 0/ 4): Queue width: 12B, total height: 0, memory: 0.00MB
pnml2lts-mc( 0/ 4): Tree memory: 1.0MB, 28.3 B/state, compr.: 0.9%
pnml2lts-mc( 0/ 4): Tree fill ratio (roots/leafs): 0.0%/0.0%
pnml2lts-mc( 0/ 4): Stored 809 string chucks using 0MB
pnml2lts-mc( 0/ 4): Total memory used for chunk indexing: 0MB
pnml2lts-mc( 0/ 4): Est. total memory use: 1.0MB (~8192.0MB paged-in)
ltl formula name DatabaseWithMutex-PT-10-LTLCardinality-09
ltl formula formula --ltl=/tmp/ltl_9_
pnml2lts-mc( 0/ 4): Loading model from model.pnml
pnml2lts-mc( 0/ 4): Edge label is id
pnml2lts-mc( 0/ 4): Petri net has 830 places, 800 transitions and 3800 arcs
pnml2lts-mc( 0/ 4): Petri net DatabaseWithMutex-PT-10 analyzed
pnml2lts-mc( 0/ 4): There are no safe places
pnml2lts-mc( 0/ 4): Loading Petri net took 0.190 real 0.050 user 0.290 sys
pnml2lts-mc( 0/ 4): LTL layer: formula: /tmp/ltl_9_
pnml2lts-mc( 0/ 4): buchi has 3 states
pnml2lts-mc( 0/ 4): Weak Buchi automaton detected, adding non-accepting as progress label.
pnml2lts-mc( 0/ 4): There are 832 state labels and 1 edge labels
pnml2lts-mc( 0/ 4): State length is 831, there are 804 groups
pnml2lts-mc( 0/ 4): Running ufscc using 4 cores
pnml2lts-mc( 0/ 4): Using a tree table with 2^30 elements
pnml2lts-mc( 0/ 4): Successor permutation: dynamic
pnml2lts-mc( 0/ 4): Global bits: 0, count bits: 0, local bits: 0
pnml2lts-mc( 2/ 4):
pnml2lts-mc( 2/ 4): Accepting cycle FOUND at depth ~333!
pnml2lts-mc( 2/ 4):
pnml2lts-mc( 0/ 4):
pnml2lts-mc( 0/ 4): total scc count: 0
pnml2lts-mc( 0/ 4): unique states count: 963
pnml2lts-mc( 0/ 4): unique transitions count: 17024
pnml2lts-mc( 0/ 4): - self-loop count: 0
pnml2lts-mc( 0/ 4): - claim dead count: 0
pnml2lts-mc( 0/ 4): - claim found count: 5
pnml2lts-mc( 0/ 4): - claim success count: 966
pnml2lts-mc( 0/ 4): - cum. max stack depth: 966
pnml2lts-mc( 0/ 4):
pnml2lts-mc( 0/ 4): Explored 966 states 17328 transitions, fanout: 17.938
pnml2lts-mc( 0/ 4): Total exploration time 0.470 sec (0.450 sec minimum, 0.465 sec on average)
pnml2lts-mc( 0/ 4): States per second: 2055, Transitions per second: 36868
pnml2lts-mc( 0/ 4):
pnml2lts-mc( 0/ 4): Queue width: 12B, total height: 0, memory: 0.00MB
pnml2lts-mc( 0/ 4): Tree memory: 0.5MB, 32.9 B/state, compr.: 1.0%
pnml2lts-mc( 0/ 4): Tree fill ratio (roots/leafs): 0.0%/0.0%
pnml2lts-mc( 0/ 4): Stored 809 string chucks using 0MB
pnml2lts-mc( 0/ 4): Total memory used for chunk indexing: 0MB
pnml2lts-mc( 0/ 4): Est. total memory use: 0.5MB (~8192.0MB paged-in)
ltl formula name DatabaseWithMutex-PT-10-LTLCardinality-10
ltl formula formula --ltl=/tmp/ltl_10_
pnml2lts-mc( 0/ 4): Loading model from model.pnml
pnml2lts-mc( 0/ 4): Edge label is id
pnml2lts-mc( 0/ 4): Petri net has 830 places, 800 transitions and 3800 arcs
pnml2lts-mc( 0/ 4): Petri net DatabaseWithMutex-PT-10 analyzed
pnml2lts-mc( 0/ 4): There are no safe places
pnml2lts-mc( 2/ 4): LTL layer: formula: /tmp/ltl_10_
pnml2lts-mc( 0/ 4): Loading Petri net took 0.280 real 0.060 user 0.540 sys
pnml2lts-mc( 0/ 4): Weak Buchi automaton detected, adding non-accepting as progress label.
pnml2lts-mc( 0/ 4): There are 832 state labels and 1 edge labels
pnml2lts-mc( 0/ 4): State length is 831, there are 802 groups
pnml2lts-mc( 0/ 4): Running ufscc using 4 cores
pnml2lts-mc( 0/ 4): Using a tree table with 2^30 elements
pnml2lts-mc( 0/ 4): Successor permutation: dynamic
pnml2lts-mc( 0/ 4): Global bits: 0, count bits: 0, local bits: 0
pnml2lts-mc( 0/ 4):
pnml2lts-mc( 0/ 4): total scc count: 1
pnml2lts-mc( 0/ 4): unique states count: 1
pnml2lts-mc( 0/ 4): unique transitions count: 0
pnml2lts-mc( 0/ 4): - self-loop count: 0
pnml2lts-mc( 0/ 4): - claim dead count: 0
pnml2lts-mc( 0/ 4): - claim found count: 0
pnml2lts-mc( 0/ 4): - claim success count: 4
pnml2lts-mc( 0/ 4): - cum. max stack depth: 4
pnml2lts-mc( 0/ 4):
pnml2lts-mc( 0/ 4): Explored 4 states 4 transitions, fanout: 1.000
pnml2lts-mc( 0/ 4): Total exploration time 0.020 sec (0.000 sec minimum, 0.015 sec on average)
pnml2lts-mc( 0/ 4): States per second: 200, Transitions per second: 200
pnml2lts-mc( 0/ 4):
pnml2lts-mc( 0/ 4): Queue width: 12B, total height: 0, memory: 0.00MB
pnml2lts-mc( 0/ 4): Tree memory: 0.0MB, 624.0 B/state, compr.: 18.8%
pnml2lts-mc( 0/ 4): Tree fill ratio (roots/leafs): 0.0%/0.0%
pnml2lts-mc( 0/ 4): Stored 809 string chucks using 0MB
pnml2lts-mc( 0/ 4): Total memory used for chunk indexing: 0MB
pnml2lts-mc( 0/ 4): Est. total memory use: 0.0MB (~8192.0MB paged-in)
ltl formula name DatabaseWithMutex-PT-10-LTLCardinality-11
ltl formula formula --ltl=/tmp/ltl_11_
pnml2lts-mc( 0/ 4): Loading model from model.pnml
pnml2lts-mc( 0/ 4): Edge label is id
pnml2lts-mc( 0/ 4): Petri net has 830 places, 800 transitions and 3800 arcs
pnml2lts-mc( 0/ 4): Petri net DatabaseWithMutex-PT-10 analyzed
pnml2lts-mc( 0/ 4): There are no safe places
pnml2lts-mc( 2/ 4): LTL layer: formula: /tmp/ltl_11_
pnml2lts-mc( 0/ 4): Loading Petri net took 0.320 real 0.040 user 0.660 sys
pnml2lts-mc( 0/ 4): There are 831 state labels and 1 edge labels
pnml2lts-mc( 0/ 4): State length is 831, there are 810 groups
pnml2lts-mc( 0/ 4): Running ufscc using 4 cores
pnml2lts-mc( 0/ 4): Using a tree table with 2^30 elements
pnml2lts-mc( 0/ 4): Successor permutation: dynamic
pnml2lts-mc( 0/ 4): Global bits: 0, count bits: 0, local bits: 0
pnml2lts-mc( 1/ 4): ~2500 levels ~10000 states ~99460 transitions
pnml2lts-mc( 1/ 4): ~5000 levels ~20000 states ~202364 transitions
pnml2lts-mc( 1/ 4): ~10000 levels ~40000 states ~414608 transitions
pnml2lts-mc( 1/ 4): ~19847 levels ~80000 states ~841808 transitions
pnml2lts-mc( 2/ 4): ~39740 levels ~160000 states ~1756516 transitions
pnml2lts-mc( 2/ 4): ~78952 levels ~320000 states ~3615560 transitions
pnml2lts-mc( 2/ 4): ~151427 levels ~640000 states ~8147980 transitions
pnml2lts-mc( 3/ 4): ~319894 levels ~1280000 states ~17714476 transitions
ltl formula name DatabaseWithMutex-PT-10-LTLCardinality-12
ltl formula formula --ltl=/tmp/ltl_12_
pnml2lts-mc( 0/ 4): Loading model from model.pnml
pnml2lts-mc( 0/ 4): Edge label is id
pnml2lts-mc( 0/ 4): Petri net has 830 places, 800 transitions and 3800 arcs
pnml2lts-mc( 0/ 4): Petri net DatabaseWithMutex-PT-10 analyzed
pnml2lts-mc( 0/ 4): There are no safe places
pnml2lts-mc( 2/ 4): LTL layer: formula: /tmp/ltl_12_
pnml2lts-mc( 0/ 4): Loading Petri net took 0.330 real 0.070 user 0.570 sys
pnml2lts-mc( 0/ 4): Weak Buchi automaton detected, adding non-accepting as progress label.
pnml2lts-mc( 0/ 4): There are 832 state labels and 1 edge labels
pnml2lts-mc( 0/ 4): State length is 831, there are 803 groups
pnml2lts-mc( 0/ 4): Running ufscc using 4 cores
pnml2lts-mc( 0/ 4): Using a tree table with 2^30 elements
pnml2lts-mc( 0/ 4): Successor permutation: dynamic
pnml2lts-mc( 0/ 4): Global bits: 0, count bits: 0, local bits: 0
pnml2lts-mc( 0/ 4):
pnml2lts-mc( 0/ 4): Accepting cycle FOUND at depth ~346!
pnml2lts-mc( 0/ 4):
pnml2lts-mc( 0/ 4):
pnml2lts-mc( 0/ 4): total scc count: 0
pnml2lts-mc( 0/ 4): unique states count: 1910
pnml2lts-mc( 0/ 4): unique transitions count: 28044
pnml2lts-mc( 0/ 4): - self-loop count: 0
pnml2lts-mc( 0/ 4): - claim dead count: 0
pnml2lts-mc( 0/ 4): - claim found count: 264
pnml2lts-mc( 0/ 4): - claim success count: 1913
pnml2lts-mc( 0/ 4): - cum. max stack depth: 1913
pnml2lts-mc( 0/ 4):
pnml2lts-mc( 0/ 4): Explored 1913 states 28348 transitions, fanout: 14.819
pnml2lts-mc( 0/ 4): Total exploration time 1.030 sec (1.000 sec minimum, 1.017 sec on average)
pnml2lts-mc( 0/ 4): States per second: 1857, Transitions per second: 27522
pnml2lts-mc( 0/ 4):
pnml2lts-mc( 0/ 4): Queue width: 12B, total height: 0, memory: 0.00MB
pnml2lts-mc( 0/ 4): Tree memory: 0.8MB, 30.2 B/state, compr.: 0.9%
pnml2lts-mc( 0/ 4): Tree fill ratio (roots/leafs): 0.0%/0.0%
pnml2lts-mc( 0/ 4): Stored 809 string chucks using 0MB
pnml2lts-mc( 0/ 4): Total memory used for chunk indexing: 0MB
pnml2lts-mc( 0/ 4): Est. total memory use: 0.8MB (~8192.0MB paged-in)
ltl formula name DatabaseWithMutex-PT-10-LTLCardinality-13
ltl formula formula --ltl=/tmp/ltl_13_
pnml2lts-mc( 0/ 4): Loading model from model.pnml
pnml2lts-mc( 0/ 4): Edge label is id
pnml2lts-mc( 0/ 4): Petri net has 830 places, 800 transitions and 3800 arcs
pnml2lts-mc( 0/ 4): Petri net DatabaseWithMutex-PT-10 analyzed
pnml2lts-mc( 0/ 4): There are no safe places
pnml2lts-mc( 1/ 4): LTL layer: formula: /tmp/ltl_13_
pnml2lts-mc( 0/ 4): Loading Petri net took 0.300 real 0.070 user 0.570 sys
pnml2lts-mc( 0/ 4): Weak Buchi automaton detected, adding non-accepting as progress label.
pnml2lts-mc( 0/ 4): There are 832 state labels and 1 edge labels
pnml2lts-mc( 0/ 4): State length is 831, there are 803 groups
pnml2lts-mc( 0/ 4): Running ufscc using 4 cores
pnml2lts-mc( 0/ 4): Using a tree table with 2^30 elements
pnml2lts-mc( 0/ 4): Successor permutation: dynamic
pnml2lts-mc( 0/ 4): Global bits: 0, count bits: 0, local bits: 0
pnml2lts-mc( 0/ 4): ~2500 levels ~10000 states ~147616 transitions
pnml2lts-mc( 0/ 4): ~5000 levels ~20000 states ~262168 transitions
pnml2lts-mc( 0/ 4): ~10000 levels ~40000 states ~510876 transitions
pnml2lts-mc( 0/ 4): ~20000 levels ~80000 states ~1002320 transitions
pnml2lts-mc( 0/ 4): ~40000 levels ~160000 states ~1903028 transitions
pnml2lts-mc( 3/ 4): ~80000 levels ~320000 states ~3608772 transitions
pnml2lts-mc( 3/ 4): ~160000 levels ~640000 states ~7147668 transitions
pnml2lts-mc( 3/ 4): ~319979 levels ~1280000 states ~13956888 transitions
ltl formula name DatabaseWithMutex-PT-10-LTLCardinality-14
ltl formula formula --ltl=/tmp/ltl_14_
pnml2lts-mc( 0/ 4): Loading model from model.pnml
pnml2lts-mc( 0/ 4): Edge label is id
pnml2lts-mc( 0/ 4): Petri net has 830 places, 800 transitions and 3800 arcs
pnml2lts-mc( 0/ 4): Petri net DatabaseWithMutex-PT-10 analyzed
pnml2lts-mc( 0/ 4): There are no safe places
pnml2lts-mc( 0/ 4): Loading Petri net took 0.390 real 0.080 user 0.610 sys
pnml2lts-mc( 3/ 4): LTL layer: formula: /tmp/ltl_14_
pnml2lts-mc( 0/ 4): Weak Buchi automaton detected, adding non-accepting as progress label.
pnml2lts-mc( 0/ 4): There are 832 state labels and 1 edge labels
pnml2lts-mc( 0/ 4): State length is 831, there are 802 groups
pnml2lts-mc( 0/ 4): Running ufscc using 4 cores
pnml2lts-mc( 0/ 4): Using a tree table with 2^30 elements
pnml2lts-mc( 0/ 4): Successor permutation: dynamic
pnml2lts-mc( 0/ 4): Global bits: 0, count bits: 0, local bits: 0
pnml2lts-mc( 0/ 4):
pnml2lts-mc( 0/ 4): total scc count: 101
pnml2lts-mc( 0/ 4): unique states count: 101
pnml2lts-mc( 0/ 4): unique transitions count: 100
pnml2lts-mc( 0/ 4): - self-loop count: 0
pnml2lts-mc( 0/ 4): - claim dead count: 172
pnml2lts-mc( 0/ 4): - claim found count: 0
pnml2lts-mc( 0/ 4): - claim success count: 114
pnml2lts-mc( 0/ 4): - cum. max stack depth: 8
pnml2lts-mc( 0/ 4):
pnml2lts-mc( 0/ 4): Explored 114 states 404 transitions, fanout: 3.544
pnml2lts-mc( 0/ 4): Total exploration time 0.040 sec (0.030 sec minimum, 0.035 sec on average)
pnml2lts-mc( 0/ 4): States per second: 2850, Transitions per second: 10100
pnml2lts-mc( 0/ 4):
pnml2lts-mc( 0/ 4): Queue width: 12B, total height: 0, memory: 0.00MB
pnml2lts-mc( 0/ 4): Tree memory: 0.0MB, 58.2 B/state, compr.: 1.8%
pnml2lts-mc( 0/ 4): Tree fill ratio (roots/leafs): 0.0%/0.0%
pnml2lts-mc( 0/ 4): Stored 809 string chucks using 0MB
pnml2lts-mc( 0/ 4): Total memory used for chunk indexing: 0MB
pnml2lts-mc( 0/ 4): Est. total memory use: 0.0MB (~8192.0MB paged-in)
ltl formula name DatabaseWithMutex-PT-10-LTLCardinality-15
ltl formula formula --ltl=/tmp/ltl_15_
pnml2lts-mc( 0/ 4): Loading model from model.pnml
pnml2lts-mc( 0/ 4): Edge label is id
pnml2lts-mc( 0/ 4): Petri net has 830 places, 800 transitions and 3800 arcs
pnml2lts-mc( 0/ 4): Petri net DatabaseWithMutex-PT-10 analyzed
pnml2lts-mc( 3/ 4): LTL layer: formula: /tmp/ltl_15_
pnml2lts-mc( 0/ 4): There are no safe places
pnml2lts-mc( 0/ 4): Loading Petri net took 0.220 real 0.070 user 0.280 sys
pnml2lts-mc( 0/ 4): There are 831 state labels and 1 edge labels
pnml2lts-mc( 0/ 4): State length is 831, there are 804 groups
pnml2lts-mc( 0/ 4): Running ufscc using 4 cores
pnml2lts-mc( 0/ 4): Using a tree table with 2^30 elements
pnml2lts-mc( 0/ 4): Successor permutation: dynamic
pnml2lts-mc( 0/ 4): Global bits: 0, count bits: 0, local bits: 0
pnml2lts-mc( 3/ 4): ~2500 levels ~10000 states ~138068 transitions
pnml2lts-mc( 3/ 4): ~5000 levels ~20000 states ~262528 transitions
pnml2lts-mc( 3/ 4): ~10000 levels ~40000 states ~516208 transitions
pnml2lts-mc( 3/ 4): ~20000 levels ~80000 states ~1032676 transitions
pnml2lts-mc( 3/ 4): ~40000 levels ~160000 states ~1993248 transitions
pnml2lts-mc( 3/ 4): ~80000 levels ~320000 states ~4015576 transitions
pnml2lts-mc( 3/ 4): ~160000 levels ~640000 states ~7881616 transitions
pnml2lts-mc( 3/ 4): ~320000 levels ~1280000 states ~15236944 transitions
Sequence of Actions to be Executed by the VM
This is useful if one wants to reexecute the tool in the VM from the submitted image disk.
set -x
# this is for BenchKit: configuration of major elements for the test
export BK_INPUT="DatabaseWithMutex-PT-10"
export BK_EXAMINATION="LTLCardinality"
export BK_TOOL="ltsmin"
export BK_RESULT_DIR="/tmp/BK_RESULTS/OUTPUTS"
export BK_TIME_CONFINEMENT="3600"
export BK_MEMORY_CONFINEMENT="16384"
# this is specific to your benchmark or test
export BIN_DIR="$HOME/BenchKit/bin"
# remove the execution directoty if it exists (to avoid increse of .vmdk images)
if [ -d execution ] ; then
rm -rf execution
fi
tar xzf /home/mcc/BenchKit/INPUTS/DatabaseWithMutex-PT-10.tgz
mv DatabaseWithMutex-PT-10 execution
cd execution
pwd
ls -lh
# this is for BenchKit: explicit launching of the test
echo "====================================================================="
echo " Generated by BenchKit 2-3637"
echo " Executing tool ltsmin"
echo " Input is DatabaseWithMutex-PT-10, examination is LTLCardinality"
echo " Time confinement is $BK_TIME_CONFINEMENT seconds"
echo " Memory confinement is 16384 MBytes"
echo " Number of cores is 4"
echo " Run identifier is r233-blw3-152732474800015"
echo "====================================================================="
echo
echo "--------------------"
echo "content from stdout:"
echo
echo "=== Data for post analysis generated by BenchKit (invocation template)"
echo
if [ "LTLCardinality" = "UpperBounds" ] ; then
echo "The expected result is a vector of positive values"
echo NUM_VECTOR
elif [ "LTLCardinality" != "StateSpace" ] ; then
echo "The expected result is a vector of booleans"
echo BOOL_VECTOR
else
echo "no data necessary for post analysis"
fi
echo
if [ -f "LTLCardinality.txt" ] ; then
echo "here is the order used to build the result vector(from text file)"
for x in $(grep Property LTLCardinality.txt | cut -d ' ' -f 2 | sort -u) ; do
echo "FORMULA_NAME $x"
done
elif [ -f "LTLCardinality.xml" ] ; then # for cunf (txt files deleted;-)
echo echo "here is the order used to build the result vector(from xml file)"
for x in $(grep '
echo "FORMULA_NAME $x"
done
fi
echo
echo "=== Now, execution of the tool begins"
echo
echo -n "BK_START "
date -u +%s%3N
echo
timeout -s 9 $BK_TIME_CONFINEMENT bash -c "/home/mcc/BenchKit/BenchKit_head.sh 2> STDERR ; echo ; echo -n \"BK_STOP \" ; date -u +%s%3N"
if [ $? -eq 137 ] ; then
echo
echo "BK_TIME_CONFINEMENT_REACHED"
fi
echo
echo "--------------------"
echo "content from stderr:"
echo
cat STDERR ;