

About the Execution of LTSMin for CSRepetitions-PT-10
| Execution Summary | |||||
| Max Memory Used (MB) |
Time wait (ms) | CPU Usage (ms) | I/O Wait (ms) | Computed Result | Execution Status |
| 979.820 | 1795996.00 | 1848423.00 | 287.50 | ????????FFFFFFFF | normal |
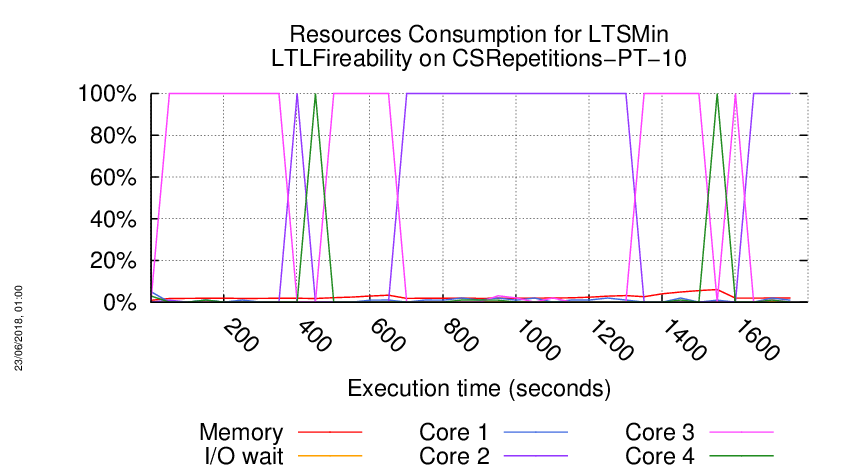
Execution Chart
We display below the execution chart for this examination (boot time has been removed).
Trace from the execution
Waiting for the VM to be ready (probing ssh)
...................
/home/mcc/execution
total 6.4M
-rw-r--r-- 1 mcc users 147K May 15 18:54 CTLCardinality.txt
-rw-r--r-- 1 mcc users 353K May 15 18:54 CTLCardinality.xml
-rw-r--r-- 1 mcc users 343K May 15 18:54 CTLFireability.txt
-rw-r--r-- 1 mcc users 1.1M May 15 18:54 CTLFireability.xml
-rw-r--r-- 1 mcc users 4.0K May 15 18:49 GenericPropertiesDefinition.xml
-rw-r--r-- 1 mcc users 6.0K May 15 18:49 GenericPropertiesVerdict.xml
-rw-r--r-- 1 mcc users 71K May 26 09:26 LTLCardinality.txt
-rw-r--r-- 1 mcc users 174K May 26 09:26 LTLCardinality.xml
-rw-r--r-- 1 mcc users 154K May 26 09:26 LTLFireability.txt
-rw-r--r-- 1 mcc users 427K May 26 09:26 LTLFireability.xml
-rw-r--r-- 1 mcc users 146K May 15 18:54 ReachabilityCardinality.txt
-rw-r--r-- 1 mcc users 339K May 15 18:54 ReachabilityCardinality.xml
-rw-r--r-- 1 mcc users 110 May 15 18:54 ReachabilityDeadlock.txt
-rw-r--r-- 1 mcc users 348 May 15 18:54 ReachabilityDeadlock.xml
-rw-r--r-- 1 mcc users 302K May 15 18:54 ReachabilityFireability.txt
-rw-r--r-- 1 mcc users 901K May 15 18:54 ReachabilityFireability.xml
-rw-r--r-- 1 mcc users 32K May 15 18:54 UpperBounds.txt
-rw-r--r-- 1 mcc users 60K May 15 18:54 UpperBounds.xml
-rw-r--r-- 1 mcc users 5 May 15 18:49 equiv_col
-rw-r--r-- 1 mcc users 3 May 15 18:49 instance
-rw-r--r-- 1 mcc users 6 May 15 18:49 iscolored
-rw-r--r-- 1 mcc users 2.0M May 15 18:49 model.pnml
=====================================================================
Generated by BenchKit 2-3637
Executing tool ltsmin
Input is CSRepetitions-PT-10, examination is LTLFireability
Time confinement is 3600 seconds
Memory confinement is 16384 MBytes
Number of cores is 4
Run identifier is r221-ebro-152732363500136
=====================================================================
--------------------
content from stdout:
=== Data for post analysis generated by BenchKit (invocation template)
The expected result is a vector of booleans
BOOL_VECTOR
here is the order used to build the result vector(from text file)
FORMULA_NAME CSRepetitions-PT-10-LTLFireability-00
FORMULA_NAME CSRepetitions-PT-10-LTLFireability-01
FORMULA_NAME CSRepetitions-PT-10-LTLFireability-02
FORMULA_NAME CSRepetitions-PT-10-LTLFireability-03
FORMULA_NAME CSRepetitions-PT-10-LTLFireability-04
FORMULA_NAME CSRepetitions-PT-10-LTLFireability-05
FORMULA_NAME CSRepetitions-PT-10-LTLFireability-06
FORMULA_NAME CSRepetitions-PT-10-LTLFireability-07
FORMULA_NAME CSRepetitions-PT-10-LTLFireability-08
FORMULA_NAME CSRepetitions-PT-10-LTLFireability-09
FORMULA_NAME CSRepetitions-PT-10-LTLFireability-10
FORMULA_NAME CSRepetitions-PT-10-LTLFireability-11
FORMULA_NAME CSRepetitions-PT-10-LTLFireability-12
FORMULA_NAME CSRepetitions-PT-10-LTLFireability-13
FORMULA_NAME CSRepetitions-PT-10-LTLFireability-14
FORMULA_NAME CSRepetitions-PT-10-LTLFireability-15
=== Now, execution of the tool begins
BK_START 1527494382483
FORMULA CSRepetitions-PT-10-LTLFireability-00 CANNOT_COMPUTE
FORMULA CSRepetitions-PT-10-LTLFireability-01 CANNOT_COMPUTE
FORMULA CSRepetitions-PT-10-LTLFireability-02 CANNOT_COMPUTE
FORMULA CSRepetitions-PT-10-LTLFireability-03 CANNOT_COMPUTE
FORMULA CSRepetitions-PT-10-LTLFireability-04 CANNOT_COMPUTE
FORMULA CSRepetitions-PT-10-LTLFireability-05 CANNOT_COMPUTE
FORMULA CSRepetitions-PT-10-LTLFireability-06 CANNOT_COMPUTE
FORMULA CSRepetitions-PT-10-LTLFireability-07 CANNOT_COMPUTE
FORMULA CSRepetitions-PT-10-LTLFireability-08 FALSE TECHNIQUES EXPLICIT PARALLEL_PROCESSING USE_NUPN
FORMULA CSRepetitions-PT-10-LTLFireability-09 FALSE TECHNIQUES EXPLICIT PARALLEL_PROCESSING USE_NUPN
FORMULA CSRepetitions-PT-10-LTLFireability-10 FALSE TECHNIQUES EXPLICIT PARALLEL_PROCESSING USE_NUPN
FORMULA CSRepetitions-PT-10-LTLFireability-11 FALSE TECHNIQUES EXPLICIT PARALLEL_PROCESSING USE_NUPN
FORMULA CSRepetitions-PT-10-LTLFireability-12 FALSE TECHNIQUES EXPLICIT PARALLEL_PROCESSING USE_NUPN
FORMULA CSRepetitions-PT-10-LTLFireability-13 FALSE TECHNIQUES EXPLICIT PARALLEL_PROCESSING USE_NUPN
FORMULA CSRepetitions-PT-10-LTLFireability-14 FALSE TECHNIQUES EXPLICIT PARALLEL_PROCESSING USE_NUPN
FORMULA CSRepetitions-PT-10-LTLFireability-15 FALSE TECHNIQUES EXPLICIT PARALLEL_PROCESSING USE_NUPN
BK_STOP 1527496178479
--------------------
content from stderr:
mcc2018
ltl formula name CSRepetitions-PT-10-LTLFireability-00
ltl formula formula --ltl=/tmp/ltl_0_
pnml2lts-mc( 0/ 4): Loading model from model.pnml
pnml2lts-mc( 0/ 4): Edge label is id
pnml2lts-mc( 0/ 4): Petri net has 1311 places, 2300 transitions and 8700 arcs
pnml2lts-mc( 0/ 4): Petri net CSRepetitions-PT-10 analyzed
pnml2lts-mc( 0/ 4): There are no safe places
pnml2lts-mc( 0/ 4): Loading Petri net took 0.810 real 0.350 user 0.840 sys
pnml2lts-mc( 1/ 4): LTL layer: formula: /tmp/ltl_0_
ltl formula name CSRepetitions-PT-10-LTLFireability-01
ltl formula formula --ltl=/tmp/ltl_1_
pnml2lts-mc( 0/ 4): Loading model from model.pnml
pnml2lts-mc( 0/ 4): Edge label is id
pnml2lts-mc( 0/ 4): Petri net has 1311 places, 2300 transitions and 8700 arcs
pnml2lts-mc( 0/ 4): Petri net CSRepetitions-PT-10 analyzed
pnml2lts-mc( 2/ 4): LTL layer: formula: /tmp/ltl_1_
pnml2lts-mc( 0/ 4): There are no safe places
pnml2lts-mc( 0/ 4): Loading Petri net took 1.360 real 0.580 user 1.680 sys
ltl formula name CSRepetitions-PT-10-LTLFireability-02
ltl formula formula --ltl=/tmp/ltl_2_
pnml2lts-mc( 0/ 4): Loading model from model.pnml
pnml2lts-mc( 0/ 4): Edge label is id
pnml2lts-mc( 0/ 4): Petri net has 1311 places, 2300 transitions and 8700 arcs
pnml2lts-mc( 0/ 4): Petri net CSRepetitions-PT-10 analyzed
pnml2lts-mc( 0/ 4): There are no safe places
pnml2lts-mc( 0/ 4): Loading Petri net took 0.870 real 0.440 user 1.080 sys
pnml2lts-mc( 0/ 4): LTL layer: formula: /tmp/ltl_2_
ltl formula name CSRepetitions-PT-10-LTLFireability-03
ltl formula formula --ltl=/tmp/ltl_3_
pnml2lts-mc( 0/ 4): Loading model from model.pnml
pnml2lts-mc( 0/ 4): Edge label is id
pnml2lts-mc( 0/ 4): Petri net has 1311 places, 2300 transitions and 8700 arcs
pnml2lts-mc( 0/ 4): Petri net CSRepetitions-PT-10 analyzed
pnml2lts-mc( 1/ 4): LTL layer: formula: /tmp/ltl_3_
pnml2lts-mc( 0/ 4): There are no safe places
pnml2lts-mc( 0/ 4): Loading Petri net took 1.400 real 0.620 user 1.920 sys
ltl formula name CSRepetitions-PT-10-LTLFireability-04
ltl formula formula --ltl=/tmp/ltl_4_
pnml2lts-mc( 0/ 4): Loading model from model.pnml
pnml2lts-mc( 0/ 4): Edge label is id
pnml2lts-mc( 0/ 4): Petri net has 1311 places, 2300 transitions and 8700 arcs
pnml2lts-mc( 0/ 4): Petri net CSRepetitions-PT-10 analyzed
pnml2lts-mc( 1/ 4): LTL layer: formula: /tmp/ltl_4_
pnml2lts-mc( 0/ 4): There are no safe places
pnml2lts-mc( 0/ 4): Loading Petri net took 1.610 real 0.780 user 2.110 sys
ltl formula name CSRepetitions-PT-10-LTLFireability-05
ltl formula formula --ltl=/tmp/ltl_5_
pnml2lts-mc( 0/ 4): Loading model from model.pnml
pnml2lts-mc( 0/ 4): Edge label is id
pnml2lts-mc( 0/ 4): Petri net has 1311 places, 2300 transitions and 8700 arcs
pnml2lts-mc( 0/ 4): Petri net CSRepetitions-PT-10 analyzed
pnml2lts-mc( 3/ 4): LTL layer: formula: /tmp/ltl_5_
pnml2lts-mc( 0/ 4): There are no safe places
pnml2lts-mc( 0/ 4): Loading Petri net took 1.680 real 0.660 user 2.560 sys
ltl formula name CSRepetitions-PT-10-LTLFireability-06
ltl formula formula --ltl=/tmp/ltl_6_
pnml2lts-mc( 0/ 4): Loading model from model.pnml
pnml2lts-mc( 0/ 4): Edge label is id
pnml2lts-mc( 0/ 4): Petri net has 1311 places, 2300 transitions and 8700 arcs
pnml2lts-mc( 0/ 4): Petri net CSRepetitions-PT-10 analyzed
pnml2lts-mc( 3/ 4): LTL layer: formula: /tmp/ltl_6_
pnml2lts-mc( 0/ 4): There are no safe places
pnml2lts-mc( 0/ 4): Loading Petri net took 1.470 real 0.530 user 2.020 sys
ltl formula name CSRepetitions-PT-10-LTLFireability-07
ltl formula formula --ltl=/tmp/ltl_7_
pnml2lts-mc( 0/ 4): Loading model from model.pnml
pnml2lts-mc( 0/ 4): Edge label is id
pnml2lts-mc( 0/ 4): Petri net has 1311 places, 2300 transitions and 8700 arcs
pnml2lts-mc( 0/ 4): Petri net CSRepetitions-PT-10 analyzed
pnml2lts-mc( 0/ 4): There are no safe places
pnml2lts-mc( 1/ 4): LTL layer: formula: /tmp/ltl_7_
pnml2lts-mc( 0/ 4): Loading Petri net took 1.380 real 0.450 user 1.950 sys
ltl formula name CSRepetitions-PT-10-LTLFireability-08
ltl formula formula --ltl=/tmp/ltl_8_
pnml2lts-mc( 0/ 4): Loading model from model.pnml
pnml2lts-mc( 0/ 4): Edge label is id
pnml2lts-mc( 0/ 4): Petri net has 1311 places, 2300 transitions and 8700 arcs
pnml2lts-mc( 0/ 4): Petri net CSRepetitions-PT-10 analyzed
pnml2lts-mc( 0/ 4): There are no safe places
pnml2lts-mc( 0/ 4): Loading Petri net took 0.390 real 0.540 user 0.400 sys
pnml2lts-mc( 0/ 4): LTL layer: formula: /tmp/ltl_8_
pnml2lts-mc( 0/ 4): buchi has 2 states
pnml2lts-mc( 0/ 4): There are 1312 state labels and 1 edge labels
pnml2lts-mc( 0/ 4): State length is 1312, there are 2304 groups
pnml2lts-mc( 0/ 4): Running ufscc using 4 cores
pnml2lts-mc( 0/ 4): Using a tree table with 2^30 elements
pnml2lts-mc( 0/ 4): Successor permutation: dynamic
pnml2lts-mc( 0/ 4): Global bits: 0, count bits: 0, local bits: 0
pnml2lts-mc( 2/ 4):
pnml2lts-mc( 2/ 4): Accepting cycle FOUND at depth ~11!
pnml2lts-mc( 2/ 4):
pnml2lts-mc( 0/ 4):
pnml2lts-mc( 0/ 4): total scc count: 0
pnml2lts-mc( 0/ 4): unique states count: 44
pnml2lts-mc( 0/ 4): unique transitions count: 4456
pnml2lts-mc( 0/ 4): - self-loop count: 0
pnml2lts-mc( 0/ 4): - claim dead count: 0
pnml2lts-mc( 0/ 4): - claim found count: 1
pnml2lts-mc( 0/ 4): - claim success count: 47
pnml2lts-mc( 0/ 4): - cum. max stack depth: 47
pnml2lts-mc( 0/ 4):
pnml2lts-mc( 0/ 4): Explored 47 states 4760 transitions, fanout: 101.277
pnml2lts-mc( 0/ 4): Total exploration time 0.180 sec (0.170 sec minimum, 0.178 sec on average)
pnml2lts-mc( 0/ 4): States per second: 261, Transitions per second: 26444
pnml2lts-mc( 0/ 4):
pnml2lts-mc( 0/ 4): Queue width: 12B, total height: 0, memory: 0.00MB
pnml2lts-mc( 0/ 4): Tree memory: 0.1MB, 32.0 B/state, compr.: 0.6%
pnml2lts-mc( 0/ 4): Tree fill ratio (roots/leafs): 0.0%/0.0%
pnml2lts-mc( 0/ 4): Stored 2412 string chucks using 0MB
pnml2lts-mc( 0/ 4): Total memory used for chunk indexing: 0MB
pnml2lts-mc( 0/ 4): Est. total memory use: 0.1MB (~8192.0MB paged-in)
ltl formula name CSRepetitions-PT-10-LTLFireability-09
ltl formula formula --ltl=/tmp/ltl_9_
pnml2lts-mc( 0/ 4): Loading model from model.pnml
pnml2lts-mc( 0/ 4): Edge label is id
pnml2lts-mc( 0/ 4): Petri net has 1311 places, 2300 transitions and 8700 arcs
pnml2lts-mc( 0/ 4): Petri net CSRepetitions-PT-10 analyzed
pnml2lts-mc( 0/ 4): There are no safe places
pnml2lts-mc( 0/ 4): Loading Petri net took 0.460 real 0.470 user 0.400 sys
pnml2lts-mc( 2/ 4): LTL layer: formula: /tmp/ltl_9_
pnml2lts-mc( 0/ 4): Weak Buchi automaton detected, adding non-accepting as progress label.
pnml2lts-mc( 0/ 4): There are 1313 state labels and 1 edge labels
pnml2lts-mc( 0/ 4): State length is 1312, there are 2308 groups
pnml2lts-mc( 0/ 4): Running ufscc using 4 cores
pnml2lts-mc( 0/ 4): Using a tree table with 2^30 elements
pnml2lts-mc( 0/ 4): Successor permutation: dynamic
pnml2lts-mc( 0/ 4): Global bits: 0, count bits: 0, local bits: 0
pnml2lts-mc( 0/ 4):
pnml2lts-mc( 0/ 4): Accepting cycle FOUND at depth ~35!
pnml2lts-mc( 0/ 4):
pnml2lts-mc( 0/ 4):
pnml2lts-mc( 0/ 4): total scc count: 0
pnml2lts-mc( 0/ 4): unique states count: 134
pnml2lts-mc( 0/ 4): unique transitions count: 13927
pnml2lts-mc( 0/ 4): - self-loop count: 0
pnml2lts-mc( 0/ 4): - claim dead count: 0
pnml2lts-mc( 0/ 4): - claim found count: 1
pnml2lts-mc( 0/ 4): - claim success count: 137
pnml2lts-mc( 0/ 4): - cum. max stack depth: 137
pnml2lts-mc( 0/ 4):
pnml2lts-mc( 0/ 4): Explored 137 states 14231 transitions, fanout: 103.876
pnml2lts-mc( 0/ 4): Total exploration time 0.500 sec (0.490 sec minimum, 0.498 sec on average)
pnml2lts-mc( 0/ 4): States per second: 274, Transitions per second: 28462
pnml2lts-mc( 0/ 4):
pnml2lts-mc( 0/ 4): Queue width: 12B, total height: 0, memory: 0.00MB
pnml2lts-mc( 0/ 4): Tree memory: 0.4MB, 30.2 B/state, compr.: 0.6%
pnml2lts-mc( 0/ 4): Tree fill ratio (roots/leafs): 0.0%/0.0%
pnml2lts-mc( 0/ 4): Stored 2412 string chucks using 0MB
pnml2lts-mc( 0/ 4): Total memory used for chunk indexing: 0MB
pnml2lts-mc( 0/ 4): Est. total memory use: 0.4MB (~8192.0MB paged-in)
ltl formula name CSRepetitions-PT-10-LTLFireability-10
ltl formula formula --ltl=/tmp/ltl_10_
pnml2lts-mc( 0/ 4): Loading model from model.pnml
pnml2lts-mc( 0/ 4): Edge label is id
pnml2lts-mc( 0/ 4): Petri net has 1311 places, 2300 transitions and 8700 arcs
pnml2lts-mc( 0/ 4): Petri net CSRepetitions-PT-10 analyzed
pnml2lts-mc( 0/ 4): There are no safe places
pnml2lts-mc( 0/ 4): Loading Petri net took 0.360 real 0.490 user 0.380 sys
pnml2lts-mc( 1/ 4): LTL layer: formula: /tmp/ltl_10_
pnml2lts-mc( 0/ 4): There are 1312 state labels and 1 edge labels
pnml2lts-mc( 0/ 4): State length is 1312, there are 2304 groups
pnml2lts-mc( 0/ 4): Running ufscc using 4 cores
pnml2lts-mc( 0/ 4): Using a tree table with 2^30 elements
pnml2lts-mc( 0/ 4): Successor permutation: dynamic
pnml2lts-mc( 0/ 4): Global bits: 0, count bits: 0, local bits: 0
pnml2lts-mc( 3/ 4):
pnml2lts-mc( 3/ 4): Accepting cycle FOUND at depth ~33!
pnml2lts-mc( 3/ 4):
pnml2lts-mc( 0/ 4):
pnml2lts-mc( 0/ 4): total scc count: 0
pnml2lts-mc( 0/ 4): unique states count: 133
pnml2lts-mc( 0/ 4): unique transitions count: 13934
pnml2lts-mc( 0/ 4): - self-loop count: 0
pnml2lts-mc( 0/ 4): - claim dead count: 0
pnml2lts-mc( 0/ 4): - claim found count: 1
pnml2lts-mc( 0/ 4): - claim success count: 136
pnml2lts-mc( 0/ 4): - cum. max stack depth: 136
pnml2lts-mc( 0/ 4):
pnml2lts-mc( 0/ 4): Explored 136 states 14238 transitions, fanout: 104.691
pnml2lts-mc( 0/ 4): Total exploration time 0.520 sec (0.520 sec minimum, 0.520 sec on average)
pnml2lts-mc( 0/ 4): States per second: 262, Transitions per second: 27381
pnml2lts-mc( 0/ 4):
pnml2lts-mc( 0/ 4): Queue width: 12B, total height: 0, memory: 0.00MB
pnml2lts-mc( 0/ 4): Tree memory: 0.4MB, 32.8 B/state, compr.: 0.6%
pnml2lts-mc( 0/ 4): Tree fill ratio (roots/leafs): 0.0%/0.0%
pnml2lts-mc( 0/ 4): Stored 2412 string chucks using 0MB
pnml2lts-mc( 0/ 4): Total memory used for chunk indexing: 0MB
pnml2lts-mc( 0/ 4): Est. total memory use: 0.4MB (~8192.0MB paged-in)
ltl formula name CSRepetitions-PT-10-LTLFireability-11
ltl formula formula --ltl=/tmp/ltl_11_
pnml2lts-mc( 0/ 4): Loading model from model.pnml
pnml2lts-mc( 0/ 4): Edge label is id
pnml2lts-mc( 0/ 4): Petri net has 1311 places, 2300 transitions and 8700 arcs
pnml2lts-mc( 0/ 4): Petri net CSRepetitions-PT-10 analyzed
pnml2lts-mc( 0/ 4): There are no safe places
pnml2lts-mc( 0/ 4): Loading Petri net took 0.360 real 0.490 user 0.370 sys
pnml2lts-mc( 1/ 4): LTL layer: formula: /tmp/ltl_11_
pnml2lts-mc( 0/ 4): Weak Buchi automaton detected, adding non-accepting as progress label.
pnml2lts-mc( 0/ 4): There are 1313 state labels and 1 edge labels
pnml2lts-mc( 0/ 4): State length is 1312, there are 2301 groups
pnml2lts-mc( 0/ 4): Running ufscc using 4 cores
pnml2lts-mc( 0/ 4): Using a tree table with 2^30 elements
pnml2lts-mc( 0/ 4): Successor permutation: dynamic
pnml2lts-mc( 0/ 4): Global bits: 0, count bits: 0, local bits: 0
pnml2lts-mc( 1/ 4):
pnml2lts-mc( 1/ 4): Accepting cycle FOUND at depth ~25!
pnml2lts-mc( 1/ 4):
pnml2lts-mc( 0/ 4):
pnml2lts-mc( 0/ 4): total scc count: 0
pnml2lts-mc( 0/ 4): unique states count: 90
pnml2lts-mc( 0/ 4): unique transitions count: 9393
pnml2lts-mc( 0/ 4): - self-loop count: 0
pnml2lts-mc( 0/ 4): - claim dead count: 0
pnml2lts-mc( 0/ 4): - claim found count: 1
pnml2lts-mc( 0/ 4): - claim success count: 93
pnml2lts-mc( 0/ 4): - cum. max stack depth: 93
pnml2lts-mc( 0/ 4):
pnml2lts-mc( 0/ 4): Explored 93 states 9697 transitions, fanout: 104.269
pnml2lts-mc( 0/ 4): Total exploration time 0.350 sec (0.340 sec minimum, 0.343 sec on average)
pnml2lts-mc( 0/ 4): States per second: 266, Transitions per second: 27706
pnml2lts-mc( 0/ 4):
pnml2lts-mc( 0/ 4): Queue width: 12B, total height: 0, memory: 0.00MB
pnml2lts-mc( 0/ 4): Tree memory: 0.3MB, 31.5 B/state, compr.: 0.6%
pnml2lts-mc( 0/ 4): Tree fill ratio (roots/leafs): 0.0%/0.0%
pnml2lts-mc( 0/ 4): Stored 2412 string chucks using 0MB
pnml2lts-mc( 0/ 4): Total memory used for chunk indexing: 0MB
pnml2lts-mc( 0/ 4): Est. total memory use: 0.3MB (~8192.0MB paged-in)
ltl formula name CSRepetitions-PT-10-LTLFireability-12
ltl formula formula --ltl=/tmp/ltl_12_
pnml2lts-mc( 0/ 4): Loading model from model.pnml
pnml2lts-mc( 0/ 4): Edge label is id
pnml2lts-mc( 0/ 4): Petri net has 1311 places, 2300 transitions and 8700 arcs
pnml2lts-mc( 0/ 4): Petri net CSRepetitions-PT-10 analyzed
pnml2lts-mc( 0/ 4): There are no safe places
pnml2lts-mc( 0/ 4): Loading Petri net took 0.340 real 0.430 user 0.410 sys
pnml2lts-mc( 1/ 4): LTL layer: formula: /tmp/ltl_12_
pnml2lts-mc( 0/ 4): Weak Buchi automaton detected, adding non-accepting as progress label.
pnml2lts-mc( 0/ 4): There are 1313 state labels and 1 edge labels
pnml2lts-mc( 0/ 4): State length is 1312, there are 2306 groups
pnml2lts-mc( 0/ 4): Running ufscc using 4 cores
pnml2lts-mc( 0/ 4): Using a tree table with 2^30 elements
pnml2lts-mc( 0/ 4): Successor permutation: dynamic
pnml2lts-mc( 0/ 4): Global bits: 0, count bits: 0, local bits: 0
pnml2lts-mc( 2/ 4):
pnml2lts-mc( 2/ 4): Accepting cycle FOUND at depth ~41!
pnml2lts-mc( 2/ 4):
pnml2lts-mc( 0/ 4):
pnml2lts-mc( 0/ 4): total scc count: 0
pnml2lts-mc( 0/ 4): unique states count: 164
pnml2lts-mc( 0/ 4): unique transitions count: 32584
pnml2lts-mc( 0/ 4): - self-loop count: 0
pnml2lts-mc( 0/ 4): - claim dead count: 0
pnml2lts-mc( 0/ 4): - claim found count: 6
pnml2lts-mc( 0/ 4): - claim success count: 168
pnml2lts-mc( 0/ 4): - cum. max stack depth: 168
pnml2lts-mc( 0/ 4):
pnml2lts-mc( 0/ 4): Explored 168 states 33688 transitions, fanout: 200.524
pnml2lts-mc( 0/ 4): Total exploration time 0.770 sec (0.770 sec minimum, 0.770 sec on average)
pnml2lts-mc( 0/ 4): States per second: 218, Transitions per second: 43751
pnml2lts-mc( 0/ 4):
pnml2lts-mc( 0/ 4): Queue width: 12B, total height: 0, memory: 0.00MB
pnml2lts-mc( 0/ 4): Tree memory: 0.6MB, 20.9 B/state, compr.: 0.4%
pnml2lts-mc( 0/ 4): Tree fill ratio (roots/leafs): 0.0%/0.0%
pnml2lts-mc( 0/ 4): Stored 2412 string chucks using 0MB
pnml2lts-mc( 0/ 4): Total memory used for chunk indexing: 0MB
pnml2lts-mc( 0/ 4): Est. total memory use: 0.6MB (~8192.0MB paged-in)
ltl formula name CSRepetitions-PT-10-LTLFireability-13
ltl formula formula --ltl=/tmp/ltl_13_
pnml2lts-mc( 0/ 4): Loading model from model.pnml
pnml2lts-mc( 0/ 4): Edge label is id
pnml2lts-mc( 0/ 4): Petri net has 1311 places, 2300 transitions and 8700 arcs
pnml2lts-mc( 0/ 4): Petri net CSRepetitions-PT-10 analyzed
pnml2lts-mc( 0/ 4): There are no safe places
pnml2lts-mc( 0/ 4): Loading Petri net took 0.350 real 0.480 user 0.350 sys
pnml2lts-mc( 2/ 4): LTL layer: formula: /tmp/ltl_13_
pnml2lts-mc( 0/ 4): Weak Buchi automaton detected, adding non-accepting as progress label.
pnml2lts-mc( 0/ 4): There are 1313 state labels and 1 edge labels
pnml2lts-mc( 0/ 4): State length is 1312, there are 2305 groups
pnml2lts-mc( 0/ 4): Running ufscc using 4 cores
pnml2lts-mc( 0/ 4): Using a tree table with 2^30 elements
pnml2lts-mc( 0/ 4): Successor permutation: dynamic
pnml2lts-mc( 0/ 4): Global bits: 0, count bits: 0, local bits: 0
pnml2lts-mc( 0/ 4):
pnml2lts-mc( 0/ 4): Accepting cycle FOUND at depth ~32!
pnml2lts-mc( 0/ 4):
pnml2lts-mc( 0/ 4):
pnml2lts-mc( 0/ 4): total scc count: 0
pnml2lts-mc( 0/ 4): unique states count: 130
pnml2lts-mc( 0/ 4): unique transitions count: 13412
pnml2lts-mc( 0/ 4): - self-loop count: 0
pnml2lts-mc( 0/ 4): - claim dead count: 0
pnml2lts-mc( 0/ 4): - claim found count: 1
pnml2lts-mc( 0/ 4): - claim success count: 133
pnml2lts-mc( 0/ 4): - cum. max stack depth: 133
pnml2lts-mc( 0/ 4):
pnml2lts-mc( 0/ 4): Explored 133 states 13716 transitions, fanout: 103.128
pnml2lts-mc( 0/ 4): Total exploration time 0.450 sec (0.440 sec minimum, 0.445 sec on average)
pnml2lts-mc( 0/ 4): States per second: 296, Transitions per second: 30480
pnml2lts-mc( 0/ 4):
pnml2lts-mc( 0/ 4): Queue width: 12B, total height: 0, memory: 0.00MB
pnml2lts-mc( 0/ 4): Tree memory: 0.4MB, 28.9 B/state, compr.: 0.6%
pnml2lts-mc( 0/ 4): Tree fill ratio (roots/leafs): 0.0%/0.0%
pnml2lts-mc( 0/ 4): Stored 2412 string chucks using 0MB
pnml2lts-mc( 0/ 4): Total memory used for chunk indexing: 0MB
pnml2lts-mc( 0/ 4): Est. total memory use: 0.4MB (~8192.0MB paged-in)
ltl formula name CSRepetitions-PT-10-LTLFireability-14
ltl formula formula --ltl=/tmp/ltl_14_
pnml2lts-mc( 0/ 4): Loading model from model.pnml
pnml2lts-mc( 0/ 4): Edge label is id
pnml2lts-mc( 0/ 4): Petri net has 1311 places, 2300 transitions and 8700 arcs
pnml2lts-mc( 0/ 4): Petri net CSRepetitions-PT-10 analyzed
pnml2lts-mc( 0/ 4): There are no safe places
pnml2lts-mc( 0/ 4): Loading Petri net took 0.360 real 0.440 user 0.440 sys
pnml2lts-mc( 1/ 4): LTL layer: formula: /tmp/ltl_14_
pnml2lts-mc( 0/ 4): There are 1312 state labels and 1 edge labels
pnml2lts-mc( 0/ 4): State length is 1312, there are 2338 groups
pnml2lts-mc( 0/ 4): Running ufscc using 4 cores
pnml2lts-mc( 0/ 4): Using a tree table with 2^30 elements
pnml2lts-mc( 0/ 4): Successor permutation: dynamic
pnml2lts-mc( 0/ 4): Global bits: 0, count bits: 0, local bits: 0
pnml2lts-mc( 0/ 4):
pnml2lts-mc( 0/ 4): Accepting cycle FOUND at depth ~7!
pnml2lts-mc( 0/ 4):
pnml2lts-mc( 0/ 4):
pnml2lts-mc( 0/ 4): total scc count: 0
pnml2lts-mc( 0/ 4): unique states count: 28
pnml2lts-mc( 0/ 4): unique transitions count: 5668
pnml2lts-mc( 0/ 4): - self-loop count: 0
pnml2lts-mc( 0/ 4): - claim dead count: 0
pnml2lts-mc( 0/ 4): - claim found count: 1
pnml2lts-mc( 0/ 4): - claim success count: 31
pnml2lts-mc( 0/ 4): - cum. max stack depth: 31
pnml2lts-mc( 0/ 4):
pnml2lts-mc( 0/ 4): Explored 31 states 6272 transitions, fanout: 202.323
pnml2lts-mc( 0/ 4): Total exploration time 0.170 sec (0.170 sec minimum, 0.170 sec on average)
pnml2lts-mc( 0/ 4): States per second: 182, Transitions per second: 36894
pnml2lts-mc( 0/ 4):
pnml2lts-mc( 0/ 4): Queue width: 12B, total height: 0, memory: 0.00MB
pnml2lts-mc( 0/ 4): Tree memory: 0.1MB, 24.3 B/state, compr.: 0.5%
pnml2lts-mc( 0/ 4): Tree fill ratio (roots/leafs): 0.0%/0.0%
pnml2lts-mc( 0/ 4): Stored 2412 string chucks using 0MB
pnml2lts-mc( 0/ 4): Total memory used for chunk indexing: 0MB
pnml2lts-mc( 0/ 4): Est. total memory use: 0.1MB (~8192.0MB paged-in)
ltl formula name CSRepetitions-PT-10-LTLFireability-15
ltl formula formula --ltl=/tmp/ltl_15_
pnml2lts-mc( 0/ 4): Loading model from model.pnml
pnml2lts-mc( 0/ 4): Edge label is id
pnml2lts-mc( 0/ 4): Petri net has 1311 places, 2300 transitions and 8700 arcs
pnml2lts-mc( 0/ 4): Petri net CSRepetitions-PT-10 analyzed
pnml2lts-mc( 0/ 4): There are no safe places
pnml2lts-mc( 0/ 4): Loading Petri net took 0.360 real 0.500 user 0.370 sys
pnml2lts-mc( 0/ 4): LTL layer: formula: /tmp/ltl_15_
pnml2lts-mc( 0/ 4): buchi has 2 states
pnml2lts-mc( 0/ 4): Weak Buchi automaton detected, adding non-accepting as progress label.
pnml2lts-mc( 0/ 4): There are 1313 state labels and 1 edge labels
pnml2lts-mc( 0/ 4): State length is 1312, there are 2302 groups
pnml2lts-mc( 0/ 4): Running ufscc using 4 cores
pnml2lts-mc( 0/ 4): Using a tree table with 2^30 elements
pnml2lts-mc( 0/ 4): Successor permutation: dynamic
pnml2lts-mc( 0/ 4): Global bits: 0, count bits: 0, local bits: 0
pnml2lts-mc( 2/ 4):
pnml2lts-mc( 2/ 4): Accepting cycle FOUND at depth ~14!
pnml2lts-mc( 2/ 4):
pnml2lts-mc( 0/ 4):
pnml2lts-mc( 0/ 4): total scc count: 0
pnml2lts-mc( 0/ 4): unique states count: 54
pnml2lts-mc( 0/ 4): unique transitions count: 5523
pnml2lts-mc( 0/ 4): - self-loop count: 0
pnml2lts-mc( 0/ 4): - claim dead count: 0
pnml2lts-mc( 0/ 4): - claim found count: 1
pnml2lts-mc( 0/ 4): - claim success count: 57
pnml2lts-mc( 0/ 4): - cum. max stack depth: 57
pnml2lts-mc( 0/ 4):
pnml2lts-mc( 0/ 4): Explored 57 states 5827 transitions, fanout: 102.228
pnml2lts-mc( 0/ 4): Total exploration time 0.220 sec (0.220 sec minimum, 0.220 sec on average)
pnml2lts-mc( 0/ 4): States per second: 259, Transitions per second: 26486
pnml2lts-mc( 0/ 4):
pnml2lts-mc( 0/ 4): Queue width: 12B, total height: 0, memory: 0.00MB
pnml2lts-mc( 0/ 4): Tree memory: 0.2MB, 32.8 B/state, compr.: 0.6%
pnml2lts-mc( 0/ 4): Tree fill ratio (roots/leafs): 0.0%/0.0%
pnml2lts-mc( 0/ 4): Stored 2412 string chucks using 0MB
pnml2lts-mc( 0/ 4): Total memory used for chunk indexing: 0MB
pnml2lts-mc( 0/ 4): Est. total memory use: 0.2MB (~8192.0MB paged-in)
Sequence of Actions to be Executed by the VM
This is useful if one wants to reexecute the tool in the VM from the submitted image disk.
set -x
# this is for BenchKit: configuration of major elements for the test
export BK_INPUT="CSRepetitions-PT-10"
export BK_EXAMINATION="LTLFireability"
export BK_TOOL="ltsmin"
export BK_RESULT_DIR="/tmp/BK_RESULTS/OUTPUTS"
export BK_TIME_CONFINEMENT="3600"
export BK_MEMORY_CONFINEMENT="16384"
# this is specific to your benchmark or test
export BIN_DIR="$HOME/BenchKit/bin"
# remove the execution directoty if it exists (to avoid increse of .vmdk images)
if [ -d execution ] ; then
rm -rf execution
fi
tar xzf /home/mcc/BenchKit/INPUTS/CSRepetitions-PT-10.tgz
mv CSRepetitions-PT-10 execution
cd execution
pwd
ls -lh
# this is for BenchKit: explicit launching of the test
echo "====================================================================="
echo " Generated by BenchKit 2-3637"
echo " Executing tool ltsmin"
echo " Input is CSRepetitions-PT-10, examination is LTLFireability"
echo " Time confinement is $BK_TIME_CONFINEMENT seconds"
echo " Memory confinement is 16384 MBytes"
echo " Number of cores is 4"
echo " Run identifier is r221-ebro-152732363500136"
echo "====================================================================="
echo
echo "--------------------"
echo "content from stdout:"
echo
echo "=== Data for post analysis generated by BenchKit (invocation template)"
echo
if [ "LTLFireability" = "UpperBounds" ] ; then
echo "The expected result is a vector of positive values"
echo NUM_VECTOR
elif [ "LTLFireability" != "StateSpace" ] ; then
echo "The expected result is a vector of booleans"
echo BOOL_VECTOR
else
echo "no data necessary for post analysis"
fi
echo
if [ -f "LTLFireability.txt" ] ; then
echo "here is the order used to build the result vector(from text file)"
for x in $(grep Property LTLFireability.txt | cut -d ' ' -f 2 | sort -u) ; do
echo "FORMULA_NAME $x"
done
elif [ -f "LTLFireability.xml" ] ; then # for cunf (txt files deleted;-)
echo echo "here is the order used to build the result vector(from xml file)"
for x in $(grep '
echo "FORMULA_NAME $x"
done
fi
echo
echo "=== Now, execution of the tool begins"
echo
echo -n "BK_START "
date -u +%s%3N
echo
timeout -s 9 $BK_TIME_CONFINEMENT bash -c "/home/mcc/BenchKit/BenchKit_head.sh 2> STDERR ; echo ; echo -n \"BK_STOP \" ; date -u +%s%3N"
if [ $? -eq 137 ] ; then
echo
echo "BK_TIME_CONFINEMENT_REACHED"
fi
echo
echo "--------------------"
echo "content from stderr:"
echo
cat STDERR ;