

About the Execution of LTSMin for BART-PT-060
| Execution Summary | |||||
| Max Memory Used (MB) |
Time wait (ms) | CPU Usage (ms) | I/O Wait (ms) | Computed Result | Execution Status |
| 4893.700 | 1327673.00 | 1860221.00 | 259.30 | ????????FTFFFFFF | normal |
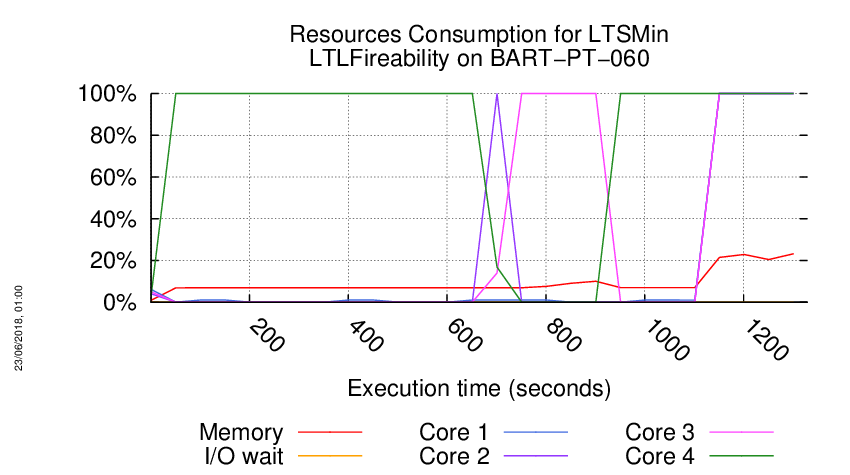
Execution Chart
We display below the execution chart for this examination (boot time has been removed).
Trace from the execution
Waiting for the VM to be ready (probing ssh)
....................
/home/mcc/execution
total 31M
-rw-r--r-- 1 mcc users 522K May 15 18:54 CTLCardinality.txt
-rw-r--r-- 1 mcc users 1.3M May 15 18:54 CTLCardinality.xml
-rw-r--r-- 1 mcc users 1.2M May 15 18:54 CTLFireability.txt
-rw-r--r-- 1 mcc users 3.0M May 15 18:54 CTLFireability.xml
-rw-r--r-- 1 mcc users 4.0K May 15 18:49 GenericPropertiesDefinition.xml
-rw-r--r-- 1 mcc users 6.1K May 15 18:49 GenericPropertiesVerdict.xml
-rw-r--r-- 1 mcc users 533K May 26 09:26 LTLCardinality.txt
-rw-r--r-- 1 mcc users 1.3M May 26 09:26 LTLCardinality.xml
-rw-r--r-- 1 mcc users 1.1M May 26 09:26 LTLFireability.txt
-rw-r--r-- 1 mcc users 2.6M May 26 09:26 LTLFireability.xml
-rw-r--r-- 1 mcc users 353K May 15 18:54 ReachabilityCardinality.txt
-rw-r--r-- 1 mcc users 829K May 15 18:54 ReachabilityCardinality.xml
-rw-r--r-- 1 mcc users 102 May 15 18:54 ReachabilityDeadlock.txt
-rw-r--r-- 1 mcc users 340 May 15 18:54 ReachabilityDeadlock.xml
-rw-r--r-- 1 mcc users 1.1M May 15 18:54 ReachabilityFireability.txt
-rw-r--r-- 1 mcc users 2.7M May 15 18:54 ReachabilityFireability.xml
-rw-r--r-- 1 mcc users 23K May 15 18:54 UpperBounds.txt
-rw-r--r-- 1 mcc users 43K May 15 18:54 UpperBounds.xml
-rw-r--r-- 1 mcc users 5 May 15 18:49 equiv_col
-rw-r--r-- 1 mcc users 4 May 15 18:49 instance
-rw-r--r-- 1 mcc users 6 May 15 18:49 iscolored
-rw-r--r-- 1 mcc users 14M May 15 18:49 model.pnml
=====================================================================
Generated by BenchKit 2-3637
Executing tool ltsmin
Input is BART-PT-060, examination is LTLFireability
Time confinement is 3600 seconds
Memory confinement is 16384 MBytes
Number of cores is 4
Run identifier is r221-ebro-152732363300032
=====================================================================
--------------------
content from stdout:
=== Data for post analysis generated by BenchKit (invocation template)
The expected result is a vector of booleans
BOOL_VECTOR
here is the order used to build the result vector(from text file)
FORMULA_NAME BART-PT-060-LTLFireability-00
FORMULA_NAME BART-PT-060-LTLFireability-01
FORMULA_NAME BART-PT-060-LTLFireability-02
FORMULA_NAME BART-PT-060-LTLFireability-03
FORMULA_NAME BART-PT-060-LTLFireability-04
FORMULA_NAME BART-PT-060-LTLFireability-05
FORMULA_NAME BART-PT-060-LTLFireability-06
FORMULA_NAME BART-PT-060-LTLFireability-07
FORMULA_NAME BART-PT-060-LTLFireability-08
FORMULA_NAME BART-PT-060-LTLFireability-09
FORMULA_NAME BART-PT-060-LTLFireability-10
FORMULA_NAME BART-PT-060-LTLFireability-11
FORMULA_NAME BART-PT-060-LTLFireability-12
FORMULA_NAME BART-PT-060-LTLFireability-13
FORMULA_NAME BART-PT-060-LTLFireability-14
FORMULA_NAME BART-PT-060-LTLFireability-15
=== Now, execution of the tool begins
BK_START 1527486749082
FORMULA BART-PT-060-LTLFireability-00 CANNOT_COMPUTE
FORMULA BART-PT-060-LTLFireability-01 CANNOT_COMPUTE
FORMULA BART-PT-060-LTLFireability-02 CANNOT_COMPUTE
FORMULA BART-PT-060-LTLFireability-03 CANNOT_COMPUTE
FORMULA BART-PT-060-LTLFireability-04 CANNOT_COMPUTE
FORMULA BART-PT-060-LTLFireability-05 CANNOT_COMPUTE
FORMULA BART-PT-060-LTLFireability-06 CANNOT_COMPUTE
FORMULA BART-PT-060-LTLFireability-07 CANNOT_COMPUTE
FORMULA BART-PT-060-LTLFireability-08 FALSE TECHNIQUES EXPLICIT PARALLEL_PROCESSING USE_NUPN
FORMULA BART-PT-060-LTLFireability-09 TRUE TECHNIQUES EXPLICIT PARALLEL_PROCESSING USE_NUPN
FORMULA BART-PT-060-LTLFireability-10 FALSE TECHNIQUES EXPLICIT PARALLEL_PROCESSING USE_NUPN
FORMULA BART-PT-060-LTLFireability-11 FALSE TECHNIQUES EXPLICIT PARALLEL_PROCESSING USE_NUPN
FORMULA BART-PT-060-LTLFireability-12 FALSE TECHNIQUES EXPLICIT PARALLEL_PROCESSING USE_NUPN
FORMULA BART-PT-060-LTLFireability-13 FALSE TECHNIQUES EXPLICIT PARALLEL_PROCESSING USE_NUPN
FORMULA BART-PT-060-LTLFireability-14 FALSE TECHNIQUES EXPLICIT PARALLEL_PROCESSING USE_NUPN
FORMULA BART-PT-060-LTLFireability-15 FALSE TECHNIQUES EXPLICIT PARALLEL_PROCESSING USE_NUPN
BK_STOP 1527488076755
--------------------
content from stderr:
mcc2018
ltl formula name BART-PT-060-LTLFireability-00
ltl formula formula --ltl=/tmp/ltl_0_
pnml2lts-mc( 0/ 4): Loading model from model.pnml
pnml2lts-mc( 0/ 4): Edge label is id
pnml2lts-mc( 0/ 4): Petri net has 8130 places, 12120 transitions and 97200 arcs
pnml2lts-mc( 0/ 4): Petri net BART-PT-060 analyzed
pnml2lts-mc( 0/ 4): There are no safe places
pnml2lts-mc( 0/ 4): Loading Petri net took 3.310 real 3.530 user 4.120 sys
pnml2lts-mc( 0/ 4): LTL layer: formula: /tmp/ltl_0_
pnml2lts-mc( 0/ 4), ** error **: syntax error near pos 3
ltl formula name BART-PT-060-LTLFireability-01
ltl formula formula --ltl=/tmp/ltl_1_
pnml2lts-mc( 0/ 4): Loading model from model.pnml
pnml2lts-mc( 0/ 4): Edge label is id
pnml2lts-mc( 0/ 4): Petri net has 8130 places, 12120 transitions and 97200 arcs
pnml2lts-mc( 0/ 4): Petri net BART-PT-060 analyzed
pnml2lts-mc( 0/ 4): There are no safe places
pnml2lts-mc( 0/ 4): Loading Petri net took 3.400 real 3.120 user 3.940 sys
pnml2lts-mc( 1/ 4): LTL layer: formula: /tmp/ltl_1_
ltl formula name BART-PT-060-LTLFireability-02
ltl formula formula --ltl=/tmp/ltl_2_
pnml2lts-mc( 0/ 4): Loading model from model.pnml
pnml2lts-mc( 0/ 4): Edge label is id
pnml2lts-mc( 0/ 4): Petri net has 8130 places, 12120 transitions and 97200 arcs
pnml2lts-mc( 0/ 4): Petri net BART-PT-060 analyzed
pnml2lts-mc( 0/ 4): There are no safe places
pnml2lts-mc( 0/ 4): Loading Petri net took 2.450 real 3.120 user 3.470 sys
pnml2lts-mc( 1/ 4): LTL layer: formula: /tmp/ltl_2_
pnml2lts-mc( 1/ 4), ** error **: syntax error near pos 174777
ltl formula name BART-PT-060-LTLFireability-03
ltl formula formula --ltl=/tmp/ltl_3_
pnml2lts-mc( 0/ 4): Loading model from model.pnml
pnml2lts-mc( 0/ 4): Edge label is id
pnml2lts-mc( 0/ 4): Petri net has 8130 places, 12120 transitions and 97200 arcs
pnml2lts-mc( 0/ 4): Petri net BART-PT-060 analyzed
pnml2lts-mc( 0/ 4): There are no safe places
pnml2lts-mc( 0/ 4): Loading Petri net took 2.420 real 3.050 user 3.480 sys
pnml2lts-mc( 3/ 4): LTL layer: formula: /tmp/ltl_3_
pnml2lts-mc( 3/ 4), ** error **: syntax error near pos 174785
ltl formula name BART-PT-060-LTLFireability-04
ltl formula formula --ltl=/tmp/ltl_4_
pnml2lts-mc( 0/ 4): Loading model from model.pnml
pnml2lts-mc( 0/ 4): Edge label is id
pnml2lts-mc( 0/ 4): Petri net has 8130 places, 12120 transitions and 97200 arcs
pnml2lts-mc( 0/ 4): Petri net BART-PT-060 analyzed
pnml2lts-mc( 0/ 4): There are no safe places
pnml2lts-mc( 0/ 4): Loading Petri net took 2.430 real 3.160 user 3.490 sys
pnml2lts-mc( 2/ 4): LTL layer: formula: /tmp/ltl_4_
ltl formula name BART-PT-060-LTLFireability-05
ltl formula formula --ltl=/tmp/ltl_5_
pnml2lts-mc( 0/ 4): Loading model from model.pnml
pnml2lts-mc( 0/ 4): Edge label is id
pnml2lts-mc( 0/ 4): Petri net has 8130 places, 12120 transitions and 97200 arcs
pnml2lts-mc( 0/ 4): Petri net BART-PT-060 analyzed
pnml2lts-mc( 0/ 4): There are no safe places
pnml2lts-mc( 0/ 4): Loading Petri net took 6.530 real 3.630 user 13.520 sys
pnml2lts-mc( 3/ 4): LTL layer: formula: /tmp/ltl_5_
ltl formula name BART-PT-060-LTLFireability-06
ltl formula formula --ltl=/tmp/ltl_6_
pnml2lts-mc( 0/ 4): Loading model from model.pnml
pnml2lts-mc( 0/ 4): Edge label is id
pnml2lts-mc( 0/ 4): Petri net has 8130 places, 12120 transitions and 97200 arcs
pnml2lts-mc( 0/ 4): Petri net BART-PT-060 analyzed
pnml2lts-mc( 0/ 4): There are no safe places
pnml2lts-mc( 0/ 4): Loading Petri net took 6.920 real 3.180 user 12.960 sys
pnml2lts-mc( 0/ 4): LTL layer: formula: /tmp/ltl_6_
ltl formula name BART-PT-060-LTLFireability-07
ltl formula formula --ltl=/tmp/ltl_7_
pnml2lts-mc( 0/ 4): Loading model from model.pnml
pnml2lts-mc( 0/ 4): Edge label is id
pnml2lts-mc( 0/ 4): Petri net has 8130 places, 12120 transitions and 97200 arcs
pnml2lts-mc( 0/ 4): Petri net BART-PT-060 analyzed
pnml2lts-mc( 0/ 4): There are no safe places
pnml2lts-mc( 0/ 4): Loading Petri net took 2.690 real 3.230 user 3.690 sys
pnml2lts-mc( 0/ 4): LTL layer: formula: /tmp/ltl_7_
ltl formula name BART-PT-060-LTLFireability-08
ltl formula formula --ltl=/tmp/ltl_8_
pnml2lts-mc( 0/ 4): Loading model from model.pnml
pnml2lts-mc( 0/ 4): Edge label is id
pnml2lts-mc( 0/ 4): Petri net has 8130 places, 12120 transitions and 97200 arcs
pnml2lts-mc( 0/ 4): Petri net BART-PT-060 analyzed
pnml2lts-mc( 0/ 4): There are no safe places
pnml2lts-mc( 0/ 4): Loading Petri net took 3.260 real 3.420 user 3.940 sys
pnml2lts-mc( 1/ 4): LTL layer: formula: /tmp/ltl_8_
pnml2lts-mc( 0/ 4): There are 8131 state labels and 1 edge labels
pnml2lts-mc( 0/ 4): State length is 8131, there are 12124 groups
pnml2lts-mc( 0/ 4): Running ufscc using 4 cores
pnml2lts-mc( 0/ 4): Using a tree table with 2^30 elements
pnml2lts-mc( 0/ 4): Successor permutation: dynamic
pnml2lts-mc( 0/ 4): Global bits: 0, count bits: 0, local bits: 0
pnml2lts-mc( 3/ 4):
pnml2lts-mc( 3/ 4): Accepting cycle FOUND at depth ~132!
pnml2lts-mc( 3/ 4):
pnml2lts-mc( 0/ 4):
pnml2lts-mc( 0/ 4): total scc count: 0
pnml2lts-mc( 0/ 4): unique states count: 523
pnml2lts-mc( 0/ 4): unique transitions count: 326355
pnml2lts-mc( 0/ 4): - self-loop count: 0
pnml2lts-mc( 0/ 4): - claim dead count: 0
pnml2lts-mc( 0/ 4): - claim found count: 1
pnml2lts-mc( 0/ 4): - claim success count: 526
pnml2lts-mc( 0/ 4): - cum. max stack depth: 526
pnml2lts-mc( 0/ 4):
pnml2lts-mc( 0/ 4): Explored 526 states 332839 transitions, fanout: 632.774
pnml2lts-mc( 0/ 4): Total exploration time 11.770 sec (11.730 sec minimum, 11.748 sec on average)
pnml2lts-mc( 0/ 4): States per second: 45, Transitions per second: 28279
pnml2lts-mc( 0/ 4):
pnml2lts-mc( 0/ 4): Queue width: 12B, total height: 0, memory: 0.00MB
pnml2lts-mc( 0/ 4): Tree memory: 6.8MB, 21.7 B/state, compr.: 0.1%
pnml2lts-mc( 0/ 4): Tree fill ratio (roots/leafs): 0.0%/0.0%
pnml2lts-mc( 0/ 4): Stored 12365 string chucks using 0MB
pnml2lts-mc( 0/ 4): Total memory used for chunk indexing: 0MB
pnml2lts-mc( 0/ 4): Est. total memory use: 6.8MB (~8192.0MB paged-in)
ltl formula name BART-PT-060-LTLFireability-09
ltl formula formula --ltl=/tmp/ltl_9_
pnml2lts-mc( 0/ 4): Loading model from model.pnml
pnml2lts-mc( 0/ 4): Edge label is id
pnml2lts-mc( 0/ 4): Petri net has 8130 places, 12120 transitions and 97200 arcs
pnml2lts-mc( 0/ 4): Petri net BART-PT-060 analyzed
pnml2lts-mc( 0/ 4): There are no safe places
pnml2lts-mc( 0/ 4): Loading Petri net took 6.410 real 3.350 user 11.130 sys
pnml2lts-mc( 0/ 4): LTL layer: formula: /tmp/ltl_9_
pnml2lts-mc( 0/ 4): buchi has 2 states
pnml2lts-mc( 0/ 4): Weak Buchi automaton detected, adding non-accepting as progress label.
pnml2lts-mc( 0/ 4): There are 8132 state labels and 1 edge labels
pnml2lts-mc( 0/ 4): State length is 8131, there are 12122 groups
pnml2lts-mc( 0/ 4): Running ufscc using 4 cores
pnml2lts-mc( 0/ 4): Using a tree table with 2^30 elements
pnml2lts-mc( 0/ 4): Successor permutation: dynamic
pnml2lts-mc( 0/ 4): Global bits: 0, count bits: 0, local bits: 0
pnml2lts-mc( 0/ 4):
pnml2lts-mc( 0/ 4): total scc count: 1
pnml2lts-mc( 0/ 4): unique states count: 1
pnml2lts-mc( 0/ 4): unique transitions count: 0
pnml2lts-mc( 0/ 4): - self-loop count: 0
pnml2lts-mc( 0/ 4): - claim dead count: 0
pnml2lts-mc( 0/ 4): - claim found count: 0
pnml2lts-mc( 0/ 4): - claim success count: 4
pnml2lts-mc( 0/ 4): - cum. max stack depth: 4
pnml2lts-mc( 0/ 4):
pnml2lts-mc( 0/ 4): Explored 4 states 4 transitions, fanout: 1.000
pnml2lts-mc( 0/ 4): Total exploration time 0.080 sec (0.030 sec minimum, 0.055 sec on average)
pnml2lts-mc( 0/ 4): States per second: 50, Transitions per second: 50
pnml2lts-mc( 0/ 4):
pnml2lts-mc( 0/ 4): Queue width: 12B, total height: 0, memory: 0.00MB
pnml2lts-mc( 0/ 4): Tree memory: 0.0MB, 208.0 B/state, compr.: 0.6%
pnml2lts-mc( 0/ 4): Tree fill ratio (roots/leafs): 0.0%/0.0%
pnml2lts-mc( 0/ 4): Stored 12365 string chucks using 0MB
pnml2lts-mc( 0/ 4): Total memory used for chunk indexing: 0MB
pnml2lts-mc( 0/ 4): Est. total memory use: 0.0MB (~8192.0MB paged-in)
ltl formula name BART-PT-060-LTLFireability-10
ltl formula formula --ltl=/tmp/ltl_10_
pnml2lts-mc( 0/ 4): Loading model from model.pnml
pnml2lts-mc( 0/ 4): Edge label is id
pnml2lts-mc( 0/ 4): Petri net has 8130 places, 12120 transitions and 97200 arcs
pnml2lts-mc( 0/ 4): Petri net BART-PT-060 analyzed
pnml2lts-mc( 2/ 4): LTL layer: formula: /tmp/ltl_10_
pnml2lts-mc( 0/ 4): There are no safe places
pnml2lts-mc( 0/ 4): Loading Petri net took 8.410 real 4.430 user 14.170 sys
pnml2lts-mc( 0/ 4): Weak Buchi automaton detected, adding non-accepting as progress label.
pnml2lts-mc( 0/ 4): There are 8132 state labels and 1 edge labels
pnml2lts-mc( 0/ 4): State length is 8131, there are 12129 groups
pnml2lts-mc( 0/ 4): Running ufscc using 4 cores
pnml2lts-mc( 0/ 4): Using a tree table with 2^30 elements
pnml2lts-mc( 0/ 4): Successor permutation: dynamic
pnml2lts-mc( 0/ 4): Global bits: 0, count bits: 0, local bits: 0
pnml2lts-mc( 3/ 4):
pnml2lts-mc( 3/ 4): Accepting cycle FOUND at depth ~144!
pnml2lts-mc( 3/ 4):
pnml2lts-mc( 0/ 4):
pnml2lts-mc( 0/ 4): total scc count: 0
pnml2lts-mc( 0/ 4): unique states count: 559
pnml2lts-mc( 0/ 4): unique transitions count: 321772
pnml2lts-mc( 0/ 4): - self-loop count: 0
pnml2lts-mc( 0/ 4): - claim dead count: 0
pnml2lts-mc( 0/ 4): - claim found count: 1
pnml2lts-mc( 0/ 4): - claim success count: 562
pnml2lts-mc( 0/ 4): - cum. max stack depth: 562
pnml2lts-mc( 0/ 4):
pnml2lts-mc( 0/ 4): Explored 562 states 328256 transitions, fanout: 584.085
pnml2lts-mc( 0/ 4): Total exploration time 13.190 sec (13.150 sec minimum, 13.175 sec on average)
pnml2lts-mc( 0/ 4): States per second: 43, Transitions per second: 24887
pnml2lts-mc( 0/ 4):
pnml2lts-mc( 0/ 4): Queue width: 12B, total height: 0, memory: 0.00MB
pnml2lts-mc( 0/ 4): Tree memory: 6.7MB, 21.7 B/state, compr.: 0.1%
pnml2lts-mc( 0/ 4): Tree fill ratio (roots/leafs): 0.0%/0.0%
pnml2lts-mc( 0/ 4): Stored 12365 string chucks using 0MB
pnml2lts-mc( 0/ 4): Total memory used for chunk indexing: 0MB
pnml2lts-mc( 0/ 4): Est. total memory use: 6.7MB (~8192.0MB paged-in)
ltl formula name BART-PT-060-LTLFireability-11
ltl formula formula --ltl=/tmp/ltl_11_
pnml2lts-mc( 0/ 4): Loading model from model.pnml
pnml2lts-mc( 0/ 4): Edge label is id
pnml2lts-mc( 0/ 4): Petri net has 8130 places, 12120 transitions and 97200 arcs
pnml2lts-mc( 0/ 4): Petri net BART-PT-060 analyzed
pnml2lts-mc( 0/ 4): There are no safe places
pnml2lts-mc( 0/ 4): Loading Petri net took 2.450 real 3.270 user 3.400 sys
pnml2lts-mc( 0/ 4): LTL layer: formula: /tmp/ltl_11_
pnml2lts-mc( 0/ 4): buchi has 2 states
pnml2lts-mc( 0/ 4): Weak Buchi automaton detected, adding non-accepting as progress label.
pnml2lts-mc( 0/ 4): There are 8132 state labels and 1 edge labels
pnml2lts-mc( 0/ 4): State length is 8131, there are 12123 groups
pnml2lts-mc( 0/ 4): Running ufscc using 4 cores
pnml2lts-mc( 0/ 4): Using a tree table with 2^30 elements
pnml2lts-mc( 0/ 4): Successor permutation: dynamic
pnml2lts-mc( 0/ 4): Global bits: 0, count bits: 0, local bits: 0
pnml2lts-mc( 1/ 4):
pnml2lts-mc( 1/ 4): Accepting cycle FOUND at depth ~142!
pnml2lts-mc( 1/ 4):
pnml2lts-mc( 0/ 4):
pnml2lts-mc( 0/ 4): total scc count: 0
pnml2lts-mc( 0/ 4): unique states count: 611
pnml2lts-mc( 0/ 4): unique transitions count: 599995
pnml2lts-mc( 0/ 4): - self-loop count: 0
pnml2lts-mc( 0/ 4): - claim dead count: 0
pnml2lts-mc( 0/ 4): - claim found count: 3
pnml2lts-mc( 0/ 4): - claim success count: 614
pnml2lts-mc( 0/ 4): - cum. max stack depth: 614
pnml2lts-mc( 0/ 4):
pnml2lts-mc( 0/ 4): Explored 614 states 612959 transitions, fanout: 998.305
pnml2lts-mc( 0/ 4): Total exploration time 15.770 sec (15.740 sec minimum, 15.752 sec on average)
pnml2lts-mc( 0/ 4): States per second: 39, Transitions per second: 38869
pnml2lts-mc( 0/ 4):
pnml2lts-mc( 0/ 4): Queue width: 12B, total height: 0, memory: 0.00MB
pnml2lts-mc( 0/ 4): Tree memory: 10.8MB, 18.9 B/state, compr.: 0.1%
pnml2lts-mc( 0/ 4): Tree fill ratio (roots/leafs): 0.0%/0.0%
pnml2lts-mc( 0/ 4): Stored 12365 string chucks using 0MB
pnml2lts-mc( 0/ 4): Total memory used for chunk indexing: 0MB
pnml2lts-mc( 0/ 4): Est. total memory use: 10.8MB (~8192.0MB paged-in)
ltl formula name BART-PT-060-LTLFireability-12
ltl formula formula --ltl=/tmp/ltl_12_
pnml2lts-mc( 0/ 4): Loading model from model.pnml
pnml2lts-mc( 0/ 4): Edge label is id
pnml2lts-mc( 0/ 4): Petri net has 8130 places, 12120 transitions and 97200 arcs
pnml2lts-mc( 0/ 4): Petri net BART-PT-060 analyzed
pnml2lts-mc( 3/ 4): LTL layer: formula: /tmp/ltl_12_
pnml2lts-mc( 0/ 4): There are no safe places
pnml2lts-mc( 0/ 4): Loading Petri net took 7.490 real 4.290 user 15.620 sys
pnml2lts-mc( 0/ 4): Weak Buchi automaton detected, adding non-accepting as progress label.
pnml2lts-mc( 0/ 4): There are 8132 state labels and 1 edge labels
pnml2lts-mc( 0/ 4): State length is 8131, there are 12122 groups
pnml2lts-mc( 0/ 4): Running ufscc using 4 cores
pnml2lts-mc( 0/ 4): Using a tree table with 2^30 elements
pnml2lts-mc( 0/ 4): Successor permutation: dynamic
pnml2lts-mc( 0/ 4): Global bits: 0, count bits: 0, local bits: 0
pnml2lts-mc( 3/ 4):
pnml2lts-mc( 3/ 4): Accepting cycle FOUND at depth ~167!
pnml2lts-mc( 3/ 4):
pnml2lts-mc( 0/ 4):
pnml2lts-mc( 0/ 4): total scc count: 0
pnml2lts-mc( 0/ 4): unique states count: 654
pnml2lts-mc( 0/ 4): unique transitions count: 332522
pnml2lts-mc( 0/ 4): - self-loop count: 0
pnml2lts-mc( 0/ 4): - claim dead count: 0
pnml2lts-mc( 0/ 4): - claim found count: 1
pnml2lts-mc( 0/ 4): - claim success count: 657
pnml2lts-mc( 0/ 4): - cum. max stack depth: 657
pnml2lts-mc( 0/ 4):
pnml2lts-mc( 0/ 4): Explored 657 states 339006 transitions, fanout: 515.991
pnml2lts-mc( 0/ 4): Total exploration time 12.730 sec (12.700 sec minimum, 12.713 sec on average)
pnml2lts-mc( 0/ 4): States per second: 52, Transitions per second: 26630
pnml2lts-mc( 0/ 4):
pnml2lts-mc( 0/ 4): Queue width: 12B, total height: 0, memory: 0.00MB
pnml2lts-mc( 0/ 4): Tree memory: 6.8MB, 21.5 B/state, compr.: 0.1%
pnml2lts-mc( 0/ 4): Tree fill ratio (roots/leafs): 0.0%/0.0%
pnml2lts-mc( 0/ 4): Stored 12365 string chucks using 0MB
pnml2lts-mc( 0/ 4): Total memory used for chunk indexing: 0MB
pnml2lts-mc( 0/ 4): Est. total memory use: 6.8MB (~8192.0MB paged-in)
ltl formula name BART-PT-060-LTLFireability-13
ltl formula formula --ltl=/tmp/ltl_13_
pnml2lts-mc( 0/ 4): Loading model from model.pnml
pnml2lts-mc( 0/ 4): Edge label is id
pnml2lts-mc( 0/ 4): Petri net has 8130 places, 12120 transitions and 97200 arcs
pnml2lts-mc( 0/ 4): Petri net BART-PT-060 analyzed
pnml2lts-mc( 0/ 4): There are no safe places
pnml2lts-mc( 0/ 4): Loading Petri net took 2.450 real 3.280 user 3.520 sys
pnml2lts-mc( 3/ 4): LTL layer: formula: /tmp/ltl_13_
pnml2lts-mc( 0/ 4): Weak Buchi automaton detected, adding non-accepting as progress label.
pnml2lts-mc( 0/ 4): There are 8132 state labels and 1 edge labels
pnml2lts-mc( 0/ 4): State length is 8131, there are 12123 groups
pnml2lts-mc( 0/ 4): Running ufscc using 4 cores
pnml2lts-mc( 0/ 4): Using a tree table with 2^30 elements
pnml2lts-mc( 0/ 4): Successor permutation: dynamic
pnml2lts-mc( 0/ 4): Global bits: 0, count bits: 0, local bits: 0
pnml2lts-mc( 3/ 4):
pnml2lts-mc( 3/ 4): Accepting cycle FOUND at depth ~119!
pnml2lts-mc( 3/ 4):
pnml2lts-mc( 0/ 4):
pnml2lts-mc( 0/ 4): total scc count: 160
pnml2lts-mc( 0/ 4): unique states count: 690
pnml2lts-mc( 0/ 4): unique transitions count: 323590
pnml2lts-mc( 0/ 4): - self-loop count: 0
pnml2lts-mc( 0/ 4): - claim dead count: 3
pnml2lts-mc( 0/ 4): - claim found count: 1
pnml2lts-mc( 0/ 4): - claim success count: 695
pnml2lts-mc( 0/ 4): - cum. max stack depth: 534
pnml2lts-mc( 0/ 4):
pnml2lts-mc( 0/ 4): Explored 695 states 332200 transitions, fanout: 477.986
pnml2lts-mc( 0/ 4): Total exploration time 13.240 sec (13.190 sec minimum, 13.215 sec on average)
pnml2lts-mc( 0/ 4): States per second: 52, Transitions per second: 25091
pnml2lts-mc( 0/ 4):
pnml2lts-mc( 0/ 4): Queue width: 12B, total height: 0, memory: 0.00MB
pnml2lts-mc( 0/ 4): Tree memory: 6.7MB, 21.7 B/state, compr.: 0.1%
pnml2lts-mc( 0/ 4): Tree fill ratio (roots/leafs): 0.0%/0.0%
pnml2lts-mc( 0/ 4): Stored 12365 string chucks using 0MB
pnml2lts-mc( 0/ 4): Total memory used for chunk indexing: 0MB
pnml2lts-mc( 0/ 4): Est. total memory use: 6.7MB (~8192.0MB paged-in)
ltl formula name BART-PT-060-LTLFireability-14
ltl formula formula --ltl=/tmp/ltl_14_
pnml2lts-mc( 0/ 4): Loading model from model.pnml
pnml2lts-mc( 0/ 4): Edge label is id
pnml2lts-mc( 0/ 4): Petri net has 8130 places, 12120 transitions and 97200 arcs
pnml2lts-mc( 0/ 4): Petri net BART-PT-060 analyzed
pnml2lts-mc( 0/ 4): There are no safe places
pnml2lts-mc( 0/ 4): Loading Petri net took 2.400 real 3.080 user 3.450 sys
pnml2lts-mc( 3/ 4): LTL layer: formula: /tmp/ltl_14_
pnml2lts-mc( 0/ 4): There are 8131 state labels and 1 edge labels
pnml2lts-mc( 0/ 4): State length is 8131, there are 12131 groups
pnml2lts-mc( 0/ 4): Running ufscc using 4 cores
pnml2lts-mc( 0/ 4): Using a tree table with 2^30 elements
pnml2lts-mc( 0/ 4): Successor permutation: dynamic
pnml2lts-mc( 0/ 4): Global bits: 0, count bits: 0, local bits: 0
pnml2lts-mc( 3/ 4):
pnml2lts-mc( 3/ 4): Accepting cycle FOUND at depth ~161!
pnml2lts-mc( 3/ 4):
pnml2lts-mc( 0/ 4):
pnml2lts-mc( 0/ 4): total scc count: 0
pnml2lts-mc( 0/ 4): unique states count: 646
pnml2lts-mc( 0/ 4): unique transitions count: 328182
pnml2lts-mc( 0/ 4): - self-loop count: 0
pnml2lts-mc( 0/ 4): - claim dead count: 0
pnml2lts-mc( 0/ 4): - claim found count: 1
pnml2lts-mc( 0/ 4): - claim success count: 649
pnml2lts-mc( 0/ 4): - cum. max stack depth: 649
pnml2lts-mc( 0/ 4):
pnml2lts-mc( 0/ 4): Explored 649 states 334666 transitions, fanout: 515.664
pnml2lts-mc( 0/ 4): Total exploration time 12.720 sec (12.690 sec minimum, 12.702 sec on average)
pnml2lts-mc( 0/ 4): States per second: 51, Transitions per second: 26310
pnml2lts-mc( 0/ 4):
pnml2lts-mc( 0/ 4): Queue width: 12B, total height: 0, memory: 0.00MB
pnml2lts-mc( 0/ 4): Tree memory: 6.8MB, 21.8 B/state, compr.: 0.1%
pnml2lts-mc( 0/ 4): Tree fill ratio (roots/leafs): 0.0%/0.0%
pnml2lts-mc( 0/ 4): Stored 12365 string chucks using 0MB
pnml2lts-mc( 0/ 4): Total memory used for chunk indexing: 0MB
pnml2lts-mc( 0/ 4): Est. total memory use: 6.8MB (~8192.0MB paged-in)
ltl formula name BART-PT-060-LTLFireability-15
ltl formula formula --ltl=/tmp/ltl_15_
pnml2lts-mc( 0/ 4): Loading model from model.pnml
pnml2lts-mc( 0/ 4): Edge label is id
pnml2lts-mc( 0/ 4): Petri net has 8130 places, 12120 transitions and 97200 arcs
pnml2lts-mc( 0/ 4): Petri net BART-PT-060 analyzed
pnml2lts-mc( 0/ 4): There are no safe places
pnml2lts-mc( 0/ 4): Loading Petri net took 3.760 real 3.500 user 4.780 sys
pnml2lts-mc( 1/ 4): LTL layer: formula: /tmp/ltl_15_
pnml2lts-mc( 0/ 4): Weak Buchi automaton detected, adding non-accepting as progress label.
pnml2lts-mc( 0/ 4): There are 8132 state labels and 1 edge labels
pnml2lts-mc( 0/ 4): State length is 8131, there are 12123 groups
pnml2lts-mc( 0/ 4): Running ufscc using 4 cores
pnml2lts-mc( 0/ 4): Using a tree table with 2^30 elements
pnml2lts-mc( 0/ 4): Successor permutation: dynamic
pnml2lts-mc( 0/ 4): Global bits: 0, count bits: 0, local bits: 0
pnml2lts-mc( 3/ 4):
pnml2lts-mc( 3/ 4): Accepting cycle FOUND at depth ~164!
pnml2lts-mc( 3/ 4):
pnml2lts-mc( 0/ 4):
pnml2lts-mc( 0/ 4): total scc count: 0
pnml2lts-mc( 0/ 4): unique states count: 664
pnml2lts-mc( 0/ 4): unique transitions count: 335360
pnml2lts-mc( 0/ 4): - self-loop count: 0
pnml2lts-mc( 0/ 4): - claim dead count: 0
pnml2lts-mc( 0/ 4): - claim found count: 1
pnml2lts-mc( 0/ 4): - claim success count: 667
pnml2lts-mc( 0/ 4): - cum. max stack depth: 667
pnml2lts-mc( 0/ 4):
pnml2lts-mc( 0/ 4): Explored 667 states 341844 transitions, fanout: 512.510
pnml2lts-mc( 0/ 4): Total exploration time 12.770 sec (12.740 sec minimum, 12.755 sec on average)
pnml2lts-mc( 0/ 4): States per second: 52, Transitions per second: 26769
pnml2lts-mc( 0/ 4):
pnml2lts-mc( 0/ 4): Queue width: 12B, total height: 0, memory: 0.00MB
pnml2lts-mc( 0/ 4): Tree memory: 6.9MB, 21.5 B/state, compr.: 0.1%
pnml2lts-mc( 0/ 4): Tree fill ratio (roots/leafs): 0.0%/0.0%
pnml2lts-mc( 0/ 4): Stored 12365 string chucks using 0MB
pnml2lts-mc( 0/ 4): Total memory used for chunk indexing: 0MB
pnml2lts-mc( 0/ 4): Est. total memory use: 6.9MB (~8192.0MB paged-in)
Sequence of Actions to be Executed by the VM
This is useful if one wants to reexecute the tool in the VM from the submitted image disk.
set -x
# this is for BenchKit: configuration of major elements for the test
export BK_INPUT="BART-PT-060"
export BK_EXAMINATION="LTLFireability"
export BK_TOOL="ltsmin"
export BK_RESULT_DIR="/tmp/BK_RESULTS/OUTPUTS"
export BK_TIME_CONFINEMENT="3600"
export BK_MEMORY_CONFINEMENT="16384"
# this is specific to your benchmark or test
export BIN_DIR="$HOME/BenchKit/bin"
# remove the execution directoty if it exists (to avoid increse of .vmdk images)
if [ -d execution ] ; then
rm -rf execution
fi
tar xzf /home/mcc/BenchKit/INPUTS/BART-PT-060.tgz
mv BART-PT-060 execution
cd execution
pwd
ls -lh
# this is for BenchKit: explicit launching of the test
echo "====================================================================="
echo " Generated by BenchKit 2-3637"
echo " Executing tool ltsmin"
echo " Input is BART-PT-060, examination is LTLFireability"
echo " Time confinement is $BK_TIME_CONFINEMENT seconds"
echo " Memory confinement is 16384 MBytes"
echo " Number of cores is 4"
echo " Run identifier is r221-ebro-152732363300032"
echo "====================================================================="
echo
echo "--------------------"
echo "content from stdout:"
echo
echo "=== Data for post analysis generated by BenchKit (invocation template)"
echo
if [ "LTLFireability" = "UpperBounds" ] ; then
echo "The expected result is a vector of positive values"
echo NUM_VECTOR
elif [ "LTLFireability" != "StateSpace" ] ; then
echo "The expected result is a vector of booleans"
echo BOOL_VECTOR
else
echo "no data necessary for post analysis"
fi
echo
if [ -f "LTLFireability.txt" ] ; then
echo "here is the order used to build the result vector(from text file)"
for x in $(grep Property LTLFireability.txt | cut -d ' ' -f 2 | sort -u) ; do
echo "FORMULA_NAME $x"
done
elif [ -f "LTLFireability.xml" ] ; then # for cunf (txt files deleted;-)
echo echo "here is the order used to build the result vector(from xml file)"
for x in $(grep '
echo "FORMULA_NAME $x"
done
fi
echo
echo "=== Now, execution of the tool begins"
echo
echo -n "BK_START "
date -u +%s%3N
echo
timeout -s 9 $BK_TIME_CONFINEMENT bash -c "/home/mcc/BenchKit/BenchKit_head.sh 2> STDERR ; echo ; echo -n \"BK_STOP \" ; date -u +%s%3N"
if [ $? -eq 137 ] ; then
echo
echo "BK_TIME_CONFINEMENT_REACHED"
fi
echo
echo "--------------------"
echo "content from stderr:"
echo
cat STDERR ;