

About the Execution of LTSMin for BART-PT-050
| Execution Summary | |||||
| Max Memory Used (MB) |
Time wait (ms) | CPU Usage (ms) | I/O Wait (ms) | Computed Result | Execution Status |
| 3399.680 | 1334138.00 | 1880766.00 | 291.40 | ????????FFFFFFFF | normal |
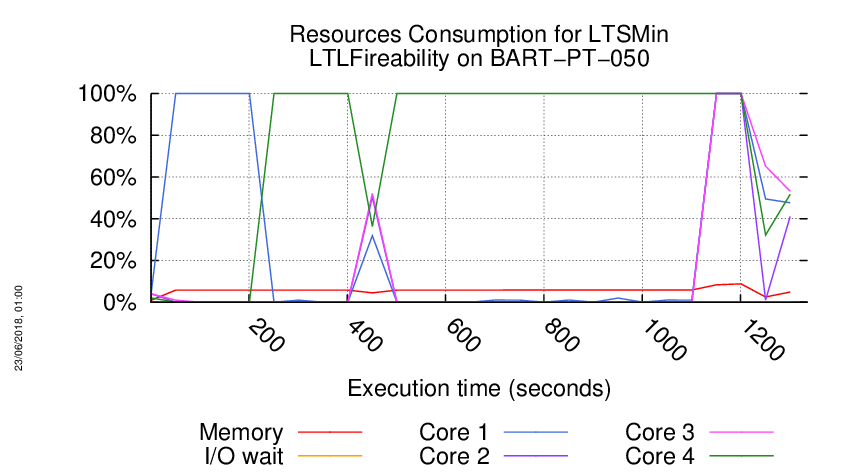
Execution Chart
We display below the execution chart for this examination (boot time has been removed).
Trace from the execution
Waiting for the VM to be ready (probing ssh)
....................
/home/mcc/execution
total 32M
-rw-r--r-- 1 mcc users 1.2M May 15 18:54 CTLCardinality.txt
-rw-r--r-- 1 mcc users 2.8M May 15 18:54 CTLCardinality.xml
-rw-r--r-- 1 mcc users 1.5M May 15 18:54 CTLFireability.txt
-rw-r--r-- 1 mcc users 3.6M May 15 18:54 CTLFireability.xml
-rw-r--r-- 1 mcc users 4.0K May 15 18:49 GenericPropertiesDefinition.xml
-rw-r--r-- 1 mcc users 6.1K May 15 18:49 GenericPropertiesVerdict.xml
-rw-r--r-- 1 mcc users 721K May 26 09:26 LTLCardinality.txt
-rw-r--r-- 1 mcc users 1.8M May 26 09:26 LTLCardinality.xml
-rw-r--r-- 1 mcc users 530K May 26 09:26 LTLFireability.txt
-rw-r--r-- 1 mcc users 1.3M May 26 09:26 LTLFireability.xml
-rw-r--r-- 1 mcc users 1.2M May 15 18:54 ReachabilityCardinality.txt
-rw-r--r-- 1 mcc users 2.8M May 15 18:54 ReachabilityCardinality.xml
-rw-r--r-- 1 mcc users 102 May 15 18:54 ReachabilityDeadlock.txt
-rw-r--r-- 1 mcc users 340 May 15 18:54 ReachabilityDeadlock.xml
-rw-r--r-- 1 mcc users 918K May 15 18:54 ReachabilityFireability.txt
-rw-r--r-- 1 mcc users 2.2M May 15 18:54 ReachabilityFireability.xml
-rw-r--r-- 1 mcc users 15K May 15 18:54 UpperBounds.txt
-rw-r--r-- 1 mcc users 29K May 15 18:54 UpperBounds.xml
-rw-r--r-- 1 mcc users 5 May 15 18:49 equiv_col
-rw-r--r-- 1 mcc users 4 May 15 18:49 instance
-rw-r--r-- 1 mcc users 6 May 15 18:49 iscolored
-rw-r--r-- 1 mcc users 12M May 15 18:49 model.pnml
=====================================================================
Generated by BenchKit 2-3637
Executing tool ltsmin
Input is BART-PT-050, examination is LTLFireability
Time confinement is 3600 seconds
Memory confinement is 16384 MBytes
Number of cores is 4
Run identifier is r221-ebro-152732363300030
=====================================================================
--------------------
content from stdout:
=== Data for post analysis generated by BenchKit (invocation template)
The expected result is a vector of booleans
BOOL_VECTOR
here is the order used to build the result vector(from text file)
FORMULA_NAME BART-PT-050-LTLFireability-00
FORMULA_NAME BART-PT-050-LTLFireability-01
FORMULA_NAME BART-PT-050-LTLFireability-02
FORMULA_NAME BART-PT-050-LTLFireability-03
FORMULA_NAME BART-PT-050-LTLFireability-04
FORMULA_NAME BART-PT-050-LTLFireability-05
FORMULA_NAME BART-PT-050-LTLFireability-06
FORMULA_NAME BART-PT-050-LTLFireability-07
FORMULA_NAME BART-PT-050-LTLFireability-08
FORMULA_NAME BART-PT-050-LTLFireability-09
FORMULA_NAME BART-PT-050-LTLFireability-10
FORMULA_NAME BART-PT-050-LTLFireability-11
FORMULA_NAME BART-PT-050-LTLFireability-12
FORMULA_NAME BART-PT-050-LTLFireability-13
FORMULA_NAME BART-PT-050-LTLFireability-14
FORMULA_NAME BART-PT-050-LTLFireability-15
=== Now, execution of the tool begins
BK_START 1527486291938
FORMULA BART-PT-050-LTLFireability-00 CANNOT_COMPUTE
FORMULA BART-PT-050-LTLFireability-01 CANNOT_COMPUTE
FORMULA BART-PT-050-LTLFireability-02 CANNOT_COMPUTE
FORMULA BART-PT-050-LTLFireability-03 CANNOT_COMPUTE
FORMULA BART-PT-050-LTLFireability-04 CANNOT_COMPUTE
FORMULA BART-PT-050-LTLFireability-05 CANNOT_COMPUTE
FORMULA BART-PT-050-LTLFireability-06 CANNOT_COMPUTE
FORMULA BART-PT-050-LTLFireability-07 CANNOT_COMPUTE
FORMULA BART-PT-050-LTLFireability-08 FALSE TECHNIQUES EXPLICIT PARALLEL_PROCESSING USE_NUPN
FORMULA BART-PT-050-LTLFireability-09 FALSE TECHNIQUES EXPLICIT PARALLEL_PROCESSING USE_NUPN
FORMULA BART-PT-050-LTLFireability-10 FALSE TECHNIQUES EXPLICIT PARALLEL_PROCESSING USE_NUPN
FORMULA BART-PT-050-LTLFireability-11 FALSE TECHNIQUES EXPLICIT PARALLEL_PROCESSING USE_NUPN
FORMULA BART-PT-050-LTLFireability-12 FALSE TECHNIQUES EXPLICIT PARALLEL_PROCESSING USE_NUPN
FORMULA BART-PT-050-LTLFireability-13 FALSE TECHNIQUES EXPLICIT PARALLEL_PROCESSING USE_NUPN
FORMULA BART-PT-050-LTLFireability-14 FALSE TECHNIQUES EXPLICIT PARALLEL_PROCESSING USE_NUPN
FORMULA BART-PT-050-LTLFireability-15 FALSE TECHNIQUES EXPLICIT PARALLEL_PROCESSING USE_NUPN
BK_STOP 1527487626076
--------------------
content from stderr:
mcc2018
ltl formula name BART-PT-050-LTLFireability-00
ltl formula formula --ltl=/tmp/ltl_0_
pnml2lts-mc( 0/ 4): Loading model from model.pnml
pnml2lts-mc( 0/ 4): Edge label is id
pnml2lts-mc( 0/ 4): Petri net has 6810 places, 10100 transitions and 81000 arcs
pnml2lts-mc( 0/ 4): Petri net BART-PT-050 analyzed
pnml2lts-mc( 0/ 4): There are no safe places
pnml2lts-mc( 0/ 4): Loading Petri net took 3.100 real 2.890 user 5.220 sys
pnml2lts-mc( 1/ 4): LTL layer: formula: /tmp/ltl_0_
ltl formula name BART-PT-050-LTLFireability-01
ltl formula formula --ltl=/tmp/ltl_1_
pnml2lts-mc( 0/ 4): Loading model from model.pnml
pnml2lts-mc( 0/ 4): Edge label is id
pnml2lts-mc( 0/ 4): Petri net has 6810 places, 10100 transitions and 81000 arcs
pnml2lts-mc( 0/ 4): Petri net BART-PT-050 analyzed
pnml2lts-mc( 0/ 4): There are no safe places
pnml2lts-mc( 0/ 4): Loading Petri net took 1.940 real 2.630 user 2.530 sys
pnml2lts-mc( 3/ 4): LTL layer: formula: /tmp/ltl_1_
ltl formula name BART-PT-050-LTLFireability-02
ltl formula formula --ltl=/tmp/ltl_2_
pnml2lts-mc( 0/ 4): Loading model from model.pnml
pnml2lts-mc( 0/ 4): Edge label is id
pnml2lts-mc( 0/ 4): Petri net has 6810 places, 10100 transitions and 81000 arcs
pnml2lts-mc( 0/ 4): Petri net BART-PT-050 analyzed
pnml2lts-mc( 0/ 4): There are no safe places
pnml2lts-mc( 0/ 4): Loading Petri net took 6.470 real 2.880 user 11.270 sys
pnml2lts-mc( 1/ 4): LTL layer: formula: /tmp/ltl_2_
pnml2lts-mc( 1/ 4), ** error **: syntax error near pos 8
ltl formula name BART-PT-050-LTLFireability-03
ltl formula formula --ltl=/tmp/ltl_3_
pnml2lts-mc( 0/ 4): Loading model from model.pnml
pnml2lts-mc( 0/ 4): Edge label is id
pnml2lts-mc( 0/ 4): Petri net has 6810 places, 10100 transitions and 81000 arcs
pnml2lts-mc( 0/ 4): Petri net BART-PT-050 analyzed
pnml2lts-mc( 0/ 4): There are no safe places
pnml2lts-mc( 0/ 4): Loading Petri net took 2.130 real 2.850 user 2.510 sys
pnml2lts-mc( 1/ 4): LTL layer: formula: /tmp/ltl_3_
pnml2lts-mc( 1/ 4), ** error **: syntax error near pos 1304
ltl formula name BART-PT-050-LTLFireability-04
ltl formula formula --ltl=/tmp/ltl_4_
pnml2lts-mc( 0/ 4): Loading model from model.pnml
pnml2lts-mc( 0/ 4): Edge label is id
pnml2lts-mc( 0/ 4): Petri net has 6810 places, 10100 transitions and 81000 arcs
pnml2lts-mc( 0/ 4): Petri net BART-PT-050 analyzed
pnml2lts-mc( 0/ 4): There are no safe places
pnml2lts-mc( 0/ 4): Loading Petri net took 1.920 real 2.560 user 2.490 sys
pnml2lts-mc( 0/ 4): LTL layer: formula: /tmp/ltl_4_
ltl formula name BART-PT-050-LTLFireability-05
ltl formula formula --ltl=/tmp/ltl_5_
pnml2lts-mc( 0/ 4): Loading model from model.pnml
pnml2lts-mc( 0/ 4): Edge label is id
pnml2lts-mc( 0/ 4): Petri net has 6810 places, 10100 transitions and 81000 arcs
pnml2lts-mc( 0/ 4): Petri net BART-PT-050 analyzed
pnml2lts-mc( 0/ 4): There are no safe places
pnml2lts-mc( 0/ 4): Loading Petri net took 1.980 real 2.670 user 2.620 sys
pnml2lts-mc( 0/ 4): LTL layer: formula: /tmp/ltl_5_
ltl formula name BART-PT-050-LTLFireability-06
ltl formula formula --ltl=/tmp/ltl_6_
pnml2lts-mc( 0/ 4): Loading model from model.pnml
pnml2lts-mc( 0/ 4): Edge label is id
pnml2lts-mc( 0/ 4): Petri net has 6810 places, 10100 transitions and 81000 arcs
pnml2lts-mc( 0/ 4): Petri net BART-PT-050 analyzed
pnml2lts-mc( 2/ 4): LTL layer: formula: /tmp/ltl_6_
pnml2lts-mc( 0/ 4): There are no safe places
pnml2lts-mc( 0/ 4): Loading Petri net took 4.330 real 3.480 user 9.520 sys
pnml2lts-mc( 2/ 4), ** error **: syntax error near pos 17836
ltl formula name BART-PT-050-LTLFireability-07
ltl formula formula --ltl=/tmp/ltl_7_
pnml2lts-mc( 0/ 4): Loading model from model.pnml
pnml2lts-mc( 0/ 4): Edge label is id
pnml2lts-mc( 0/ 4): Petri net has 6810 places, 10100 transitions and 81000 arcs
pnml2lts-mc( 0/ 4): Petri net BART-PT-050 analyzed
pnml2lts-mc( 0/ 4): There are no safe places
pnml2lts-mc( 0/ 4): Loading Petri net took 2.040 real 2.630 user 2.720 sys
pnml2lts-mc( 3/ 4): LTL layer: formula: /tmp/ltl_7_
ltl formula name BART-PT-050-LTLFireability-08
ltl formula formula --ltl=/tmp/ltl_8_
pnml2lts-mc( 0/ 4): Loading model from model.pnml
pnml2lts-mc( 0/ 4): Edge label is id
pnml2lts-mc( 0/ 4): Petri net has 6810 places, 10100 transitions and 81000 arcs
pnml2lts-mc( 0/ 4): Petri net BART-PT-050 analyzed
pnml2lts-mc( 0/ 4): There are no safe places
pnml2lts-mc( 0/ 4): Loading Petri net took 1.950 real 2.530 user 2.620 sys
pnml2lts-mc( 0/ 4): LTL layer: formula: /tmp/ltl_8_
pnml2lts-mc( 0/ 4): buchi has 3 states
pnml2lts-mc( 0/ 4): Weak Buchi automaton detected, adding non-accepting as progress label.
pnml2lts-mc( 0/ 4): There are 6812 state labels and 1 edge labels
pnml2lts-mc( 0/ 4): State length is 6811, there are 10103 groups
pnml2lts-mc( 0/ 4): Running ufscc using 4 cores
pnml2lts-mc( 0/ 4): Using a tree table with 2^30 elements
pnml2lts-mc( 0/ 4): Successor permutation: dynamic
pnml2lts-mc( 0/ 4): Global bits: 0, count bits: 0, local bits: 0
pnml2lts-mc( 2/ 4):
pnml2lts-mc( 2/ 4): Accepting cycle FOUND at depth ~192!
pnml2lts-mc( 2/ 4):
pnml2lts-mc( 0/ 4):
pnml2lts-mc( 0/ 4): total scc count: 0
pnml2lts-mc( 0/ 4): unique states count: 481
pnml2lts-mc( 0/ 4): unique transitions count: 221376
pnml2lts-mc( 0/ 4): - self-loop count: 0
pnml2lts-mc( 0/ 4): - claim dead count: 0
pnml2lts-mc( 0/ 4): - claim found count: 1
pnml2lts-mc( 0/ 4): - claim success count: 484
pnml2lts-mc( 0/ 4): - cum. max stack depth: 484
pnml2lts-mc( 0/ 4):
pnml2lts-mc( 0/ 4): Explored 484 states 226780 transitions, fanout: 468.554
pnml2lts-mc( 0/ 4): Total exploration time 34.940 sec (34.870 sec minimum, 34.903 sec on average)
pnml2lts-mc( 0/ 4): States per second: 14, Transitions per second: 6491
pnml2lts-mc( 0/ 4):
pnml2lts-mc( 0/ 4): Queue width: 12B, total height: 0, memory: 0.00MB
pnml2lts-mc( 0/ 4): Tree memory: 4.5MB, 21.3 B/state, compr.: 0.1%
pnml2lts-mc( 0/ 4): Tree fill ratio (roots/leafs): 0.0%/0.0%
pnml2lts-mc( 0/ 4): Stored 10353 string chucks using 0MB
pnml2lts-mc( 0/ 4): Total memory used for chunk indexing: 0MB
pnml2lts-mc( 0/ 4): Est. total memory use: 4.5MB (~8192.0MB paged-in)
ltl formula name BART-PT-050-LTLFireability-09
ltl formula formula --ltl=/tmp/ltl_9_
pnml2lts-mc( 0/ 4): Loading model from model.pnml
pnml2lts-mc( 0/ 4): Edge label is id
pnml2lts-mc( 0/ 4): Petri net has 6810 places, 10100 transitions and 81000 arcs
pnml2lts-mc( 0/ 4): Petri net BART-PT-050 analyzed
pnml2lts-mc( 2/ 4): LTL layer: formula: /tmp/ltl_9_
pnml2lts-mc( 0/ 4): There are no safe places
pnml2lts-mc( 0/ 4): Loading Petri net took 6.140 real 2.900 user 11.100 sys
pnml2lts-mc( 0/ 4): There are 6811 state labels and 1 edge labels
pnml2lts-mc( 0/ 4): State length is 6811, there are 10112 groups
pnml2lts-mc( 0/ 4): Running ufscc using 4 cores
pnml2lts-mc( 0/ 4): Using a tree table with 2^30 elements
pnml2lts-mc( 0/ 4): Successor permutation: dynamic
pnml2lts-mc( 0/ 4): Global bits: 0, count bits: 0, local bits: 0
pnml2lts-mc( 2/ 4):
pnml2lts-mc( 2/ 4): Accepting cycle FOUND at depth ~208!
pnml2lts-mc( 2/ 4):
pnml2lts-mc( 0/ 4):
pnml2lts-mc( 0/ 4): total scc count: 0
pnml2lts-mc( 0/ 4): unique states count: 434
pnml2lts-mc( 0/ 4): unique transitions count: 204871
pnml2lts-mc( 0/ 4): - self-loop count: 0
pnml2lts-mc( 0/ 4): - claim dead count: 0
pnml2lts-mc( 0/ 4): - claim found count: 1
pnml2lts-mc( 0/ 4): - claim success count: 437
pnml2lts-mc( 0/ 4): - cum. max stack depth: 437
pnml2lts-mc( 0/ 4):
pnml2lts-mc( 0/ 4): Explored 437 states 210275 transitions, fanout: 481.178
pnml2lts-mc( 0/ 4): Total exploration time 31.770 sec (31.730 sec minimum, 31.748 sec on average)
pnml2lts-mc( 0/ 4): States per second: 14, Transitions per second: 6619
pnml2lts-mc( 0/ 4):
pnml2lts-mc( 0/ 4): Queue width: 12B, total height: 0, memory: 0.00MB
pnml2lts-mc( 0/ 4): Tree memory: 4.2MB, 21.4 B/state, compr.: 0.1%
pnml2lts-mc( 0/ 4): Tree fill ratio (roots/leafs): 0.0%/0.0%
pnml2lts-mc( 0/ 4): Stored 10353 string chucks using 0MB
pnml2lts-mc( 0/ 4): Total memory used for chunk indexing: 0MB
pnml2lts-mc( 0/ 4): Est. total memory use: 4.2MB (~8192.0MB paged-in)
ltl formula name BART-PT-050-LTLFireability-10
ltl formula formula --ltl=/tmp/ltl_10_
pnml2lts-mc( 0/ 4): Loading model from model.pnml
pnml2lts-mc( 0/ 4): Edge label is id
pnml2lts-mc( 0/ 4): Petri net has 6810 places, 10100 transitions and 81000 arcs
pnml2lts-mc( 0/ 4): Petri net BART-PT-050 analyzed
pnml2lts-mc( 3/ 4): LTL layer: formula: /tmp/ltl_10_
pnml2lts-mc( 0/ 4): There are no safe places
pnml2lts-mc( 0/ 4): Loading Petri net took 5.820 real 2.640 user 11.080 sys
pnml2lts-mc( 0/ 4): Weak Buchi automaton detected, adding non-accepting as progress label.
pnml2lts-mc( 0/ 4): There are 6812 state labels and 1 edge labels
pnml2lts-mc( 0/ 4): State length is 6811, there are 10103 groups
pnml2lts-mc( 0/ 4): Running ufscc using 4 cores
pnml2lts-mc( 0/ 4): Using a tree table with 2^30 elements
pnml2lts-mc( 0/ 4): Successor permutation: dynamic
pnml2lts-mc( 0/ 4): Global bits: 0, count bits: 0, local bits: 0
pnml2lts-mc( 3/ 4):
pnml2lts-mc( 3/ 4): Accepting cycle FOUND at depth ~88!
pnml2lts-mc( 3/ 4):
pnml2lts-mc( 0/ 4):
pnml2lts-mc( 0/ 4): total scc count: 0
pnml2lts-mc( 0/ 4): unique states count: 344
pnml2lts-mc( 0/ 4): unique transitions count: 213346
pnml2lts-mc( 0/ 4): - self-loop count: 0
pnml2lts-mc( 0/ 4): - claim dead count: 0
pnml2lts-mc( 0/ 4): - claim found count: 1
pnml2lts-mc( 0/ 4): - claim success count: 347
pnml2lts-mc( 0/ 4): - cum. max stack depth: 347
pnml2lts-mc( 0/ 4):
pnml2lts-mc( 0/ 4): Explored 347 states 218750 transitions, fanout: 630.403
pnml2lts-mc( 0/ 4): Total exploration time 10.120 sec (10.100 sec minimum, 10.110 sec on average)
pnml2lts-mc( 0/ 4): States per second: 34, Transitions per second: 21616
pnml2lts-mc( 0/ 4):
pnml2lts-mc( 0/ 4): Queue width: 12B, total height: 0, memory: 0.00MB
pnml2lts-mc( 0/ 4): Tree memory: 4.4MB, 21.4 B/state, compr.: 0.1%
pnml2lts-mc( 0/ 4): Tree fill ratio (roots/leafs): 0.0%/0.0%
pnml2lts-mc( 0/ 4): Stored 10353 string chucks using 0MB
pnml2lts-mc( 0/ 4): Total memory used for chunk indexing: 0MB
pnml2lts-mc( 0/ 4): Est. total memory use: 4.4MB (~8192.0MB paged-in)
ltl formula name BART-PT-050-LTLFireability-11
ltl formula formula --ltl=/tmp/ltl_11_
pnml2lts-mc( 0/ 4): Loading model from model.pnml
pnml2lts-mc( 0/ 4): Edge label is id
pnml2lts-mc( 0/ 4): Petri net has 6810 places, 10100 transitions and 81000 arcs
pnml2lts-mc( 0/ 4): Petri net BART-PT-050 analyzed
pnml2lts-mc( 0/ 4): There are no safe places
pnml2lts-mc( 0/ 4): Loading Petri net took 1.900 real 2.450 user 2.590 sys
pnml2lts-mc( 0/ 4): LTL layer: formula: /tmp/ltl_11_
pnml2lts-mc( 0/ 4): buchi has 1 states
pnml2lts-mc( 0/ 4): Weak Buchi automaton detected, adding non-accepting as progress label.
pnml2lts-mc( 0/ 4): There are 6812 state labels and 1 edge labels
pnml2lts-mc( 0/ 4): State length is 6811, there are 10101 groups
pnml2lts-mc( 0/ 4): Running ufscc using 4 cores
pnml2lts-mc( 0/ 4): Using a tree table with 2^30 elements
pnml2lts-mc( 0/ 4): Successor permutation: dynamic
pnml2lts-mc( 0/ 4): Global bits: 0, count bits: 0, local bits: 0
pnml2lts-mc( 0/ 4):
pnml2lts-mc( 0/ 4): Accepting cycle FOUND at depth ~129!
pnml2lts-mc( 0/ 4):
pnml2lts-mc( 0/ 4):
pnml2lts-mc( 0/ 4): total scc count: 0
pnml2lts-mc( 0/ 4): unique states count: 502
pnml2lts-mc( 0/ 4): unique transitions count: 226135
pnml2lts-mc( 0/ 4): - self-loop count: 0
pnml2lts-mc( 0/ 4): - claim dead count: 0
pnml2lts-mc( 0/ 4): - claim found count: 1
pnml2lts-mc( 0/ 4): - claim success count: 505
pnml2lts-mc( 0/ 4): - cum. max stack depth: 505
pnml2lts-mc( 0/ 4):
pnml2lts-mc( 0/ 4): Explored 505 states 231539 transitions, fanout: 458.493
pnml2lts-mc( 0/ 4): Total exploration time 8.040 sec (8.020 sec minimum, 8.030 sec on average)
pnml2lts-mc( 0/ 4): States per second: 63, Transitions per second: 28798
pnml2lts-mc( 0/ 4):
pnml2lts-mc( 0/ 4): Queue width: 12B, total height: 0, memory: 0.00MB
pnml2lts-mc( 0/ 4): Tree memory: 4.5MB, 21.1 B/state, compr.: 0.1%
pnml2lts-mc( 0/ 4): Tree fill ratio (roots/leafs): 0.0%/0.0%
pnml2lts-mc( 0/ 4): Stored 10353 string chucks using 0MB
pnml2lts-mc( 0/ 4): Total memory used for chunk indexing: 0MB
pnml2lts-mc( 0/ 4): Est. total memory use: 4.5MB (~8192.0MB paged-in)
ltl formula name BART-PT-050-LTLFireability-12
ltl formula formula --ltl=/tmp/ltl_12_
pnml2lts-mc( 0/ 4): Loading model from model.pnml
pnml2lts-mc( 0/ 4): Edge label is id
pnml2lts-mc( 0/ 4): Petri net has 6810 places, 10100 transitions and 81000 arcs
pnml2lts-mc( 0/ 4): Petri net BART-PT-050 analyzed
pnml2lts-mc( 0/ 4): There are no safe places
pnml2lts-mc( 0/ 4): Loading Petri net took 1.960 real 2.580 user 2.410 sys
pnml2lts-mc( 1/ 4): LTL layer: formula: /tmp/ltl_12_
pnml2lts-mc( 0/ 4): Weak Buchi automaton detected, adding non-accepting as progress label.
pnml2lts-mc( 0/ 4): There are 6812 state labels and 1 edge labels
pnml2lts-mc( 0/ 4): State length is 6811, there are 10101 groups
pnml2lts-mc( 0/ 4): Running ufscc using 4 cores
pnml2lts-mc( 0/ 4): Using a tree table with 2^30 elements
pnml2lts-mc( 0/ 4): Successor permutation: dynamic
pnml2lts-mc( 0/ 4): Global bits: 0, count bits: 0, local bits: 0
pnml2lts-mc( 1/ 4):
pnml2lts-mc( 1/ 4): Accepting cycle FOUND at depth ~170!
pnml2lts-mc( 1/ 4):
pnml2lts-mc( 0/ 4):
pnml2lts-mc( 0/ 4): total scc count: 0
pnml2lts-mc( 0/ 4): unique states count: 633
pnml2lts-mc( 0/ 4): unique transitions count: 231122
pnml2lts-mc( 0/ 4): - self-loop count: 0
pnml2lts-mc( 0/ 4): - claim dead count: 0
pnml2lts-mc( 0/ 4): - claim found count: 1
pnml2lts-mc( 0/ 4): - claim success count: 636
pnml2lts-mc( 0/ 4): - cum. max stack depth: 636
pnml2lts-mc( 0/ 4):
pnml2lts-mc( 0/ 4): Explored 636 states 236526 transitions, fanout: 371.896
pnml2lts-mc( 0/ 4): Total exploration time 8.970 sec (8.950 sec minimum, 8.960 sec on average)
pnml2lts-mc( 0/ 4): States per second: 71, Transitions per second: 26369
pnml2lts-mc( 0/ 4):
pnml2lts-mc( 0/ 4): Queue width: 12B, total height: 0, memory: 0.00MB
pnml2lts-mc( 0/ 4): Tree memory: 4.7MB, 21.3 B/state, compr.: 0.1%
pnml2lts-mc( 0/ 4): Tree fill ratio (roots/leafs): 0.0%/0.0%
pnml2lts-mc( 0/ 4): Stored 10353 string chucks using 0MB
pnml2lts-mc( 0/ 4): Total memory used for chunk indexing: 0MB
pnml2lts-mc( 0/ 4): Est. total memory use: 4.7MB (~8192.0MB paged-in)
ltl formula name BART-PT-050-LTLFireability-13
ltl formula formula --ltl=/tmp/ltl_13_
pnml2lts-mc( 0/ 4): Loading model from model.pnml
pnml2lts-mc( 0/ 4): Edge label is id
pnml2lts-mc( 0/ 4): Petri net has 6810 places, 10100 transitions and 81000 arcs
pnml2lts-mc( 0/ 4): Petri net BART-PT-050 analyzed
pnml2lts-mc( 0/ 4): There are no safe places
pnml2lts-mc( 0/ 4): Loading Petri net took 1.940 real 2.580 user 2.560 sys
pnml2lts-mc( 2/ 4): LTL layer: formula: /tmp/ltl_13_
pnml2lts-mc( 0/ 4): Weak Buchi automaton detected, adding non-accepting as progress label.
pnml2lts-mc( 0/ 4): There are 6812 state labels and 1 edge labels
pnml2lts-mc( 0/ 4): State length is 6811, there are 10101 groups
pnml2lts-mc( 0/ 4): Running ufscc using 4 cores
pnml2lts-mc( 0/ 4): Using a tree table with 2^30 elements
pnml2lts-mc( 0/ 4): Successor permutation: dynamic
pnml2lts-mc( 0/ 4): Global bits: 0, count bits: 0, local bits: 0
pnml2lts-mc( 0/ 4):
pnml2lts-mc( 0/ 4): Accepting cycle FOUND at depth ~138!
pnml2lts-mc( 0/ 4):
pnml2lts-mc( 0/ 4):
pnml2lts-mc( 0/ 4): total scc count: 0
pnml2lts-mc( 0/ 4): unique states count: 533
pnml2lts-mc( 0/ 4): unique transitions count: 225852
pnml2lts-mc( 0/ 4): - self-loop count: 0
pnml2lts-mc( 0/ 4): - claim dead count: 0
pnml2lts-mc( 0/ 4): - claim found count: 1
pnml2lts-mc( 0/ 4): - claim success count: 536
pnml2lts-mc( 0/ 4): - cum. max stack depth: 536
pnml2lts-mc( 0/ 4):
pnml2lts-mc( 0/ 4): Explored 536 states 231256 transitions, fanout: 431.448
pnml2lts-mc( 0/ 4): Total exploration time 8.150 sec (8.130 sec minimum, 8.140 sec on average)
pnml2lts-mc( 0/ 4): States per second: 66, Transitions per second: 28375
pnml2lts-mc( 0/ 4):
pnml2lts-mc( 0/ 4): Queue width: 12B, total height: 0, memory: 0.00MB
pnml2lts-mc( 0/ 4): Tree memory: 4.5MB, 20.7 B/state, compr.: 0.1%
pnml2lts-mc( 0/ 4): Tree fill ratio (roots/leafs): 0.0%/0.0%
pnml2lts-mc( 0/ 4): Stored 10353 string chucks using 0MB
pnml2lts-mc( 0/ 4): Total memory used for chunk indexing: 0MB
pnml2lts-mc( 0/ 4): Est. total memory use: 4.5MB (~8192.0MB paged-in)
ltl formula name BART-PT-050-LTLFireability-14
ltl formula formula --ltl=/tmp/ltl_14_
pnml2lts-mc( 0/ 4): Loading model from model.pnml
pnml2lts-mc( 0/ 4): Edge label is id
pnml2lts-mc( 0/ 4): Petri net has 6810 places, 10100 transitions and 81000 arcs
pnml2lts-mc( 0/ 4): Petri net BART-PT-050 analyzed
pnml2lts-mc( 1/ 4): LTL layer: formula: /tmp/ltl_14_
pnml2lts-mc( 0/ 4): There are no safe places
pnml2lts-mc( 0/ 4): Loading Petri net took 6.460 real 3.300 user 11.110 sys
pnml2lts-mc( 0/ 4): Weak Buchi automaton detected, adding non-accepting as progress label.
pnml2lts-mc( 0/ 4): There are 6812 state labels and 1 edge labels
pnml2lts-mc( 0/ 4): State length is 6811, there are 10103 groups
pnml2lts-mc( 0/ 4): Running ufscc using 4 cores
pnml2lts-mc( 0/ 4): Using a tree table with 2^30 elements
pnml2lts-mc( 0/ 4): Successor permutation: dynamic
pnml2lts-mc( 0/ 4): Global bits: 0, count bits: 0, local bits: 0
pnml2lts-mc( 3/ 4):
pnml2lts-mc( 3/ 4): Accepting cycle FOUND at depth ~100!
pnml2lts-mc( 3/ 4):
pnml2lts-mc( 0/ 4):
pnml2lts-mc( 0/ 4): total scc count: 0
pnml2lts-mc( 0/ 4): unique states count: 434
pnml2lts-mc( 0/ 4): unique transitions count: 329196
pnml2lts-mc( 0/ 4): - self-loop count: 0
pnml2lts-mc( 0/ 4): - claim dead count: 0
pnml2lts-mc( 0/ 4): - claim found count: 2
pnml2lts-mc( 0/ 4): - claim success count: 437
pnml2lts-mc( 0/ 4): - cum. max stack depth: 437
pnml2lts-mc( 0/ 4):
pnml2lts-mc( 0/ 4): Explored 437 states 334600 transitions, fanout: 765.675
pnml2lts-mc( 0/ 4): Total exploration time 8.760 sec (8.730 sec minimum, 8.737 sec on average)
pnml2lts-mc( 0/ 4): States per second: 50, Transitions per second: 38196
pnml2lts-mc( 0/ 4):
pnml2lts-mc( 0/ 4): Queue width: 12B, total height: 0, memory: 0.00MB
pnml2lts-mc( 0/ 4): Tree memory: 5.8MB, 18.6 B/state, compr.: 0.1%
pnml2lts-mc( 0/ 4): Tree fill ratio (roots/leafs): 0.0%/0.0%
pnml2lts-mc( 0/ 4): Stored 10353 string chucks using 0MB
pnml2lts-mc( 0/ 4): Total memory used for chunk indexing: 0MB
pnml2lts-mc( 0/ 4): Est. total memory use: 5.8MB (~8192.0MB paged-in)
ltl formula name BART-PT-050-LTLFireability-15
ltl formula formula --ltl=/tmp/ltl_15_
pnml2lts-mc( 0/ 4): Loading model from model.pnml
pnml2lts-mc( 0/ 4): Edge label is id
pnml2lts-mc( 0/ 4): Petri net has 6810 places, 10100 transitions and 81000 arcs
pnml2lts-mc( 0/ 4): Petri net BART-PT-050 analyzed
pnml2lts-mc( 0/ 4): There are no safe places
pnml2lts-mc( 0/ 4): Loading Petri net took 1.870 real 2.690 user 2.430 sys
pnml2lts-mc( 1/ 4): LTL layer: formula: /tmp/ltl_15_
pnml2lts-mc( 0/ 4): Weak Buchi automaton detected, adding non-accepting as progress label.
pnml2lts-mc( 0/ 4): There are 6812 state labels and 1 edge labels
pnml2lts-mc( 0/ 4): State length is 6811, there are 10103 groups
pnml2lts-mc( 0/ 4): Running ufscc using 4 cores
pnml2lts-mc( 0/ 4): Using a tree table with 2^30 elements
pnml2lts-mc( 0/ 4): Successor permutation: dynamic
pnml2lts-mc( 0/ 4): Global bits: 0, count bits: 0, local bits: 0
pnml2lts-mc( 1/ 4):
pnml2lts-mc( 1/ 4): Accepting cycle FOUND at depth ~159!
pnml2lts-mc( 1/ 4):
pnml2lts-mc( 0/ 4):
pnml2lts-mc( 0/ 4): total scc count: 0
pnml2lts-mc( 0/ 4): unique states count: 631
pnml2lts-mc( 0/ 4): unique transitions count: 232671
pnml2lts-mc( 0/ 4): - self-loop count: 0
pnml2lts-mc( 0/ 4): - claim dead count: 0
pnml2lts-mc( 0/ 4): - claim found count: 1
pnml2lts-mc( 0/ 4): - claim success count: 634
pnml2lts-mc( 0/ 4): - cum. max stack depth: 634
pnml2lts-mc( 0/ 4):
pnml2lts-mc( 0/ 4): Explored 634 states 238075 transitions, fanout: 375.513
pnml2lts-mc( 0/ 4): Total exploration time 8.890 sec (8.870 sec minimum, 8.875 sec on average)
pnml2lts-mc( 0/ 4): States per second: 71, Transitions per second: 26780
pnml2lts-mc( 0/ 4):
pnml2lts-mc( 0/ 4): Queue width: 12B, total height: 0, memory: 0.00MB
pnml2lts-mc( 0/ 4): Tree memory: 4.8MB, 21.7 B/state, compr.: 0.1%
pnml2lts-mc( 0/ 4): Tree fill ratio (roots/leafs): 0.0%/0.0%
pnml2lts-mc( 0/ 4): Stored 10353 string chucks using 0MB
pnml2lts-mc( 0/ 4): Total memory used for chunk indexing: 0MB
pnml2lts-mc( 0/ 4): Est. total memory use: 4.8MB (~8192.0MB paged-in)
Sequence of Actions to be Executed by the VM
This is useful if one wants to reexecute the tool in the VM from the submitted image disk.
set -x
# this is for BenchKit: configuration of major elements for the test
export BK_INPUT="BART-PT-050"
export BK_EXAMINATION="LTLFireability"
export BK_TOOL="ltsmin"
export BK_RESULT_DIR="/tmp/BK_RESULTS/OUTPUTS"
export BK_TIME_CONFINEMENT="3600"
export BK_MEMORY_CONFINEMENT="16384"
# this is specific to your benchmark or test
export BIN_DIR="$HOME/BenchKit/bin"
# remove the execution directoty if it exists (to avoid increse of .vmdk images)
if [ -d execution ] ; then
rm -rf execution
fi
tar xzf /home/mcc/BenchKit/INPUTS/BART-PT-050.tgz
mv BART-PT-050 execution
cd execution
pwd
ls -lh
# this is for BenchKit: explicit launching of the test
echo "====================================================================="
echo " Generated by BenchKit 2-3637"
echo " Executing tool ltsmin"
echo " Input is BART-PT-050, examination is LTLFireability"
echo " Time confinement is $BK_TIME_CONFINEMENT seconds"
echo " Memory confinement is 16384 MBytes"
echo " Number of cores is 4"
echo " Run identifier is r221-ebro-152732363300030"
echo "====================================================================="
echo
echo "--------------------"
echo "content from stdout:"
echo
echo "=== Data for post analysis generated by BenchKit (invocation template)"
echo
if [ "LTLFireability" = "UpperBounds" ] ; then
echo "The expected result is a vector of positive values"
echo NUM_VECTOR
elif [ "LTLFireability" != "StateSpace" ] ; then
echo "The expected result is a vector of booleans"
echo BOOL_VECTOR
else
echo "no data necessary for post analysis"
fi
echo
if [ -f "LTLFireability.txt" ] ; then
echo "here is the order used to build the result vector(from text file)"
for x in $(grep Property LTLFireability.txt | cut -d ' ' -f 2 | sort -u) ; do
echo "FORMULA_NAME $x"
done
elif [ -f "LTLFireability.xml" ] ; then # for cunf (txt files deleted;-)
echo echo "here is the order used to build the result vector(from xml file)"
for x in $(grep '
echo "FORMULA_NAME $x"
done
fi
echo
echo "=== Now, execution of the tool begins"
echo
echo -n "BK_START "
date -u +%s%3N
echo
timeout -s 9 $BK_TIME_CONFINEMENT bash -c "/home/mcc/BenchKit/BenchKit_head.sh 2> STDERR ; echo ; echo -n \"BK_STOP \" ; date -u +%s%3N"
if [ $? -eq 137 ] ; then
echo
echo "BK_TIME_CONFINEMENT_REACHED"
fi
echo
echo "--------------------"
echo "content from stderr:"
echo
cat STDERR ;