

About the Execution of LTSMin for BART-PT-020
| Execution Summary | |||||
| Max Memory Used (MB) |
Time wait (ms) | CPU Usage (ms) | I/O Wait (ms) | Computed Result | Execution Status |
| 1072.110 | 729738.00 | 848361.00 | 138.40 | ????????FFTFFFFF | normal |
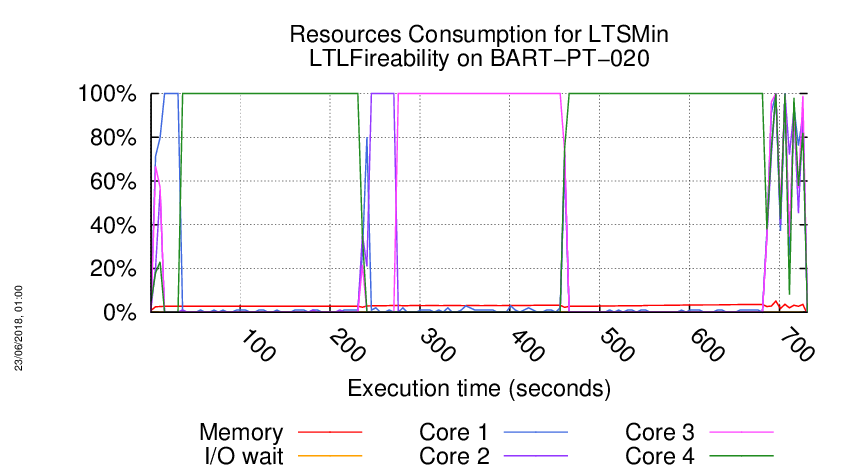
Execution Chart
We display below the execution chart for this examination (boot time has been removed).
Trace from the execution
Waiting for the VM to be ready (probing ssh)
..................
/home/mcc/execution
total 14M
-rw-r--r-- 1 mcc users 660K May 15 18:54 CTLCardinality.txt
-rw-r--r-- 1 mcc users 1.6M May 15 18:54 CTLCardinality.xml
-rw-r--r-- 1 mcc users 150K May 15 18:54 CTLFireability.txt
-rw-r--r-- 1 mcc users 401K May 15 18:54 CTLFireability.xml
-rw-r--r-- 1 mcc users 4.0K May 15 18:49 GenericPropertiesDefinition.xml
-rw-r--r-- 1 mcc users 6.1K May 15 18:49 GenericPropertiesVerdict.xml
-rw-r--r-- 1 mcc users 189K May 26 09:26 LTLCardinality.txt
-rw-r--r-- 1 mcc users 444K May 26 09:26 LTLCardinality.xml
-rw-r--r-- 1 mcc users 117K May 26 09:26 LTLFireability.txt
-rw-r--r-- 1 mcc users 278K May 26 09:26 LTLFireability.xml
-rw-r--r-- 1 mcc users 812K May 15 18:54 ReachabilityCardinality.txt
-rw-r--r-- 1 mcc users 2.0M May 15 18:54 ReachabilityCardinality.xml
-rw-r--r-- 1 mcc users 102 May 15 18:54 ReachabilityDeadlock.txt
-rw-r--r-- 1 mcc users 340 May 15 18:54 ReachabilityDeadlock.xml
-rw-r--r-- 1 mcc users 657K May 15 18:54 ReachabilityFireability.txt
-rw-r--r-- 1 mcc users 1.6M May 15 18:54 ReachabilityFireability.xml
-rw-r--r-- 1 mcc users 70K May 15 18:54 UpperBounds.txt
-rw-r--r-- 1 mcc users 135K May 15 18:54 UpperBounds.xml
-rw-r--r-- 1 mcc users 5 May 15 18:49 equiv_col
-rw-r--r-- 1 mcc users 4 May 15 18:49 instance
-rw-r--r-- 1 mcc users 6 May 15 18:49 iscolored
-rw-r--r-- 1 mcc users 4.7M May 15 18:49 model.pnml
=====================================================================
Generated by BenchKit 2-3637
Executing tool ltsmin
Input is BART-PT-020, examination is LTLFireability
Time confinement is 3600 seconds
Memory confinement is 16384 MBytes
Number of cores is 4
Run identifier is r221-ebro-152732363300024
=====================================================================
--------------------
content from stdout:
=== Data for post analysis generated by BenchKit (invocation template)
The expected result is a vector of booleans
BOOL_VECTOR
here is the order used to build the result vector(from text file)
FORMULA_NAME BART-PT-020-LTLFireability-00
FORMULA_NAME BART-PT-020-LTLFireability-01
FORMULA_NAME BART-PT-020-LTLFireability-02
FORMULA_NAME BART-PT-020-LTLFireability-03
FORMULA_NAME BART-PT-020-LTLFireability-04
FORMULA_NAME BART-PT-020-LTLFireability-05
FORMULA_NAME BART-PT-020-LTLFireability-06
FORMULA_NAME BART-PT-020-LTLFireability-07
FORMULA_NAME BART-PT-020-LTLFireability-08
FORMULA_NAME BART-PT-020-LTLFireability-09
FORMULA_NAME BART-PT-020-LTLFireability-10
FORMULA_NAME BART-PT-020-LTLFireability-11
FORMULA_NAME BART-PT-020-LTLFireability-12
FORMULA_NAME BART-PT-020-LTLFireability-13
FORMULA_NAME BART-PT-020-LTLFireability-14
FORMULA_NAME BART-PT-020-LTLFireability-15
=== Now, execution of the tool begins
BK_START 1527485153410
FORMULA BART-PT-020-LTLFireability-00 CANNOT_COMPUTE
FORMULA BART-PT-020-LTLFireability-01 CANNOT_COMPUTE
FORMULA BART-PT-020-LTLFireability-02 CANNOT_COMPUTE
FORMULA BART-PT-020-LTLFireability-03 CANNOT_COMPUTE
FORMULA BART-PT-020-LTLFireability-04 CANNOT_COMPUTE
FORMULA BART-PT-020-LTLFireability-05 CANNOT_COMPUTE
FORMULA BART-PT-020-LTLFireability-06 CANNOT_COMPUTE
FORMULA BART-PT-020-LTLFireability-07 CANNOT_COMPUTE
FORMULA BART-PT-020-LTLFireability-08 FALSE TECHNIQUES EXPLICIT PARALLEL_PROCESSING USE_NUPN
FORMULA BART-PT-020-LTLFireability-09 FALSE TECHNIQUES EXPLICIT PARALLEL_PROCESSING USE_NUPN
FORMULA BART-PT-020-LTLFireability-10 TRUE TECHNIQUES EXPLICIT PARALLEL_PROCESSING USE_NUPN
FORMULA BART-PT-020-LTLFireability-11 FALSE TECHNIQUES EXPLICIT PARALLEL_PROCESSING USE_NUPN
FORMULA BART-PT-020-LTLFireability-12 FALSE TECHNIQUES EXPLICIT PARALLEL_PROCESSING USE_NUPN
FORMULA BART-PT-020-LTLFireability-13 FALSE TECHNIQUES EXPLICIT PARALLEL_PROCESSING USE_NUPN
FORMULA BART-PT-020-LTLFireability-14 FALSE TECHNIQUES EXPLICIT PARALLEL_PROCESSING USE_NUPN
FORMULA BART-PT-020-LTLFireability-15 FALSE TECHNIQUES EXPLICIT PARALLEL_PROCESSING USE_NUPN
BK_STOP 1527485883148
--------------------
content from stderr:
mcc2018
ltl formula name BART-PT-020-LTLFireability-00
ltl formula formula --ltl=/tmp/ltl_0_
pnml2lts-mc( 0/ 4): Loading model from model.pnml
pnml2lts-mc( 0/ 4): Edge label is id
pnml2lts-mc( 0/ 4): Petri net has 2850 places, 4040 transitions and 32400 arcs
pnml2lts-mc( 0/ 4): Petri net BART-PT-020 analyzed
pnml2lts-mc( 3/ 4): LTL layer: formula: /tmp/ltl_0_
pnml2lts-mc( 0/ 4): There are no safe places
pnml2lts-mc( 0/ 4): Loading Petri net took 1.840 real 1.160 user 2.590 sys
pnml2lts-mc( 3/ 4), ** error **: syntax error near pos 57868
ltl formula name BART-PT-020-LTLFireability-01
ltl formula formula --ltl=/tmp/ltl_1_
pnml2lts-mc( 0/ 4): Loading model from model.pnml
pnml2lts-mc( 0/ 4): Edge label is id
pnml2lts-mc( 0/ 4): Petri net has 2850 places, 4040 transitions and 32400 arcs
pnml2lts-mc( 0/ 4): Petri net BART-PT-020 analyzed
pnml2lts-mc( 0/ 4): There are no safe places
pnml2lts-mc( 0/ 4): Loading Petri net took 2.470 real 1.240 user 3.860 sys
pnml2lts-mc( 0/ 4): LTL layer: formula: /tmp/ltl_1_
pnml2lts-mc( 0/ 4), ** error **: syntax error near pos 16
ltl formula name BART-PT-020-LTLFireability-02
ltl formula formula --ltl=/tmp/ltl_2_
pnml2lts-mc( 0/ 4): Loading model from model.pnml
pnml2lts-mc( 0/ 4): Edge label is id
pnml2lts-mc( 0/ 4): Petri net has 2850 places, 4040 transitions and 32400 arcs
pnml2lts-mc( 0/ 4): Petri net BART-PT-020 analyzed
pnml2lts-mc( 2/ 4): LTL layer: formula: /tmp/ltl_2_
pnml2lts-mc( 0/ 4): There are no safe places
pnml2lts-mc( 0/ 4): Loading Petri net took 1.520 real 1.260 user 2.060 sys
pnml2lts-mc( 2/ 4), ** error **: syntax error near pos 15
ltl formula name BART-PT-020-LTLFireability-03
ltl formula formula --ltl=/tmp/ltl_3_
pnml2lts-mc( 0/ 4): Loading model from model.pnml
pnml2lts-mc( 0/ 4): Edge label is id
pnml2lts-mc( 0/ 4): Petri net has 2850 places, 4040 transitions and 32400 arcs
pnml2lts-mc( 0/ 4): Petri net BART-PT-020 analyzed
pnml2lts-mc( 0/ 4): There are no safe places
pnml2lts-mc( 0/ 4): Loading Petri net took 1.710 real 1.040 user 2.560 sys
pnml2lts-mc( 0/ 4): LTL layer: formula: /tmp/ltl_3_
ltl formula name BART-PT-020-LTLFireability-04
ltl formula formula --ltl=/tmp/ltl_4_
pnml2lts-mc( 0/ 4): Loading model from model.pnml
pnml2lts-mc( 0/ 4): Edge label is id
pnml2lts-mc( 0/ 4): Petri net has 2850 places, 4040 transitions and 32400 arcs
pnml2lts-mc( 0/ 4): Petri net BART-PT-020 analyzed
pnml2lts-mc( 0/ 4): There are no safe places
pnml2lts-mc( 0/ 4): Loading Petri net took 0.760 real 1.030 user 0.740 sys
pnml2lts-mc( 3/ 4): LTL layer: formula: /tmp/ltl_4_
ltl formula name BART-PT-020-LTLFireability-05
ltl formula formula --ltl=/tmp/ltl_5_
pnml2lts-mc( 0/ 4): Loading model from model.pnml
pnml2lts-mc( 0/ 4): Edge label is id
pnml2lts-mc( 0/ 4): Petri net has 2850 places, 4040 transitions and 32400 arcs
pnml2lts-mc( 0/ 4): Petri net BART-PT-020 analyzed
pnml2lts-mc( 0/ 4): There are no safe places
pnml2lts-mc( 0/ 4): Loading Petri net took 1.910 real 0.870 user 2.820 sys
pnml2lts-mc( 0/ 4): LTL layer: formula: /tmp/ltl_5_
pnml2lts-mc( 0/ 4), ** error **: syntax error near pos 57862
ltl formula name BART-PT-020-LTLFireability-06
ltl formula formula --ltl=/tmp/ltl_6_
pnml2lts-mc( 0/ 4): Loading model from model.pnml
pnml2lts-mc( 0/ 4): Edge label is id
pnml2lts-mc( 0/ 4): Petri net has 2850 places, 4040 transitions and 32400 arcs
pnml2lts-mc( 0/ 4): Petri net BART-PT-020 analyzed
pnml2lts-mc( 1/ 4): LTL layer: formula: /tmp/ltl_6_
pnml2lts-mc( 0/ 4): There are no safe places
pnml2lts-mc( 0/ 4): Loading Petri net took 2.040 real 1.260 user 2.890 sys
ltl formula name BART-PT-020-LTLFireability-07
ltl formula formula --ltl=/tmp/ltl_7_
pnml2lts-mc( 0/ 4): Loading model from model.pnml
pnml2lts-mc( 0/ 4): Edge label is id
pnml2lts-mc( 0/ 4): Petri net has 2850 places, 4040 transitions and 32400 arcs
pnml2lts-mc( 0/ 4): Petri net BART-PT-020 analyzed
pnml2lts-mc( 3/ 4): LTL layer: formula: /tmp/ltl_7_
pnml2lts-mc( 0/ 4): There are no safe places
pnml2lts-mc( 3/ 4), ** error **: syntax error near pos 17
ltl formula name BART-PT-020-LTLFireability-08
ltl formula formula --ltl=/tmp/ltl_8_
pnml2lts-mc( 0/ 4): Loading model from model.pnml
pnml2lts-mc( 0/ 4): Edge label is id
pnml2lts-mc( 0/ 4): Petri net has 2850 places, 4040 transitions and 32400 arcs
pnml2lts-mc( 0/ 4): Petri net BART-PT-020 analyzed
pnml2lts-mc( 3/ 4): LTL layer: formula: /tmp/ltl_8_
pnml2lts-mc( 0/ 4): There are no safe places
pnml2lts-mc( 0/ 4): Loading Petri net took 1.970 real 1.220 user 2.970 sys
pnml2lts-mc( 0/ 4): Weak Buchi automaton detected, adding non-accepting as progress label.
pnml2lts-mc( 0/ 4): There are 2852 state labels and 1 edge labels
pnml2lts-mc( 0/ 4): State length is 2851, there are 4043 groups
pnml2lts-mc( 0/ 4): Running ufscc using 4 cores
pnml2lts-mc( 0/ 4): Using a tree table with 2^30 elements
pnml2lts-mc( 0/ 4): Successor permutation: dynamic
pnml2lts-mc( 0/ 4): Global bits: 0, count bits: 0, local bits: 0
pnml2lts-mc( 2/ 4):
pnml2lts-mc( 2/ 4): Accepting cycle FOUND at depth ~115!
pnml2lts-mc( 2/ 4):
pnml2lts-mc( 0/ 4):
pnml2lts-mc( 0/ 4): total scc count: 0
pnml2lts-mc( 0/ 4): unique states count: 160
pnml2lts-mc( 0/ 4): unique transitions count: 60998
pnml2lts-mc( 0/ 4): - self-loop count: 0
pnml2lts-mc( 0/ 4): - claim dead count: 0
pnml2lts-mc( 0/ 4): - claim found count: 2
pnml2lts-mc( 0/ 4): - claim success count: 163
pnml2lts-mc( 0/ 4): - cum. max stack depth: 163
pnml2lts-mc( 0/ 4):
pnml2lts-mc( 0/ 4): Explored 163 states 65322 transitions, fanout: 400.748
pnml2lts-mc( 0/ 4): Total exploration time 9.220 sec (9.200 sec minimum, 9.210 sec on average)
pnml2lts-mc( 0/ 4): States per second: 18, Transitions per second: 7085
pnml2lts-mc( 0/ 4):
pnml2lts-mc( 0/ 4): Queue width: 12B, total height: 0, memory: 0.00MB
pnml2lts-mc( 0/ 4): Tree memory: 1.1MB, 19.5 B/state, compr.: 0.2%
pnml2lts-mc( 0/ 4): Tree fill ratio (roots/leafs): 0.0%/0.0%
pnml2lts-mc( 0/ 4): Stored 4169 string chucks using 0MB
pnml2lts-mc( 0/ 4): Total memory used for chunk indexing: 0MB
pnml2lts-mc( 0/ 4): Est. total memory use: 1.1MB (~8192.0MB paged-in)
ltl formula name BART-PT-020-LTLFireability-09
ltl formula formula --ltl=/tmp/ltl_9_
pnml2lts-mc( 0/ 4): Loading model from model.pnml
pnml2lts-mc( 0/ 4): Edge label is id
pnml2lts-mc( 0/ 4): Petri net has 2850 places, 4040 transitions and 32400 arcs
pnml2lts-mc( 0/ 4): Petri net BART-PT-020 analyzed
pnml2lts-mc( 1/ 4): LTL layer: formula: /tmp/ltl_9_
pnml2lts-mc( 0/ 4): There are no safe places
pnml2lts-mc( 0/ 4): Loading Petri net took 2.030 real 1.130 user 3.060 sys
pnml2lts-mc( 0/ 4): Weak Buchi automaton detected, adding non-accepting as progress label.
pnml2lts-mc( 0/ 4): There are 2852 state labels and 1 edge labels
pnml2lts-mc( 0/ 4): State length is 2851, there are 4049 groups
pnml2lts-mc( 0/ 4): Running ufscc using 4 cores
pnml2lts-mc( 0/ 4): Using a tree table with 2^30 elements
pnml2lts-mc( 0/ 4): Successor permutation: dynamic
pnml2lts-mc( 0/ 4): Global bits: 0, count bits: 0, local bits: 0
pnml2lts-mc( 1/ 4):
pnml2lts-mc( 1/ 4): Accepting cycle FOUND at depth ~82!
pnml2lts-mc( 1/ 4):
pnml2lts-mc( 0/ 4):
pnml2lts-mc( 0/ 4): total scc count: 0
pnml2lts-mc( 0/ 4): unique states count: 136
pnml2lts-mc( 0/ 4): unique transitions count: 31865
pnml2lts-mc( 0/ 4): - self-loop count: 0
pnml2lts-mc( 0/ 4): - claim dead count: 0
pnml2lts-mc( 0/ 4): - claim found count: 1
pnml2lts-mc( 0/ 4): - claim success count: 139
pnml2lts-mc( 0/ 4): - cum. max stack depth: 139
pnml2lts-mc( 0/ 4):
pnml2lts-mc( 0/ 4): Explored 139 states 34029 transitions, fanout: 244.813
pnml2lts-mc( 0/ 4): Total exploration time 5.300 sec (5.290 sec minimum, 5.295 sec on average)
pnml2lts-mc( 0/ 4): States per second: 26, Transitions per second: 6421
pnml2lts-mc( 0/ 4):
pnml2lts-mc( 0/ 4): Queue width: 12B, total height: 0, memory: 0.00MB
pnml2lts-mc( 0/ 4): Tree memory: 0.7MB, 22.4 B/state, compr.: 0.2%
pnml2lts-mc( 0/ 4): Tree fill ratio (roots/leafs): 0.0%/0.0%
pnml2lts-mc( 0/ 4): Stored 4169 string chucks using 0MB
pnml2lts-mc( 0/ 4): Total memory used for chunk indexing: 0MB
pnml2lts-mc( 0/ 4): Est. total memory use: 0.7MB (~8192.0MB paged-in)
ltl formula name BART-PT-020-LTLFireability-10
ltl formula formula --ltl=/tmp/ltl_10_
pnml2lts-mc( 0/ 4): Loading model from model.pnml
pnml2lts-mc( 0/ 4): Edge label is id
pnml2lts-mc( 0/ 4): Petri net has 2850 places, 4040 transitions and 32400 arcs
pnml2lts-mc( 0/ 4): Petri net BART-PT-020 analyzed
pnml2lts-mc( 0/ 4): There are no safe places
pnml2lts-mc( 0/ 4): Loading Petri net took 0.680 real 0.950 user 0.800 sys
pnml2lts-mc( 0/ 4): LTL layer: formula: /tmp/ltl_10_
pnml2lts-mc( 0/ 4): buchi has 1 states
pnml2lts-mc( 0/ 4): Weak Buchi automaton detected, adding non-accepting as progress label.
pnml2lts-mc( 0/ 4): There are 2852 state labels and 1 edge labels
pnml2lts-mc( 0/ 4): State length is 2851, there are 4041 groups
pnml2lts-mc( 0/ 4): Running ufscc using 4 cores
pnml2lts-mc( 0/ 4): Using a tree table with 2^30 elements
pnml2lts-mc( 0/ 4): Successor permutation: dynamic
pnml2lts-mc( 0/ 4): Global bits: 0, count bits: 0, local bits: 0
pnml2lts-mc( 0/ 4):
pnml2lts-mc( 0/ 4): total scc count: 1
pnml2lts-mc( 0/ 4): unique states count: 1
pnml2lts-mc( 0/ 4): unique transitions count: 0
pnml2lts-mc( 0/ 4): - self-loop count: 0
pnml2lts-mc( 0/ 4): - claim dead count: 0
pnml2lts-mc( 0/ 4): - claim found count: 0
pnml2lts-mc( 0/ 4): - claim success count: 4
pnml2lts-mc( 0/ 4): - cum. max stack depth: 4
pnml2lts-mc( 0/ 4):
pnml2lts-mc( 0/ 4): Explored 4 states 4 transitions, fanout: 1.000
pnml2lts-mc( 0/ 4): Total exploration time 0.010 sec (0.010 sec minimum, 0.010 sec on average)
pnml2lts-mc( 0/ 4): States per second: 400, Transitions per second: 400
pnml2lts-mc( 0/ 4):
pnml2lts-mc( 0/ 4): Queue width: 12B, total height: 0, memory: 0.00MB
pnml2lts-mc( 0/ 4): Tree memory: 0.0MB, 216.0 B/state, compr.: 1.9%
pnml2lts-mc( 0/ 4): Tree fill ratio (roots/leafs): 0.0%/0.0%
pnml2lts-mc( 0/ 4): Stored 4169 string chucks using 0MB
pnml2lts-mc( 0/ 4): Total memory used for chunk indexing: 0MB
pnml2lts-mc( 0/ 4): Est. total memory use: 0.0MB (~8192.0MB paged-in)
ltl formula name BART-PT-020-LTLFireability-11
ltl formula formula --ltl=/tmp/ltl_11_
pnml2lts-mc( 0/ 4): Loading model from model.pnml
pnml2lts-mc( 0/ 4): Edge label is id
pnml2lts-mc( 0/ 4): Petri net has 2850 places, 4040 transitions and 32400 arcs
pnml2lts-mc( 0/ 4): Petri net BART-PT-020 analyzed
pnml2lts-mc( 0/ 4): There are no safe places
pnml2lts-mc( 0/ 4): Loading Petri net took 0.730 real 0.960 user 0.870 sys
pnml2lts-mc( 2/ 4): LTL layer: formula: /tmp/ltl_11_
pnml2lts-mc( 0/ 4): Weak Buchi automaton detected, adding non-accepting as progress label.
pnml2lts-mc( 0/ 4): There are 2852 state labels and 1 edge labels
pnml2lts-mc( 0/ 4): State length is 2851, there are 4048 groups
pnml2lts-mc( 0/ 4): Running ufscc using 4 cores
pnml2lts-mc( 0/ 4): Using a tree table with 2^30 elements
pnml2lts-mc( 0/ 4): Successor permutation: dynamic
pnml2lts-mc( 0/ 4): Global bits: 0, count bits: 0, local bits: 0
pnml2lts-mc( 1/ 4):
pnml2lts-mc( 1/ 4): Accepting cycle FOUND at depth ~64!
pnml2lts-mc( 1/ 4):
pnml2lts-mc( 0/ 4):
pnml2lts-mc( 0/ 4): total scc count: 0
pnml2lts-mc( 0/ 4): unique states count: 253
pnml2lts-mc( 0/ 4): unique transitions count: 37748
pnml2lts-mc( 0/ 4): - self-loop count: 0
pnml2lts-mc( 0/ 4): - claim dead count: 0
pnml2lts-mc( 0/ 4): - claim found count: 1
pnml2lts-mc( 0/ 4): - claim success count: 256
pnml2lts-mc( 0/ 4): - cum. max stack depth: 256
pnml2lts-mc( 0/ 4):
pnml2lts-mc( 0/ 4): Explored 256 states 39912 transitions, fanout: 155.906
pnml2lts-mc( 0/ 4): Total exploration time 1.150 sec (1.150 sec minimum, 1.150 sec on average)
pnml2lts-mc( 0/ 4): States per second: 223, Transitions per second: 34706
pnml2lts-mc( 0/ 4):
pnml2lts-mc( 0/ 4): Queue width: 12B, total height: 0, memory: 0.00MB
pnml2lts-mc( 0/ 4): Tree memory: 0.8MB, 21.7 B/state, compr.: 0.2%
pnml2lts-mc( 0/ 4): Tree fill ratio (roots/leafs): 0.0%/0.0%
pnml2lts-mc( 0/ 4): Stored 4169 string chucks using 0MB
pnml2lts-mc( 0/ 4): Total memory used for chunk indexing: 0MB
pnml2lts-mc( 0/ 4): Est. total memory use: 0.8MB (~8192.0MB paged-in)
ltl formula name BART-PT-020-LTLFireability-12
ltl formula formula --ltl=/tmp/ltl_12_
pnml2lts-mc( 0/ 4): Loading model from model.pnml
pnml2lts-mc( 0/ 4): Edge label is id
pnml2lts-mc( 0/ 4): Petri net has 2850 places, 4040 transitions and 32400 arcs
pnml2lts-mc( 0/ 4): Petri net BART-PT-020 analyzed
pnml2lts-mc( 0/ 4): There are no safe places
pnml2lts-mc( 0/ 4): Loading Petri net took 0.720 real 1.040 user 0.790 sys
pnml2lts-mc( 0/ 4): LTL layer: formula: /tmp/ltl_12_
pnml2lts-mc( 0/ 4): buchi has 2 states
pnml2lts-mc( 0/ 4): Weak Buchi automaton detected, adding non-accepting as progress label.
pnml2lts-mc( 0/ 4): There are 2852 state labels and 1 edge labels
pnml2lts-mc( 0/ 4): State length is 2851, there are 4043 groups
pnml2lts-mc( 0/ 4): Running ufscc using 4 cores
pnml2lts-mc( 0/ 4): Using a tree table with 2^30 elements
pnml2lts-mc( 0/ 4): Successor permutation: dynamic
pnml2lts-mc( 0/ 4): Global bits: 0, count bits: 0, local bits: 0
pnml2lts-mc( 0/ 4):
pnml2lts-mc( 0/ 4): Accepting cycle FOUND at depth ~58!
pnml2lts-mc( 0/ 4):
pnml2lts-mc( 0/ 4):
pnml2lts-mc( 0/ 4): total scc count: 0
pnml2lts-mc( 0/ 4): unique states count: 178
pnml2lts-mc( 0/ 4): unique transitions count: 43766
pnml2lts-mc( 0/ 4): - self-loop count: 0
pnml2lts-mc( 0/ 4): - claim dead count: 0
pnml2lts-mc( 0/ 4): - claim found count: 3
pnml2lts-mc( 0/ 4): - claim success count: 181
pnml2lts-mc( 0/ 4): - cum. max stack depth: 181
pnml2lts-mc( 0/ 4):
pnml2lts-mc( 0/ 4): Explored 181 states 45930 transitions, fanout: 253.757
pnml2lts-mc( 0/ 4): Total exploration time 1.140 sec (1.140 sec minimum, 1.140 sec on average)
pnml2lts-mc( 0/ 4): States per second: 159, Transitions per second: 40289
pnml2lts-mc( 0/ 4):
pnml2lts-mc( 0/ 4): Queue width: 12B, total height: 0, memory: 0.00MB
pnml2lts-mc( 0/ 4): Tree memory: 0.8MB, 20.3 B/state, compr.: 0.2%
pnml2lts-mc( 0/ 4): Tree fill ratio (roots/leafs): 0.0%/0.0%
pnml2lts-mc( 0/ 4): Stored 4169 string chucks using 0MB
pnml2lts-mc( 0/ 4): Total memory used for chunk indexing: 0MB
pnml2lts-mc( 0/ 4): Est. total memory use: 0.8MB (~8192.0MB paged-in)
ltl formula name BART-PT-020-LTLFireability-13
ltl formula formula --ltl=/tmp/ltl_13_
pnml2lts-mc( 0/ 4): Loading model from model.pnml
pnml2lts-mc( 0/ 4): Edge label is id
pnml2lts-mc( 0/ 4): Petri net has 2850 places, 4040 transitions and 32400 arcs
pnml2lts-mc( 0/ 4): Petri net BART-PT-020 analyzed
pnml2lts-mc( 0/ 4): There are no safe places
pnml2lts-mc( 0/ 4): Loading Petri net took 0.740 real 0.970 user 0.850 sys
pnml2lts-mc( 3/ 4): LTL layer: formula: /tmp/ltl_13_
pnml2lts-mc( 0/ 4): Weak Buchi automaton detected, adding non-accepting as progress label.
pnml2lts-mc( 0/ 4): There are 2852 state labels and 1 edge labels
pnml2lts-mc( 0/ 4): State length is 2851, there are 4043 groups
pnml2lts-mc( 0/ 4): Running ufscc using 4 cores
pnml2lts-mc( 0/ 4): Using a tree table with 2^30 elements
pnml2lts-mc( 0/ 4): Successor permutation: dynamic
pnml2lts-mc( 0/ 4): Global bits: 0, count bits: 0, local bits: 0
pnml2lts-mc( 1/ 4):
pnml2lts-mc( 1/ 4): Accepting cycle FOUND at depth ~110!
pnml2lts-mc( 1/ 4):
pnml2lts-mc( 0/ 4):
pnml2lts-mc( 0/ 4): total scc count: 0
pnml2lts-mc( 0/ 4): unique states count: 279
pnml2lts-mc( 0/ 4): unique transitions count: 63737
pnml2lts-mc( 0/ 4): - self-loop count: 0
pnml2lts-mc( 0/ 4): - claim dead count: 0
pnml2lts-mc( 0/ 4): - claim found count: 2
pnml2lts-mc( 0/ 4): - claim success count: 282
pnml2lts-mc( 0/ 4): - cum. max stack depth: 282
pnml2lts-mc( 0/ 4):
pnml2lts-mc( 0/ 4): Explored 282 states 65901 transitions, fanout: 233.691
pnml2lts-mc( 0/ 4): Total exploration time 1.630 sec (1.620 sec minimum, 1.622 sec on average)
pnml2lts-mc( 0/ 4): States per second: 173, Transitions per second: 40430
pnml2lts-mc( 0/ 4):
pnml2lts-mc( 0/ 4): Queue width: 12B, total height: 0, memory: 0.00MB
pnml2lts-mc( 0/ 4): Tree memory: 1.2MB, 19.6 B/state, compr.: 0.2%
pnml2lts-mc( 0/ 4): Tree fill ratio (roots/leafs): 0.0%/0.0%
pnml2lts-mc( 0/ 4): Stored 4169 string chucks using 0MB
pnml2lts-mc( 0/ 4): Total memory used for chunk indexing: 0MB
pnml2lts-mc( 0/ 4): Est. total memory use: 1.2MB (~8192.0MB paged-in)
ltl formula name BART-PT-020-LTLFireability-14
ltl formula formula --ltl=/tmp/ltl_14_
pnml2lts-mc( 0/ 4): Loading model from model.pnml
pnml2lts-mc( 0/ 4): Edge label is id
pnml2lts-mc( 0/ 4): Petri net has 2850 places, 4040 transitions and 32400 arcs
pnml2lts-mc( 0/ 4): Petri net BART-PT-020 analyzed
pnml2lts-mc( 0/ 4): There are no safe places
pnml2lts-mc( 0/ 4): Loading Petri net took 0.760 real 1.060 user 0.800 sys
pnml2lts-mc( 0/ 4): LTL layer: formula: /tmp/ltl_14_
pnml2lts-mc( 0/ 4): buchi has 3 states
pnml2lts-mc( 0/ 4): Weak Buchi automaton detected, adding non-accepting as progress label.
pnml2lts-mc( 0/ 4): There are 2852 state labels and 1 edge labels
pnml2lts-mc( 0/ 4): State length is 2851, there are 4044 groups
pnml2lts-mc( 0/ 4): Running ufscc using 4 cores
pnml2lts-mc( 0/ 4): Using a tree table with 2^30 elements
pnml2lts-mc( 0/ 4): Successor permutation: dynamic
pnml2lts-mc( 0/ 4): Global bits: 0, count bits: 0, local bits: 0
pnml2lts-mc( 2/ 4):
pnml2lts-mc( 2/ 4): Accepting cycle FOUND at depth ~82!
pnml2lts-mc( 2/ 4):
pnml2lts-mc( 0/ 4):
pnml2lts-mc( 0/ 4): total scc count: 0
pnml2lts-mc( 0/ 4): unique states count: 308
pnml2lts-mc( 0/ 4): unique transitions count: 38591
pnml2lts-mc( 0/ 4): - self-loop count: 0
pnml2lts-mc( 0/ 4): - claim dead count: 0
pnml2lts-mc( 0/ 4): - claim found count: 1
pnml2lts-mc( 0/ 4): - claim success count: 311
pnml2lts-mc( 0/ 4): - cum. max stack depth: 311
pnml2lts-mc( 0/ 4):
pnml2lts-mc( 0/ 4): Explored 311 states 40755 transitions, fanout: 131.045
pnml2lts-mc( 0/ 4): Total exploration time 1.250 sec (1.250 sec minimum, 1.250 sec on average)
pnml2lts-mc( 0/ 4): States per second: 249, Transitions per second: 32604
pnml2lts-mc( 0/ 4):
pnml2lts-mc( 0/ 4): Queue width: 12B, total height: 0, memory: 0.00MB
pnml2lts-mc( 0/ 4): Tree memory: 0.8MB, 22.2 B/state, compr.: 0.2%
pnml2lts-mc( 0/ 4): Tree fill ratio (roots/leafs): 0.0%/0.0%
pnml2lts-mc( 0/ 4): Stored 4169 string chucks using 0MB
pnml2lts-mc( 0/ 4): Total memory used for chunk indexing: 0MB
pnml2lts-mc( 0/ 4): Est. total memory use: 0.8MB (~8192.0MB paged-in)
ltl formula name BART-PT-020-LTLFireability-15
ltl formula formula --ltl=/tmp/ltl_15_
pnml2lts-mc( 0/ 4): Loading model from model.pnml
pnml2lts-mc( 0/ 4): Edge label is id
pnml2lts-mc( 0/ 4): Petri net has 2850 places, 4040 transitions and 32400 arcs
pnml2lts-mc( 0/ 4): Petri net BART-PT-020 analyzed
pnml2lts-mc( 0/ 4): There are no safe places
pnml2lts-mc( 0/ 4): Loading Petri net took 0.720 real 0.990 user 0.770 sys
pnml2lts-mc( 1/ 4): LTL layer: formula: /tmp/ltl_15_
pnml2lts-mc( 0/ 4): Weak Buchi automaton detected, adding non-accepting as progress label.
pnml2lts-mc( 0/ 4): There are 2852 state labels and 1 edge labels
pnml2lts-mc( 0/ 4): State length is 2851, there are 4042 groups
pnml2lts-mc( 0/ 4): Running ufscc using 4 cores
pnml2lts-mc( 0/ 4): Using a tree table with 2^30 elements
pnml2lts-mc( 0/ 4): Successor permutation: dynamic
pnml2lts-mc( 0/ 4): Global bits: 0, count bits: 0, local bits: 0
pnml2lts-mc( 0/ 4):
pnml2lts-mc( 0/ 4): Accepting cycle FOUND at depth ~94!
pnml2lts-mc( 0/ 4):
pnml2lts-mc( 0/ 4):
pnml2lts-mc( 0/ 4): total scc count: 0
pnml2lts-mc( 0/ 4): unique states count: 341
pnml2lts-mc( 0/ 4): unique transitions count: 39158
pnml2lts-mc( 0/ 4): - self-loop count: 0
pnml2lts-mc( 0/ 4): - claim dead count: 0
pnml2lts-mc( 0/ 4): - claim found count: 1
pnml2lts-mc( 0/ 4): - claim success count: 344
pnml2lts-mc( 0/ 4): - cum. max stack depth: 344
pnml2lts-mc( 0/ 4):
pnml2lts-mc( 0/ 4): Explored 344 states 41322 transitions, fanout: 120.122
pnml2lts-mc( 0/ 4): Total exploration time 1.330 sec (1.320 sec minimum, 1.327 sec on average)
pnml2lts-mc( 0/ 4): States per second: 259, Transitions per second: 31069
pnml2lts-mc( 0/ 4):
pnml2lts-mc( 0/ 4): Queue width: 12B, total height: 0, memory: 0.00MB
pnml2lts-mc( 0/ 4): Tree memory: 0.8MB, 21.6 B/state, compr.: 0.2%
pnml2lts-mc( 0/ 4): Tree fill ratio (roots/leafs): 0.0%/0.0%
pnml2lts-mc( 0/ 4): Stored 4169 string chucks using 0MB
pnml2lts-mc( 0/ 4): Total memory used for chunk indexing: 0MB
pnml2lts-mc( 0/ 4): Est. total memory use: 0.8MB (~8192.0MB paged-in)
Sequence of Actions to be Executed by the VM
This is useful if one wants to reexecute the tool in the VM from the submitted image disk.
set -x
# this is for BenchKit: configuration of major elements for the test
export BK_INPUT="BART-PT-020"
export BK_EXAMINATION="LTLFireability"
export BK_TOOL="ltsmin"
export BK_RESULT_DIR="/tmp/BK_RESULTS/OUTPUTS"
export BK_TIME_CONFINEMENT="3600"
export BK_MEMORY_CONFINEMENT="16384"
# this is specific to your benchmark or test
export BIN_DIR="$HOME/BenchKit/bin"
# remove the execution directoty if it exists (to avoid increse of .vmdk images)
if [ -d execution ] ; then
rm -rf execution
fi
tar xzf /home/mcc/BenchKit/INPUTS/BART-PT-020.tgz
mv BART-PT-020 execution
cd execution
pwd
ls -lh
# this is for BenchKit: explicit launching of the test
echo "====================================================================="
echo " Generated by BenchKit 2-3637"
echo " Executing tool ltsmin"
echo " Input is BART-PT-020, examination is LTLFireability"
echo " Time confinement is $BK_TIME_CONFINEMENT seconds"
echo " Memory confinement is 16384 MBytes"
echo " Number of cores is 4"
echo " Run identifier is r221-ebro-152732363300024"
echo "====================================================================="
echo
echo "--------------------"
echo "content from stdout:"
echo
echo "=== Data for post analysis generated by BenchKit (invocation template)"
echo
if [ "LTLFireability" = "UpperBounds" ] ; then
echo "The expected result is a vector of positive values"
echo NUM_VECTOR
elif [ "LTLFireability" != "StateSpace" ] ; then
echo "The expected result is a vector of booleans"
echo BOOL_VECTOR
else
echo "no data necessary for post analysis"
fi
echo
if [ -f "LTLFireability.txt" ] ; then
echo "here is the order used to build the result vector(from text file)"
for x in $(grep Property LTLFireability.txt | cut -d ' ' -f 2 | sort -u) ; do
echo "FORMULA_NAME $x"
done
elif [ -f "LTLFireability.xml" ] ; then # for cunf (txt files deleted;-)
echo echo "here is the order used to build the result vector(from xml file)"
for x in $(grep '
echo "FORMULA_NAME $x"
done
fi
echo
echo "=== Now, execution of the tool begins"
echo
echo -n "BK_START "
date -u +%s%3N
echo
timeout -s 9 $BK_TIME_CONFINEMENT bash -c "/home/mcc/BenchKit/BenchKit_head.sh 2> STDERR ; echo ; echo -n \"BK_STOP \" ; date -u +%s%3N"
if [ $? -eq 137 ] ; then
echo
echo "BK_TIME_CONFINEMENT_REACHED"
fi
echo
echo "--------------------"
echo "content from stderr:"
echo
cat STDERR ;