

About the Execution of LTSMin for BART-PT-020
| Execution Summary | |||||
| Max Memory Used (MB) |
Time wait (ms) | CPU Usage (ms) | I/O Wait (ms) | Computed Result | Execution Status |
| 10376.860 | 1826205.00 | 3906808.00 | 113.70 | ???TT?T?F?T?FT?T | normal |
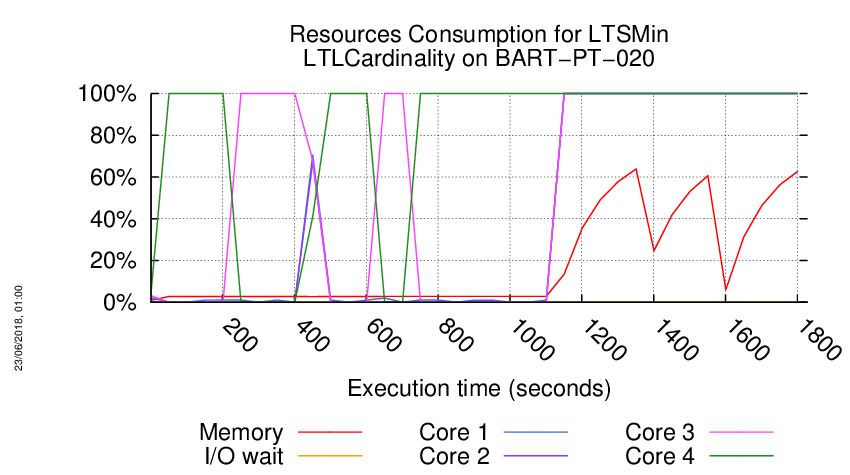
Execution Chart
We display below the execution chart for this examination (boot time has been removed).
Trace from the execution
Waiting for the VM to be ready (probing ssh)
....................
/home/mcc/execution
total 14M
-rw-r--r-- 1 mcc users 660K May 15 18:54 CTLCardinality.txt
-rw-r--r-- 1 mcc users 1.6M May 15 18:54 CTLCardinality.xml
-rw-r--r-- 1 mcc users 150K May 15 18:54 CTLFireability.txt
-rw-r--r-- 1 mcc users 401K May 15 18:54 CTLFireability.xml
-rw-r--r-- 1 mcc users 4.0K May 15 18:49 GenericPropertiesDefinition.xml
-rw-r--r-- 1 mcc users 6.1K May 15 18:49 GenericPropertiesVerdict.xml
-rw-r--r-- 1 mcc users 189K May 26 09:26 LTLCardinality.txt
-rw-r--r-- 1 mcc users 444K May 26 09:26 LTLCardinality.xml
-rw-r--r-- 1 mcc users 117K May 26 09:26 LTLFireability.txt
-rw-r--r-- 1 mcc users 278K May 26 09:26 LTLFireability.xml
-rw-r--r-- 1 mcc users 812K May 15 18:54 ReachabilityCardinality.txt
-rw-r--r-- 1 mcc users 2.0M May 15 18:54 ReachabilityCardinality.xml
-rw-r--r-- 1 mcc users 102 May 15 18:54 ReachabilityDeadlock.txt
-rw-r--r-- 1 mcc users 340 May 15 18:54 ReachabilityDeadlock.xml
-rw-r--r-- 1 mcc users 657K May 15 18:54 ReachabilityFireability.txt
-rw-r--r-- 1 mcc users 1.6M May 15 18:54 ReachabilityFireability.xml
-rw-r--r-- 1 mcc users 70K May 15 18:54 UpperBounds.txt
-rw-r--r-- 1 mcc users 135K May 15 18:54 UpperBounds.xml
-rw-r--r-- 1 mcc users 5 May 15 18:49 equiv_col
-rw-r--r-- 1 mcc users 4 May 15 18:49 instance
-rw-r--r-- 1 mcc users 6 May 15 18:49 iscolored
-rw-r--r-- 1 mcc users 4.7M May 15 18:49 model.pnml
=====================================================================
Generated by BenchKit 2-3637
Executing tool ltsmin
Input is BART-PT-020, examination is LTLCardinality
Time confinement is 3600 seconds
Memory confinement is 16384 MBytes
Number of cores is 4
Run identifier is r221-ebro-152732363300023
=====================================================================
--------------------
content from stdout:
=== Data for post analysis generated by BenchKit (invocation template)
The expected result is a vector of booleans
BOOL_VECTOR
here is the order used to build the result vector(from text file)
FORMULA_NAME BART-PT-020-LTLCardinality-00
FORMULA_NAME BART-PT-020-LTLCardinality-01
FORMULA_NAME BART-PT-020-LTLCardinality-02
FORMULA_NAME BART-PT-020-LTLCardinality-03
FORMULA_NAME BART-PT-020-LTLCardinality-04
FORMULA_NAME BART-PT-020-LTLCardinality-05
FORMULA_NAME BART-PT-020-LTLCardinality-06
FORMULA_NAME BART-PT-020-LTLCardinality-07
FORMULA_NAME BART-PT-020-LTLCardinality-08
FORMULA_NAME BART-PT-020-LTLCardinality-09
FORMULA_NAME BART-PT-020-LTLCardinality-10
FORMULA_NAME BART-PT-020-LTLCardinality-11
FORMULA_NAME BART-PT-020-LTLCardinality-12
FORMULA_NAME BART-PT-020-LTLCardinality-13
FORMULA_NAME BART-PT-020-LTLCardinality-14
FORMULA_NAME BART-PT-020-LTLCardinality-15
=== Now, execution of the tool begins
BK_START 1527484395304
FORMULA BART-PT-020-LTLCardinality-00 CANNOT_COMPUTE
FORMULA BART-PT-020-LTLCardinality-01 CANNOT_COMPUTE
FORMULA BART-PT-020-LTLCardinality-02 CANNOT_COMPUTE
FORMULA BART-PT-020-LTLCardinality-03 TRUE TECHNIQUES EXPLICIT PARALLEL_PROCESSING USE_NUPN
FORMULA BART-PT-020-LTLCardinality-04 TRUE TECHNIQUES EXPLICIT PARALLEL_PROCESSING USE_NUPN
FORMULA BART-PT-020-LTLCardinality-05 CANNOT_COMPUTE
FORMULA BART-PT-020-LTLCardinality-06 TRUE TECHNIQUES EXPLICIT PARALLEL_PROCESSING USE_NUPN
FORMULA BART-PT-020-LTLCardinality-07 CANNOT_COMPUTE
FORMULA BART-PT-020-LTLCardinality-08 FALSE TECHNIQUES EXPLICIT PARALLEL_PROCESSING USE_NUPN
FORMULA BART-PT-020-LTLCardinality-09 CANNOT_COMPUTE
FORMULA BART-PT-020-LTLCardinality-10 TRUE TECHNIQUES EXPLICIT PARALLEL_PROCESSING USE_NUPN
FORMULA BART-PT-020-LTLCardinality-11 CANNOT_COMPUTE
FORMULA BART-PT-020-LTLCardinality-12 FALSE TECHNIQUES EXPLICIT PARALLEL_PROCESSING USE_NUPN
FORMULA BART-PT-020-LTLCardinality-13 TRUE TECHNIQUES EXPLICIT PARALLEL_PROCESSING USE_NUPN
FORMULA BART-PT-020-LTLCardinality-14 CANNOT_COMPUTE
FORMULA BART-PT-020-LTLCardinality-15 TRUE TECHNIQUES EXPLICIT PARALLEL_PROCESSING USE_NUPN
BK_STOP 1527486221509
--------------------
content from stderr:
mcc2018
ltl formula name BART-PT-020-LTLCardinality-00
ltl formula formula --ltl=/tmp/ltl_0_
pnml2lts-mc( 0/ 4): Loading model from model.pnml
pnml2lts-mc( 0/ 4): Edge label is id
pnml2lts-mc( 0/ 4): Petri net has 2850 places, 4040 transitions and 32400 arcs
pnml2lts-mc( 0/ 4): Petri net BART-PT-020 analyzed
pnml2lts-mc( 0/ 4): There are no safe places
pnml2lts-mc( 0/ 4): Loading Petri net took 0.750 real 1.050 user 0.750 sys
pnml2lts-mc( 1/ 4): LTL layer: formula: /tmp/ltl_0_
ltl formula name BART-PT-020-LTLCardinality-01
ltl formula formula --ltl=/tmp/ltl_1_
pnml2lts-mc( 0/ 4): Loading model from model.pnml
pnml2lts-mc( 0/ 4): Edge label is id
pnml2lts-mc( 0/ 4): Petri net has 2850 places, 4040 transitions and 32400 arcs
pnml2lts-mc( 0/ 4): Petri net BART-PT-020 analyzed
pnml2lts-mc( 0/ 4): There are no safe places
pnml2lts-mc( 0/ 4): Loading Petri net took 1.460 real 0.880 user 2.430 sys
pnml2lts-mc( 2/ 4): LTL layer: formula: /tmp/ltl_1_
ltl formula name BART-PT-020-LTLCardinality-02
ltl formula formula --ltl=/tmp/ltl_2_
pnml2lts-mc( 0/ 4): Loading model from model.pnml
pnml2lts-mc( 0/ 4): Edge label is id
pnml2lts-mc( 0/ 4): Petri net has 2850 places, 4040 transitions and 32400 arcs
pnml2lts-mc( 0/ 4): Petri net BART-PT-020 analyzed
pnml2lts-mc( 2/ 4): LTL layer: formula: /tmp/ltl_2_
pnml2lts-mc( 0/ 4): There are no safe places
pnml2lts-mc( 0/ 4): Loading Petri net took 2.550 real 1.390 user 3.670 sys
ltl formula name BART-PT-020-LTLCardinality-03
ltl formula formula --ltl=/tmp/ltl_3_
pnml2lts-mc( 0/ 4): Loading model from model.pnml
pnml2lts-mc( 0/ 4): Edge label is id
pnml2lts-mc( 0/ 4): Petri net has 2850 places, 4040 transitions and 32400 arcs
pnml2lts-mc( 0/ 4): Petri net BART-PT-020 analyzed
pnml2lts-mc( 0/ 4): There are no safe places
pnml2lts-mc( 2/ 4): LTL layer: formula: /tmp/ltl_3_
pnml2lts-mc( 0/ 4): Loading Petri net took 1.800 real 0.990 user 2.600 sys
pnml2lts-mc( 0/ 4): Weak Buchi automaton detected, adding non-accepting as progress label.
pnml2lts-mc( 0/ 4): There are 2852 state labels and 1 edge labels
pnml2lts-mc( 0/ 4): State length is 2851, there are 4041 groups
pnml2lts-mc( 0/ 4): Running ufscc using 4 cores
pnml2lts-mc( 0/ 4): Using a tree table with 2^30 elements
pnml2lts-mc( 0/ 4): Successor permutation: dynamic
pnml2lts-mc( 0/ 4): Global bits: 0, count bits: 0, local bits: 0
pnml2lts-mc( 0/ 4):
pnml2lts-mc( 0/ 4): total scc count: 1
pnml2lts-mc( 0/ 4): unique states count: 1
pnml2lts-mc( 0/ 4): unique transitions count: 0
pnml2lts-mc( 0/ 4): - self-loop count: 0
pnml2lts-mc( 0/ 4): - claim dead count: 0
pnml2lts-mc( 0/ 4): - claim found count: 0
pnml2lts-mc( 0/ 4): - claim success count: 4
pnml2lts-mc( 0/ 4): - cum. max stack depth: 4
pnml2lts-mc( 0/ 4):
pnml2lts-mc( 0/ 4): Explored 4 states 4 transitions, fanout: 1.000
pnml2lts-mc( 0/ 4): Total exploration time 0.010 sec (0.000 sec minimum, 0.007 sec on average)
pnml2lts-mc( 0/ 4): States per second: 400, Transitions per second: 400
pnml2lts-mc( 0/ 4):
pnml2lts-mc( 0/ 4): Queue width: 12B, total height: 0, memory: 0.00MB
pnml2lts-mc( 0/ 4): Tree memory: 0.0MB, 216.0 B/state, compr.: 1.9%
pnml2lts-mc( 0/ 4): Tree fill ratio (roots/leafs): 0.0%/0.0%
pnml2lts-mc( 0/ 4): Stored 4169 string chucks using 0MB
pnml2lts-mc( 0/ 4): Total memory used for chunk indexing: 0MB
pnml2lts-mc( 0/ 4): Est. total memory use: 0.0MB (~8192.0MB paged-in)
ltl formula name BART-PT-020-LTLCardinality-04
ltl formula formula --ltl=/tmp/ltl_4_
pnml2lts-mc( 0/ 4): Loading model from model.pnml
pnml2lts-mc( 0/ 4): Edge label is id
pnml2lts-mc( 0/ 4): Petri net has 2850 places, 4040 transitions and 32400 arcs
pnml2lts-mc( 0/ 4): Petri net BART-PT-020 analyzed
pnml2lts-mc( 1/ 4): LTL layer: formula: /tmp/ltl_4_
pnml2lts-mc( 0/ 4): There are no safe places
pnml2lts-mc( 0/ 4): Loading Petri net took 2.020 real 1.090 user 2.950 sys
pnml2lts-mc( 0/ 4): Weak Buchi automaton detected, adding non-accepting as progress label.
pnml2lts-mc( 0/ 4): There are 2852 state labels and 1 edge labels
pnml2lts-mc( 0/ 4): State length is 2851, there are 4043 groups
pnml2lts-mc( 0/ 4): Running ufscc using 4 cores
pnml2lts-mc( 0/ 4): Using a tree table with 2^30 elements
pnml2lts-mc( 0/ 4): Successor permutation: dynamic
pnml2lts-mc( 0/ 4): Global bits: 0, count bits: 0, local bits: 0
pnml2lts-mc( 0/ 4):
pnml2lts-mc( 0/ 4): total scc count: 721
pnml2lts-mc( 0/ 4): unique states count: 721
pnml2lts-mc( 0/ 4): unique transitions count: 720
pnml2lts-mc( 0/ 4): - self-loop count: 0
pnml2lts-mc( 0/ 4): - claim dead count: 1586
pnml2lts-mc( 0/ 4): - claim found count: 0
pnml2lts-mc( 0/ 4): - claim success count: 743
pnml2lts-mc( 0/ 4): - cum. max stack depth: 8
pnml2lts-mc( 0/ 4):
pnml2lts-mc( 0/ 4): Explored 743 states 2884 transitions, fanout: 3.882
pnml2lts-mc( 0/ 4): Total exploration time 1.910 sec (1.910 sec minimum, 1.910 sec on average)
pnml2lts-mc( 0/ 4): States per second: 389, Transitions per second: 1510
pnml2lts-mc( 0/ 4):
pnml2lts-mc( 0/ 4): Queue width: 12B, total height: 0, memory: 0.00MB
pnml2lts-mc( 0/ 4): Tree memory: 0.0MB, 37.0 B/state, compr.: 0.3%
pnml2lts-mc( 0/ 4): Tree fill ratio (roots/leafs): 0.0%/0.0%
pnml2lts-mc( 0/ 4): Stored 4169 string chucks using 0MB
pnml2lts-mc( 0/ 4): Total memory used for chunk indexing: 0MB
pnml2lts-mc( 0/ 4): Est. total memory use: 0.0MB (~8192.0MB paged-in)
ltl formula name BART-PT-020-LTLCardinality-05
ltl formula formula --ltl=/tmp/ltl_5_
pnml2lts-mc( 0/ 4): Loading model from model.pnml
pnml2lts-mc( 0/ 4): Edge label is id
pnml2lts-mc( 0/ 4): Petri net has 2850 places, 4040 transitions and 32400 arcs
pnml2lts-mc( 0/ 4): Petri net BART-PT-020 analyzed
pnml2lts-mc( 3/ 4): LTL layer: formula: /tmp/ltl_5_
pnml2lts-mc( 0/ 4): There are no safe places
pnml2lts-mc( 0/ 4): Loading Petri net took 1.990 real 1.130 user 2.980 sys
ltl formula name BART-PT-020-LTLCardinality-06
ltl formula formula --ltl=/tmp/ltl_6_
pnml2lts-mc( 0/ 4): Loading model from model.pnml
pnml2lts-mc( 0/ 4): Edge label is id
pnml2lts-mc( 0/ 4): Petri net has 2850 places, 4040 transitions and 32400 arcs
pnml2lts-mc( 0/ 4): Petri net BART-PT-020 analyzed
pnml2lts-mc( 0/ 4): There are no safe places
pnml2lts-mc( 0/ 4): Loading Petri net took 1.760 real 0.930 user 2.230 sys
pnml2lts-mc( 0/ 4): LTL layer: formula: /tmp/ltl_6_
pnml2lts-mc( 0/ 4): buchi has 3 states
pnml2lts-mc( 0/ 4): Weak Buchi automaton detected, adding non-accepting as progress label.
pnml2lts-mc( 0/ 4): There are 2852 state labels and 1 edge labels
pnml2lts-mc( 0/ 4): State length is 2851, there are 4043 groups
pnml2lts-mc( 0/ 4): Running ufscc using 4 cores
pnml2lts-mc( 0/ 4): Using a tree table with 2^30 elements
pnml2lts-mc( 0/ 4): Successor permutation: dynamic
pnml2lts-mc( 0/ 4): Global bits: 0, count bits: 0, local bits: 0
pnml2lts-mc( 0/ 4):
pnml2lts-mc( 0/ 4): total scc count: 721
pnml2lts-mc( 0/ 4): unique states count: 721
pnml2lts-mc( 0/ 4): unique transitions count: 720
pnml2lts-mc( 0/ 4): - self-loop count: 0
pnml2lts-mc( 0/ 4): - claim dead count: 1820
pnml2lts-mc( 0/ 4): - claim found count: 0
pnml2lts-mc( 0/ 4): - claim success count: 745
pnml2lts-mc( 0/ 4): - cum. max stack depth: 8
pnml2lts-mc( 0/ 4):
pnml2lts-mc( 0/ 4): Explored 745 states 2884 transitions, fanout: 3.871
pnml2lts-mc( 0/ 4): Total exploration time 0.960 sec (0.960 sec minimum, 0.960 sec on average)
pnml2lts-mc( 0/ 4): States per second: 776, Transitions per second: 3004
pnml2lts-mc( 0/ 4):
pnml2lts-mc( 0/ 4): Queue width: 12B, total height: 0, memory: 0.00MB
pnml2lts-mc( 0/ 4): Tree memory: 0.0MB, 37.0 B/state, compr.: 0.3%
pnml2lts-mc( 0/ 4): Tree fill ratio (roots/leafs): 0.0%/0.0%
pnml2lts-mc( 0/ 4): Stored 4169 string chucks using 0MB
pnml2lts-mc( 0/ 4): Total memory used for chunk indexing: 0MB
pnml2lts-mc( 0/ 4): Est. total memory use: 0.0MB (~8192.0MB paged-in)
ltl formula name BART-PT-020-LTLCardinality-07
ltl formula formula --ltl=/tmp/ltl_7_
pnml2lts-mc( 0/ 4): Loading model from model.pnml
pnml2lts-mc( 0/ 4): Edge label is id
pnml2lts-mc( 0/ 4): Petri net has 2850 places, 4040 transitions and 32400 arcs
pnml2lts-mc( 0/ 4): Petri net BART-PT-020 analyzed
pnml2lts-mc( 0/ 4): There are no safe places
pnml2lts-mc( 0/ 4): Loading Petri net took 0.640 real 0.880 user 0.780 sys
pnml2lts-mc( 1/ 4): LTL layer: formula: /tmp/ltl_7_
ltl formula name BART-PT-020-LTLCardinality-08
ltl formula formula --ltl=/tmp/ltl_8_
pnml2lts-mc( 0/ 4): Loading model from model.pnml
pnml2lts-mc( 0/ 4): Edge label is id
pnml2lts-mc( 0/ 4): Petri net has 2850 places, 4040 transitions and 32400 arcs
pnml2lts-mc( 0/ 4): Petri net BART-PT-020 analyzed
pnml2lts-mc( 0/ 4): There are no safe places
pnml2lts-mc( 0/ 4): Loading Petri net took 0.650 real 0.970 user 0.680 sys
pnml2lts-mc( 1/ 4): LTL layer: formula: /tmp/ltl_8_
pnml2lts-mc( 0/ 4): Weak Buchi automaton detected, adding non-accepting as progress label.
pnml2lts-mc( 0/ 4): There are 2852 state labels and 1 edge labels
pnml2lts-mc( 0/ 4): State length is 2851, there are 4042 groups
pnml2lts-mc( 0/ 4): Running ufscc using 4 cores
pnml2lts-mc( 0/ 4): Using a tree table with 2^30 elements
pnml2lts-mc( 0/ 4): Successor permutation: dynamic
pnml2lts-mc( 0/ 4): Global bits: 0, count bits: 0, local bits: 0
pnml2lts-mc( 3/ 4):
pnml2lts-mc( 3/ 4): Accepting cycle FOUND at depth ~66!
pnml2lts-mc( 3/ 4):
pnml2lts-mc( 0/ 4):
pnml2lts-mc( 0/ 4): total scc count: 0
pnml2lts-mc( 0/ 4): unique states count: 265
pnml2lts-mc( 0/ 4): unique transitions count: 36821
pnml2lts-mc( 0/ 4): - self-loop count: 0
pnml2lts-mc( 0/ 4): - claim dead count: 0
pnml2lts-mc( 0/ 4): - claim found count: 1
pnml2lts-mc( 0/ 4): - claim success count: 268
pnml2lts-mc( 0/ 4): - cum. max stack depth: 268
pnml2lts-mc( 0/ 4):
pnml2lts-mc( 0/ 4): Explored 268 states 38985 transitions, fanout: 145.466
pnml2lts-mc( 0/ 4): Total exploration time 1.240 sec (1.240 sec minimum, 1.240 sec on average)
pnml2lts-mc( 0/ 4): States per second: 216, Transitions per second: 31440
pnml2lts-mc( 0/ 4):
pnml2lts-mc( 0/ 4): Queue width: 12B, total height: 0, memory: 0.00MB
pnml2lts-mc( 0/ 4): Tree memory: 0.8MB, 21.9 B/state, compr.: 0.2%
pnml2lts-mc( 0/ 4): Tree fill ratio (roots/leafs): 0.0%/0.0%
pnml2lts-mc( 0/ 4): Stored 4169 string chucks using 0MB
pnml2lts-mc( 0/ 4): Total memory used for chunk indexing: 0MB
pnml2lts-mc( 0/ 4): Est. total memory use: 0.8MB (~8192.0MB paged-in)
ltl formula name BART-PT-020-LTLCardinality-09
ltl formula formula --ltl=/tmp/ltl_9_
pnml2lts-mc( 0/ 4): Loading model from model.pnml
pnml2lts-mc( 0/ 4): Edge label is id
pnml2lts-mc( 0/ 4): Petri net has 2850 places, 4040 transitions and 32400 arcs
pnml2lts-mc( 0/ 4): Petri net BART-PT-020 analyzed
pnml2lts-mc( 0/ 4): There are no safe places
pnml2lts-mc( 0/ 4): Loading Petri net took 0.670 real 0.940 user 0.760 sys
pnml2lts-mc( 2/ 4): LTL layer: formula: /tmp/ltl_9_
pnml2lts-mc( 0/ 4): There are 2851 state labels and 1 edge labels
pnml2lts-mc( 0/ 4): State length is 2851, there are 4051 groups
pnml2lts-mc( 0/ 4): Running ufscc using 4 cores
pnml2lts-mc( 0/ 4): Using a tree table with 2^30 elements
pnml2lts-mc( 0/ 4): Successor permutation: dynamic
pnml2lts-mc( 0/ 4): Global bits: 0, count bits: 0, local bits: 0
pnml2lts-mc( 1/ 4): ~2500 levels ~10000 states ~278488 transitions
pnml2lts-mc( 1/ 4): ~5000 levels ~20000 states ~524336 transitions
pnml2lts-mc( 1/ 4): ~10000 levels ~40000 states ~1017672 transitions
pnml2lts-mc( 1/ 4): ~20000 levels ~80000 states ~2000776 transitions
pnml2lts-mc( 1/ 4): ~40000 levels ~160000 states ~3969240 transitions
ltl formula name BART-PT-020-LTLCardinality-10
ltl formula formula --ltl=/tmp/ltl_10_
pnml2lts-mc( 0/ 4): Loading model from model.pnml
pnml2lts-mc( 0/ 4): Edge label is id
pnml2lts-mc( 0/ 4): Petri net has 2850 places, 4040 transitions and 32400 arcs
pnml2lts-mc( 0/ 4): Petri net BART-PT-020 analyzed
pnml2lts-mc( 0/ 4): There are no safe places
pnml2lts-mc( 0/ 4): Loading Petri net took 0.640 real 0.950 user 0.730 sys
pnml2lts-mc( 3/ 4): LTL layer: formula: /tmp/ltl_10_
pnml2lts-mc( 0/ 4): Weak Buchi automaton detected, adding non-accepting as progress label.
pnml2lts-mc( 0/ 4): There are 2852 state labels and 1 edge labels
pnml2lts-mc( 0/ 4): State length is 2851, there are 4041 groups
pnml2lts-mc( 0/ 4): Running ufscc using 4 cores
pnml2lts-mc( 0/ 4): Using a tree table with 2^30 elements
pnml2lts-mc( 0/ 4): Successor permutation: dynamic
pnml2lts-mc( 0/ 4): Global bits: 0, count bits: 0, local bits: 0
pnml2lts-mc( 0/ 4):
pnml2lts-mc( 0/ 4): total scc count: 1
pnml2lts-mc( 0/ 4): unique states count: 1
pnml2lts-mc( 0/ 4): unique transitions count: 0
pnml2lts-mc( 0/ 4): - self-loop count: 0
pnml2lts-mc( 0/ 4): - claim dead count: 0
pnml2lts-mc( 0/ 4): - claim found count: 0
pnml2lts-mc( 0/ 4): - claim success count: 4
pnml2lts-mc( 0/ 4): - cum. max stack depth: 4
pnml2lts-mc( 0/ 4):
pnml2lts-mc( 0/ 4): Explored 4 states 4 transitions, fanout: 1.000
pnml2lts-mc( 0/ 4): Total exploration time 0.000 sec (0.000 sec minimum, 0.000 sec on average)
pnml2lts-mc( 0/ 4): States per second: inf, Transitions per second: inf
pnml2lts-mc( 0/ 4):
pnml2lts-mc( 0/ 4): Queue width: 12B, total height: 0, memory: 0.00MB
pnml2lts-mc( 0/ 4): Tree memory: 0.0MB, 216.0 B/state, compr.: 1.9%
pnml2lts-mc( 0/ 4): Tree fill ratio (roots/leafs): 0.0%/0.0%
pnml2lts-mc( 0/ 4): Stored 4169 string chucks using 0MB
pnml2lts-mc( 0/ 4): Total memory used for chunk indexing: 0MB
pnml2lts-mc( 0/ 4): Est. total memory use: 0.0MB (~8192.0MB paged-in)
ltl formula name BART-PT-020-LTLCardinality-11
ltl formula formula --ltl=/tmp/ltl_11_
pnml2lts-mc( 0/ 4): Loading model from model.pnml
pnml2lts-mc( 0/ 4): Edge label is id
pnml2lts-mc( 0/ 4): Petri net has 2850 places, 4040 transitions and 32400 arcs
pnml2lts-mc( 0/ 4): Petri net BART-PT-020 analyzed
pnml2lts-mc( 0/ 4): There are no safe places
pnml2lts-mc( 0/ 4): Loading Petri net took 0.690 real 0.980 user 0.710 sys
pnml2lts-mc( 3/ 4): LTL layer: formula: /tmp/ltl_11_
pnml2lts-mc( 0/ 4): There are 2851 state labels and 1 edge labels
pnml2lts-mc( 0/ 4): State length is 2851, there are 4044 groups
pnml2lts-mc( 0/ 4): Running ufscc using 4 cores
pnml2lts-mc( 0/ 4): Using a tree table with 2^30 elements
pnml2lts-mc( 0/ 4): Successor permutation: dynamic
pnml2lts-mc( 0/ 4): Global bits: 0, count bits: 0, local bits: 0
pnml2lts-mc( 1/ 4): ~2500 levels ~10000 states ~283116 transitions
pnml2lts-mc( 1/ 4): ~5000 levels ~20000 states ~530868 transitions
pnml2lts-mc( 1/ 4): ~10000 levels ~40000 states ~1022172 transitions
pnml2lts-mc( 1/ 4): ~20000 levels ~80000 states ~1992476 transitions
pnml2lts-mc( 1/ 4): ~40000 levels ~160000 states ~3925056 transitions
ltl formula name BART-PT-020-LTLCardinality-12
ltl formula formula --ltl=/tmp/ltl_12_
pnml2lts-mc( 0/ 4): Loading model from model.pnml
pnml2lts-mc( 0/ 4): Edge label is id
pnml2lts-mc( 0/ 4): Petri net has 2850 places, 4040 transitions and 32400 arcs
pnml2lts-mc( 0/ 4): Petri net BART-PT-020 analyzed
pnml2lts-mc( 0/ 4): There are no safe places
pnml2lts-mc( 0/ 4): Loading Petri net took 1.000 real 1.060 user 0.970 sys
pnml2lts-mc( 0/ 4): LTL layer: formula: /tmp/ltl_12_
pnml2lts-mc( 0/ 4): buchi has 2 states
pnml2lts-mc( 0/ 4): There are 2851 state labels and 1 edge labels
pnml2lts-mc( 0/ 4): State length is 2851, there are 4044 groups
pnml2lts-mc( 0/ 4): Running ufscc using 4 cores
pnml2lts-mc( 0/ 4): Using a tree table with 2^30 elements
pnml2lts-mc( 0/ 4): Successor permutation: dynamic
pnml2lts-mc( 0/ 4): Global bits: 0, count bits: 0, local bits: 0
pnml2lts-mc( 2/ 4):
pnml2lts-mc( 2/ 4): Accepting cycle FOUND at depth ~548!
pnml2lts-mc( 2/ 4):
pnml2lts-mc( 0/ 4):
pnml2lts-mc( 0/ 4): total scc count: 0
pnml2lts-mc( 0/ 4): unique states count: 2200
pnml2lts-mc( 0/ 4): unique transitions count: 85767
pnml2lts-mc( 0/ 4): - self-loop count: 0
pnml2lts-mc( 0/ 4): - claim dead count: 0
pnml2lts-mc( 0/ 4): - claim found count: 646
pnml2lts-mc( 0/ 4): - claim success count: 2203
pnml2lts-mc( 0/ 4): - cum. max stack depth: 2203
pnml2lts-mc( 0/ 4):
pnml2lts-mc( 0/ 4): Explored 2203 states 87931 transitions, fanout: 39.914
pnml2lts-mc( 0/ 4): Total exploration time 3.970 sec (3.960 sec minimum, 3.967 sec on average)
pnml2lts-mc( 0/ 4): States per second: 555, Transitions per second: 22149
pnml2lts-mc( 0/ 4):
pnml2lts-mc( 0/ 4): Queue width: 12B, total height: 0, memory: 0.00MB
pnml2lts-mc( 0/ 4): Tree memory: 1.5MB, 18.5 B/state, compr.: 0.2%
pnml2lts-mc( 0/ 4): Tree fill ratio (roots/leafs): 0.0%/0.0%
pnml2lts-mc( 0/ 4): Stored 4169 string chucks using 0MB
pnml2lts-mc( 0/ 4): Total memory used for chunk indexing: 0MB
pnml2lts-mc( 0/ 4): Est. total memory use: 1.5MB (~8192.0MB paged-in)
ltl formula name BART-PT-020-LTLCardinality-13
ltl formula formula --ltl=/tmp/ltl_13_
pnml2lts-mc( 0/ 4): Loading model from model.pnml
pnml2lts-mc( 0/ 4): Edge label is id
pnml2lts-mc( 0/ 4): Petri net has 2850 places, 4040 transitions and 32400 arcs
pnml2lts-mc( 0/ 4): Petri net BART-PT-020 analyzed
pnml2lts-mc( 0/ 4): There are no safe places
pnml2lts-mc( 0/ 4): Loading Petri net took 0.680 real 0.970 user 0.740 sys
pnml2lts-mc( 1/ 4): LTL layer: formula: /tmp/ltl_13_
pnml2lts-mc( 0/ 4): Weak Buchi automaton detected, adding non-accepting as progress label.
pnml2lts-mc( 0/ 4): There are 2852 state labels and 1 edge labels
pnml2lts-mc( 0/ 4): State length is 2851, there are 4042 groups
pnml2lts-mc( 0/ 4): Running ufscc using 4 cores
pnml2lts-mc( 0/ 4): Using a tree table with 2^30 elements
pnml2lts-mc( 0/ 4): Successor permutation: dynamic
pnml2lts-mc( 0/ 4): Global bits: 0, count bits: 0, local bits: 0
pnml2lts-mc( 0/ 4):
pnml2lts-mc( 0/ 4): total scc count: 721
pnml2lts-mc( 0/ 4): unique states count: 721
pnml2lts-mc( 0/ 4): unique transitions count: 720
pnml2lts-mc( 0/ 4): - self-loop count: 0
pnml2lts-mc( 0/ 4): - claim dead count: 1950
pnml2lts-mc( 0/ 4): - claim found count: 0
pnml2lts-mc( 0/ 4): - claim success count: 745
pnml2lts-mc( 0/ 4): - cum. max stack depth: 8
pnml2lts-mc( 0/ 4):
pnml2lts-mc( 0/ 4): Explored 745 states 2884 transitions, fanout: 3.871
pnml2lts-mc( 0/ 4): Total exploration time 1.010 sec (1.000 sec minimum, 1.007 sec on average)
pnml2lts-mc( 0/ 4): States per second: 738, Transitions per second: 2855
pnml2lts-mc( 0/ 4):
pnml2lts-mc( 0/ 4): Queue width: 12B, total height: 0, memory: 0.00MB
pnml2lts-mc( 0/ 4): Tree memory: 0.0MB, 37.0 B/state, compr.: 0.3%
pnml2lts-mc( 0/ 4): Tree fill ratio (roots/leafs): 0.0%/0.0%
pnml2lts-mc( 0/ 4): Stored 4169 string chucks using 0MB
pnml2lts-mc( 0/ 4): Total memory used for chunk indexing: 0MB
pnml2lts-mc( 0/ 4): Est. total memory use: 0.0MB (~8192.0MB paged-in)
ltl formula name BART-PT-020-LTLCardinality-14
ltl formula formula --ltl=/tmp/ltl_14_
pnml2lts-mc( 0/ 4): Loading model from model.pnml
pnml2lts-mc( 0/ 4): Edge label is id
pnml2lts-mc( 0/ 4): Petri net has 2850 places, 4040 transitions and 32400 arcs
pnml2lts-mc( 0/ 4): Petri net BART-PT-020 analyzed
pnml2lts-mc( 0/ 4): There are no safe places
pnml2lts-mc( 0/ 4): Loading Petri net took 0.660 real 0.940 user 0.800 sys
pnml2lts-mc( 2/ 4): LTL layer: formula: /tmp/ltl_14_
pnml2lts-mc( 0/ 4): Weak Buchi automaton detected, adding non-accepting as progress label.
pnml2lts-mc( 0/ 4): There are 2852 state labels and 1 edge labels
pnml2lts-mc( 0/ 4): State length is 2851, there are 4043 groups
pnml2lts-mc( 0/ 4): Running ufscc using 4 cores
pnml2lts-mc( 0/ 4): Using a tree table with 2^30 elements
pnml2lts-mc( 0/ 4): Successor permutation: dynamic
pnml2lts-mc( 0/ 4): Global bits: 0, count bits: 0, local bits: 0
pnml2lts-mc( 2/ 4): ~2500 levels ~10000 states ~261752 transitions
pnml2lts-mc( 2/ 4): ~5000 levels ~20000 states ~494096 transitions
pnml2lts-mc( 2/ 4): ~10000 levels ~40000 states ~954396 transitions
pnml2lts-mc( 2/ 4): ~20000 levels ~80000 states ~1876564 transitions
pnml2lts-mc( 2/ 4): ~40000 levels ~160000 states ~3727260 transitions
ltl formula name BART-PT-020-LTLCardinality-15
ltl formula formula --ltl=/tmp/ltl_15_
pnml2lts-mc( 0/ 4): Loading model from model.pnml
pnml2lts-mc( 0/ 4): Edge label is id
pnml2lts-mc( 0/ 4): Petri net has 2850 places, 4040 transitions and 32400 arcs
pnml2lts-mc( 0/ 4): Petri net BART-PT-020 analyzed
pnml2lts-mc( 0/ 4): There are no safe places
pnml2lts-mc( 0/ 4): Loading Petri net took 2.150 real 1.010 user 3.030 sys
pnml2lts-mc( 0/ 4): LTL layer: formula: /tmp/ltl_15_
pnml2lts-mc( 0/ 4): buchi has 2 states
pnml2lts-mc( 0/ 4): Weak Buchi automaton detected, adding non-accepting as progress label.
pnml2lts-mc( 0/ 4): There are 2852 state labels and 1 edge labels
pnml2lts-mc( 0/ 4): State length is 2851, there are 4042 groups
pnml2lts-mc( 0/ 4): Running ufscc using 4 cores
pnml2lts-mc( 0/ 4): Using a tree table with 2^30 elements
pnml2lts-mc( 0/ 4): Successor permutation: dynamic
pnml2lts-mc( 0/ 4): Global bits: 0, count bits: 0, local bits: 0
pnml2lts-mc( 0/ 4):
pnml2lts-mc( 0/ 4): total scc count: 1
pnml2lts-mc( 0/ 4): unique states count: 1
pnml2lts-mc( 0/ 4): unique transitions count: 0
pnml2lts-mc( 0/ 4): - self-loop count: 0
pnml2lts-mc( 0/ 4): - claim dead count: 0
pnml2lts-mc( 0/ 4): - claim found count: 0
pnml2lts-mc( 0/ 4): - claim success count: 4
pnml2lts-mc( 0/ 4): - cum. max stack depth: 4
pnml2lts-mc( 0/ 4):
pnml2lts-mc( 0/ 4): Explored 4 states 4 transitions, fanout: 1.000
pnml2lts-mc( 0/ 4): Total exploration time 0.020 sec (0.000 sec minimum, 0.010 sec on average)
pnml2lts-mc( 0/ 4): States per second: 200, Transitions per second: 200
pnml2lts-mc( 0/ 4):
pnml2lts-mc( 0/ 4): Queue width: 12B, total height: 0, memory: 0.00MB
pnml2lts-mc( 0/ 4): Tree memory: 0.0MB, 216.0 B/state, compr.: 1.9%
pnml2lts-mc( 0/ 4): Tree fill ratio (roots/leafs): 0.0%/0.0%
pnml2lts-mc( 0/ 4): Stored 4169 string chucks using 0MB
pnml2lts-mc( 0/ 4): Total memory used for chunk indexing: 0MB
pnml2lts-mc( 0/ 4): Est. total memory use: 0.0MB (~8192.0MB paged-in)
Sequence of Actions to be Executed by the VM
This is useful if one wants to reexecute the tool in the VM from the submitted image disk.
set -x
# this is for BenchKit: configuration of major elements for the test
export BK_INPUT="BART-PT-020"
export BK_EXAMINATION="LTLCardinality"
export BK_TOOL="ltsmin"
export BK_RESULT_DIR="/tmp/BK_RESULTS/OUTPUTS"
export BK_TIME_CONFINEMENT="3600"
export BK_MEMORY_CONFINEMENT="16384"
# this is specific to your benchmark or test
export BIN_DIR="$HOME/BenchKit/bin"
# remove the execution directoty if it exists (to avoid increse of .vmdk images)
if [ -d execution ] ; then
rm -rf execution
fi
tar xzf /home/mcc/BenchKit/INPUTS/BART-PT-020.tgz
mv BART-PT-020 execution
cd execution
pwd
ls -lh
# this is for BenchKit: explicit launching of the test
echo "====================================================================="
echo " Generated by BenchKit 2-3637"
echo " Executing tool ltsmin"
echo " Input is BART-PT-020, examination is LTLCardinality"
echo " Time confinement is $BK_TIME_CONFINEMENT seconds"
echo " Memory confinement is 16384 MBytes"
echo " Number of cores is 4"
echo " Run identifier is r221-ebro-152732363300023"
echo "====================================================================="
echo
echo "--------------------"
echo "content from stdout:"
echo
echo "=== Data for post analysis generated by BenchKit (invocation template)"
echo
if [ "LTLCardinality" = "UpperBounds" ] ; then
echo "The expected result is a vector of positive values"
echo NUM_VECTOR
elif [ "LTLCardinality" != "StateSpace" ] ; then
echo "The expected result is a vector of booleans"
echo BOOL_VECTOR
else
echo "no data necessary for post analysis"
fi
echo
if [ -f "LTLCardinality.txt" ] ; then
echo "here is the order used to build the result vector(from text file)"
for x in $(grep Property LTLCardinality.txt | cut -d ' ' -f 2 | sort -u) ; do
echo "FORMULA_NAME $x"
done
elif [ -f "LTLCardinality.xml" ] ; then # for cunf (txt files deleted;-)
echo echo "here is the order used to build the result vector(from xml file)"
for x in $(grep '
echo "FORMULA_NAME $x"
done
fi
echo
echo "=== Now, execution of the tool begins"
echo
echo -n "BK_START "
date -u +%s%3N
echo
timeout -s 9 $BK_TIME_CONFINEMENT bash -c "/home/mcc/BenchKit/BenchKit_head.sh 2> STDERR ; echo ; echo -n \"BK_STOP \" ; date -u +%s%3N"
if [ $? -eq 137 ] ; then
echo
echo "BK_TIME_CONFINEMENT_REACHED"
fi
echo
echo "--------------------"
echo "content from stderr:"
echo
cat STDERR ;