

About the Execution of LTSMin for BART-PT-010
| Execution Summary | |||||
| Max Memory Used (MB) |
Time wait (ms) | CPU Usage (ms) | I/O Wait (ms) | Computed Result | Execution Status |
| 5446.220 | 928816.00 | 1658725.00 | 140.70 | ??????F?FFFTFFFF | normal |
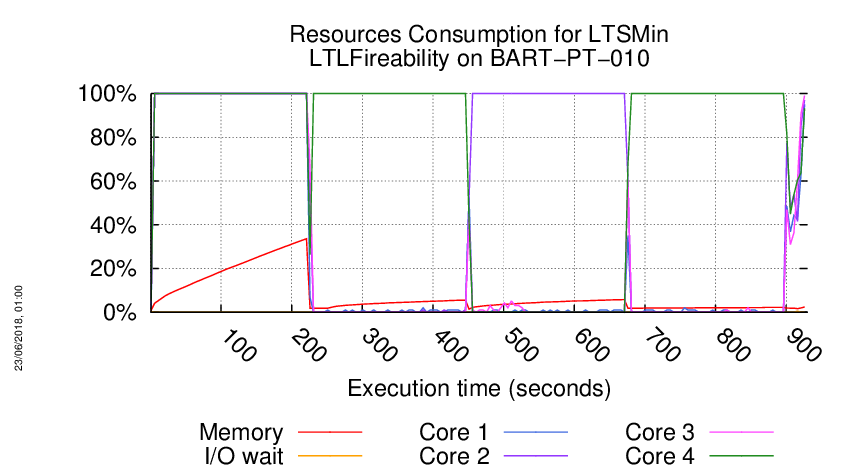
Execution Chart
We display below the execution chart for this examination (boot time has been removed).
Trace from the execution
Waiting for the VM to be ready (probing ssh)
.....................
/home/mcc/execution
total 4.9M
-rw-r--r-- 1 mcc users 106K May 15 18:54 CTLCardinality.txt
-rw-r--r-- 1 mcc users 272K May 15 18:54 CTLCardinality.xml
-rw-r--r-- 1 mcc users 122K May 15 18:54 CTLFireability.txt
-rw-r--r-- 1 mcc users 314K May 15 18:54 CTLFireability.xml
-rw-r--r-- 1 mcc users 4.0K May 15 18:49 GenericPropertiesDefinition.xml
-rw-r--r-- 1 mcc users 6.1K May 15 18:49 GenericPropertiesVerdict.xml
-rw-r--r-- 1 mcc users 121K May 26 09:26 LTLCardinality.txt
-rw-r--r-- 1 mcc users 306K May 26 09:26 LTLCardinality.xml
-rw-r--r-- 1 mcc users 61K May 26 09:26 LTLFireability.txt
-rw-r--r-- 1 mcc users 154K May 26 09:26 LTLFireability.xml
-rw-r--r-- 1 mcc users 129K May 15 18:54 ReachabilityCardinality.txt
-rw-r--r-- 1 mcc users 322K May 15 18:54 ReachabilityCardinality.xml
-rw-r--r-- 1 mcc users 102 May 15 18:54 ReachabilityDeadlock.txt
-rw-r--r-- 1 mcc users 340 May 15 18:54 ReachabilityDeadlock.xml
-rw-r--r-- 1 mcc users 135K May 15 18:54 ReachabilityFireability.txt
-rw-r--r-- 1 mcc users 358K May 15 18:54 ReachabilityFireability.xml
-rw-r--r-- 1 mcc users 31K May 15 18:54 UpperBounds.txt
-rw-r--r-- 1 mcc users 60K May 15 18:54 UpperBounds.xml
-rw-r--r-- 1 mcc users 5 May 15 18:49 equiv_col
-rw-r--r-- 1 mcc users 4 May 15 18:49 instance
-rw-r--r-- 1 mcc users 6 May 15 18:49 iscolored
-rw-r--r-- 1 mcc users 2.4M May 15 18:49 model.pnml
=====================================================================
Generated by BenchKit 2-3637
Executing tool ltsmin
Input is BART-PT-010, examination is LTLFireability
Time confinement is 3600 seconds
Memory confinement is 16384 MBytes
Number of cores is 4
Run identifier is r221-ebro-152732363300022
=====================================================================
--------------------
content from stdout:
=== Data for post analysis generated by BenchKit (invocation template)
The expected result is a vector of booleans
BOOL_VECTOR
here is the order used to build the result vector(from text file)
FORMULA_NAME BART-PT-010-LTLFireability-00
FORMULA_NAME BART-PT-010-LTLFireability-01
FORMULA_NAME BART-PT-010-LTLFireability-02
FORMULA_NAME BART-PT-010-LTLFireability-03
FORMULA_NAME BART-PT-010-LTLFireability-04
FORMULA_NAME BART-PT-010-LTLFireability-05
FORMULA_NAME BART-PT-010-LTLFireability-06
FORMULA_NAME BART-PT-010-LTLFireability-07
FORMULA_NAME BART-PT-010-LTLFireability-08
FORMULA_NAME BART-PT-010-LTLFireability-09
FORMULA_NAME BART-PT-010-LTLFireability-10
FORMULA_NAME BART-PT-010-LTLFireability-11
FORMULA_NAME BART-PT-010-LTLFireability-12
FORMULA_NAME BART-PT-010-LTLFireability-13
FORMULA_NAME BART-PT-010-LTLFireability-14
FORMULA_NAME BART-PT-010-LTLFireability-15
=== Now, execution of the tool begins
BK_START 1527484393338
FORMULA BART-PT-010-LTLFireability-00 CANNOT_COMPUTE
FORMULA BART-PT-010-LTLFireability-01 CANNOT_COMPUTE
FORMULA BART-PT-010-LTLFireability-02 CANNOT_COMPUTE
FORMULA BART-PT-010-LTLFireability-03 CANNOT_COMPUTE
FORMULA BART-PT-010-LTLFireability-04 CANNOT_COMPUTE
FORMULA BART-PT-010-LTLFireability-05 CANNOT_COMPUTE
FORMULA BART-PT-010-LTLFireability-06 FALSE TECHNIQUES EXPLICIT PARALLEL_PROCESSING USE_NUPN
FORMULA BART-PT-010-LTLFireability-07 CANNOT_COMPUTE
FORMULA BART-PT-010-LTLFireability-08 FALSE TECHNIQUES EXPLICIT PARALLEL_PROCESSING USE_NUPN
FORMULA BART-PT-010-LTLFireability-09 FALSE TECHNIQUES EXPLICIT PARALLEL_PROCESSING USE_NUPN
FORMULA BART-PT-010-LTLFireability-10 FALSE TECHNIQUES EXPLICIT PARALLEL_PROCESSING USE_NUPN
FORMULA BART-PT-010-LTLFireability-11 TRUE TECHNIQUES EXPLICIT PARALLEL_PROCESSING USE_NUPN
FORMULA BART-PT-010-LTLFireability-12 FALSE TECHNIQUES EXPLICIT PARALLEL_PROCESSING USE_NUPN
FORMULA BART-PT-010-LTLFireability-13 FALSE TECHNIQUES EXPLICIT PARALLEL_PROCESSING USE_NUPN
FORMULA BART-PT-010-LTLFireability-14 FALSE TECHNIQUES EXPLICIT PARALLEL_PROCESSING USE_NUPN
FORMULA BART-PT-010-LTLFireability-15 FALSE TECHNIQUES EXPLICIT PARALLEL_PROCESSING USE_NUPN
BK_STOP 1527485322154
--------------------
content from stderr:
mcc2018
ltl formula name BART-PT-010-LTLFireability-00
ltl formula formula --ltl=/tmp/ltl_0_
pnml2lts-mc( 0/ 4): Loading model from model.pnml
pnml2lts-mc( 0/ 4): Edge label is id
pnml2lts-mc( 0/ 4): Petri net has 1530 places, 2020 transitions and 16200 arcs
pnml2lts-mc( 0/ 4): Petri net BART-PT-010 analyzed
pnml2lts-mc( 0/ 4): There are no safe places
pnml2lts-mc( 2/ 4): LTL layer: formula: /tmp/ltl_0_
pnml2lts-mc( 0/ 4): Loading Petri net took 0.960 real 0.540 user 0.800 sys
pnml2lts-mc( 0/ 4): Weak Buchi automaton detected, adding non-accepting as progress label.
pnml2lts-mc( 0/ 4): There are 1532 state labels and 1 edge labels
pnml2lts-mc( 0/ 4): State length is 1531, there are 2023 groups
pnml2lts-mc( 0/ 4): Running ufscc using 4 cores
pnml2lts-mc( 0/ 4): Using a tree table with 2^30 elements
pnml2lts-mc( 0/ 4): Successor permutation: dynamic
pnml2lts-mc( 0/ 4): Global bits: 0, count bits: 0, local bits: 0
pnml2lts-mc( 1/ 4): ~86 levels ~10000 states ~35840 transitions
pnml2lts-mc( 0/ 4): ~117 levels ~20000 states ~48520 transitions
pnml2lts-mc( 0/ 4): ~117 levels ~40000 states ~77680 transitions
pnml2lts-mc( 0/ 4): ~117 levels ~80000 states ~135640 transitions
pnml2lts-mc( 0/ 4): ~117 levels ~160000 states ~251488 transitions
pnml2lts-mc( 0/ 4): ~120 levels ~320000 states ~484132 transitions
ltl formula name BART-PT-010-LTLFireability-01
ltl formula formula --ltl=/tmp/ltl_1_
pnml2lts-mc( 0/ 4): Loading model from model.pnml
pnml2lts-mc( 0/ 4): Edge label is id
pnml2lts-mc( 0/ 4): Petri net has 1530 places, 2020 transitions and 16200 arcs
pnml2lts-mc( 0/ 4): Petri net BART-PT-010 analyzed
pnml2lts-mc( 0/ 4): There are no safe places
pnml2lts-mc( 0/ 4): Loading Petri net took 0.900 real 0.580 user 0.700 sys
pnml2lts-mc( 3/ 4): LTL layer: formula: /tmp/ltl_1_
ltl formula name BART-PT-010-LTLFireability-02
ltl formula formula --ltl=/tmp/ltl_2_
pnml2lts-mc( 0/ 4): Loading model from model.pnml
pnml2lts-mc( 0/ 4): Edge label is id
pnml2lts-mc( 0/ 4): Petri net has 1530 places, 2020 transitions and 16200 arcs
pnml2lts-mc( 0/ 4): Petri net BART-PT-010 analyzed
pnml2lts-mc( 2/ 4): LTL layer: formula: /tmp/ltl_2_
pnml2lts-mc( 0/ 4): There are no safe places
pnml2lts-mc( 2/ 4), ** error **: syntax error near pos 7
ltl formula name BART-PT-010-LTLFireability-03
ltl formula formula --ltl=/tmp/ltl_3_
pnml2lts-mc( 0/ 4): Loading model from model.pnml
pnml2lts-mc( 0/ 4): Edge label is id
pnml2lts-mc( 0/ 4): Petri net has 1530 places, 2020 transitions and 16200 arcs
pnml2lts-mc( 0/ 4): Petri net BART-PT-010 analyzed
pnml2lts-mc( 0/ 4): There are no safe places
pnml2lts-mc( 2/ 4): LTL layer: formula: /tmp/ltl_3_
pnml2lts-mc( 0/ 4): Loading Petri net took 0.770 real 0.650 user 1.010 sys
ltl formula name BART-PT-010-LTLFireability-04
ltl formula formula --ltl=/tmp/ltl_4_
pnml2lts-mc( 0/ 4): Loading model from model.pnml
pnml2lts-mc( 0/ 4): Edge label is id
pnml2lts-mc( 0/ 4): Petri net has 1530 places, 2020 transitions and 16200 arcs
pnml2lts-mc( 0/ 4): Petri net BART-PT-010 analyzed
pnml2lts-mc( 0/ 4): There are no safe places
pnml2lts-mc( 3/ 4): LTL layer: formula: /tmp/ltl_4_
pnml2lts-mc( 0/ 4): Loading Petri net took 1.310 real 0.340 user 1.930 sys
ltl formula name BART-PT-010-LTLFireability-05
ltl formula formula --ltl=/tmp/ltl_5_
pnml2lts-mc( 0/ 4): Loading model from model.pnml
pnml2lts-mc( 0/ 4): Edge label is id
pnml2lts-mc( 0/ 4): Petri net has 1530 places, 2020 transitions and 16200 arcs
pnml2lts-mc( 0/ 4): Petri net BART-PT-010 analyzed
pnml2lts-mc( 3/ 4): LTL layer: formula: /tmp/ltl_5_
pnml2lts-mc( 3/ 4), ** error **: syntax error near pos 9
ltl formula name BART-PT-010-LTLFireability-06
ltl formula formula --ltl=/tmp/ltl_6_
pnml2lts-mc( 0/ 4): Loading model from model.pnml
pnml2lts-mc( 0/ 4): Edge label is id
pnml2lts-mc( 0/ 4): Petri net has 1530 places, 2020 transitions and 16200 arcs
pnml2lts-mc( 0/ 4): Petri net BART-PT-010 analyzed
pnml2lts-mc( 0/ 4): There are no safe places
pnml2lts-mc( 3/ 4): LTL layer: formula: /tmp/ltl_6_
pnml2lts-mc( 0/ 4): Loading Petri net took 1.240 real 0.690 user 1.530 sys
pnml2lts-mc( 0/ 4): Weak Buchi automaton detected, adding non-accepting as progress label.
pnml2lts-mc( 0/ 4): There are 1532 state labels and 1 edge labels
pnml2lts-mc( 0/ 4): State length is 1531, there are 2033 groups
pnml2lts-mc( 0/ 4): Running ufscc using 4 cores
pnml2lts-mc( 0/ 4): Using a tree table with 2^30 elements
pnml2lts-mc( 0/ 4): Successor permutation: dynamic
pnml2lts-mc( 0/ 4): Global bits: 0, count bits: 0, local bits: 0
pnml2lts-mc( 0/ 4):
pnml2lts-mc( 0/ 4): Accepting cycle FOUND at depth ~62!
pnml2lts-mc( 0/ 4):
pnml2lts-mc( 0/ 4):
pnml2lts-mc( 0/ 4): total scc count: 0
pnml2lts-mc( 0/ 4): unique states count: 143
pnml2lts-mc( 0/ 4): unique transitions count: 8559
pnml2lts-mc( 0/ 4): - self-loop count: 0
pnml2lts-mc( 0/ 4): - claim dead count: 0
pnml2lts-mc( 0/ 4): - claim found count: 1
pnml2lts-mc( 0/ 4): - claim success count: 146
pnml2lts-mc( 0/ 4): - cum. max stack depth: 146
pnml2lts-mc( 0/ 4):
pnml2lts-mc( 0/ 4): Explored 146 states 9643 transitions, fanout: 66.048
pnml2lts-mc( 0/ 4): Total exploration time 1.760 sec (1.690 sec minimum, 1.728 sec on average)
pnml2lts-mc( 0/ 4): States per second: 83, Transitions per second: 5479
pnml2lts-mc( 0/ 4):
pnml2lts-mc( 0/ 4): Queue width: 12B, total height: 0, memory: 0.00MB
pnml2lts-mc( 0/ 4): Tree memory: 0.2MB, 21.4 B/state, compr.: 0.3%
pnml2lts-mc( 0/ 4): Tree fill ratio (roots/leafs): 0.0%/0.0%
pnml2lts-mc( 0/ 4): Stored 2077 string chucks using 0MB
pnml2lts-mc( 0/ 4): Total memory used for chunk indexing: 0MB
pnml2lts-mc( 0/ 4): Est. total memory use: 0.2MB (~8192.0MB paged-in)
ltl formula name BART-PT-010-LTLFireability-07
ltl formula formula --ltl=/tmp/ltl_7_
pnml2lts-mc( 0/ 4): Loading model from model.pnml
pnml2lts-mc( 0/ 4): Edge label is id
pnml2lts-mc( 0/ 4): Petri net has 1530 places, 2020 transitions and 16200 arcs
pnml2lts-mc( 0/ 4): Petri net BART-PT-010 analyzed
pnml2lts-mc( 0/ 4): There are no safe places
pnml2lts-mc( 0/ 4): Loading Petri net took 0.350 real 0.530 user 0.340 sys
pnml2lts-mc( 2/ 4): LTL layer: formula: /tmp/ltl_7_
pnml2lts-mc( 2/ 4), ** error **: syntax error near pos 13
ltl formula name BART-PT-010-LTLFireability-08
ltl formula formula --ltl=/tmp/ltl_8_
pnml2lts-mc( 0/ 4): Loading model from model.pnml
pnml2lts-mc( 0/ 4): Edge label is id
pnml2lts-mc( 0/ 4): Petri net has 1530 places, 2020 transitions and 16200 arcs
pnml2lts-mc( 0/ 4): Petri net BART-PT-010 analyzed
pnml2lts-mc( 0/ 4): There are no safe places
pnml2lts-mc( 0/ 4): Loading Petri net took 0.350 real 0.520 user 0.310 sys
pnml2lts-mc( 2/ 4): LTL layer: formula: /tmp/ltl_8_
pnml2lts-mc( 0/ 4): Weak Buchi automaton detected, adding non-accepting as progress label.
pnml2lts-mc( 0/ 4): There are 1532 state labels and 1 edge labels
pnml2lts-mc( 0/ 4): State length is 1531, there are 2021 groups
pnml2lts-mc( 0/ 4): Running ufscc using 4 cores
pnml2lts-mc( 0/ 4): Using a tree table with 2^30 elements
pnml2lts-mc( 0/ 4): Successor permutation: dynamic
pnml2lts-mc( 0/ 4): Global bits: 0, count bits: 0, local bits: 0
pnml2lts-mc( 0/ 4):
pnml2lts-mc( 0/ 4): Accepting cycle FOUND at depth ~46!
pnml2lts-mc( 0/ 4):
pnml2lts-mc( 0/ 4):
pnml2lts-mc( 0/ 4): total scc count: 0
pnml2lts-mc( 0/ 4): unique states count: 202
pnml2lts-mc( 0/ 4): unique transitions count: 10045
pnml2lts-mc( 0/ 4): - self-loop count: 0
pnml2lts-mc( 0/ 4): - claim dead count: 0
pnml2lts-mc( 0/ 4): - claim found count: 1
pnml2lts-mc( 0/ 4): - claim success count: 205
pnml2lts-mc( 0/ 4): - cum. max stack depth: 205
pnml2lts-mc( 0/ 4):
pnml2lts-mc( 0/ 4): Explored 205 states 11129 transitions, fanout: 54.288
pnml2lts-mc( 0/ 4): Total exploration time 0.310 sec (0.310 sec minimum, 0.310 sec on average)
pnml2lts-mc( 0/ 4): States per second: 661, Transitions per second: 35900
pnml2lts-mc( 0/ 4):
pnml2lts-mc( 0/ 4): Queue width: 12B, total height: 0, memory: 0.00MB
pnml2lts-mc( 0/ 4): Tree memory: 0.2MB, 22.1 B/state, compr.: 0.4%
pnml2lts-mc( 0/ 4): Tree fill ratio (roots/leafs): 0.0%/0.0%
pnml2lts-mc( 0/ 4): Stored 2077 string chucks using 0MB
pnml2lts-mc( 0/ 4): Total memory used for chunk indexing: 0MB
pnml2lts-mc( 0/ 4): Est. total memory use: 0.2MB (~8192.0MB paged-in)
ltl formula name BART-PT-010-LTLFireability-09
ltl formula formula --ltl=/tmp/ltl_9_
pnml2lts-mc( 0/ 4): Loading model from model.pnml
pnml2lts-mc( 0/ 4): Edge label is id
pnml2lts-mc( 0/ 4): Petri net has 1530 places, 2020 transitions and 16200 arcs
pnml2lts-mc( 0/ 4): Petri net BART-PT-010 analyzed
pnml2lts-mc( 3/ 4): LTL layer: formula: /tmp/ltl_9_
pnml2lts-mc( 0/ 4): There are no safe places
pnml2lts-mc( 0/ 4): Loading Petri net took 1.580 real 0.610 user 2.090 sys
pnml2lts-mc( 0/ 4): Weak Buchi automaton detected, adding non-accepting as progress label.
pnml2lts-mc( 0/ 4): There are 1532 state labels and 1 edge labels
pnml2lts-mc( 0/ 4): State length is 1531, there are 2022 groups
pnml2lts-mc( 0/ 4): Running ufscc using 4 cores
pnml2lts-mc( 0/ 4): Using a tree table with 2^30 elements
pnml2lts-mc( 0/ 4): Successor permutation: dynamic
pnml2lts-mc( 0/ 4): Global bits: 0, count bits: 0, local bits: 0
pnml2lts-mc( 1/ 4):
pnml2lts-mc( 1/ 4): Accepting cycle FOUND at depth ~80!
pnml2lts-mc( 1/ 4):
pnml2lts-mc( 0/ 4):
pnml2lts-mc( 0/ 4): total scc count: 0
pnml2lts-mc( 0/ 4): unique states count: 164
pnml2lts-mc( 0/ 4): unique transitions count: 10057
pnml2lts-mc( 0/ 4): - self-loop count: 0
pnml2lts-mc( 0/ 4): - claim dead count: 0
pnml2lts-mc( 0/ 4): - claim found count: 1
pnml2lts-mc( 0/ 4): - claim success count: 167
pnml2lts-mc( 0/ 4): - cum. max stack depth: 167
pnml2lts-mc( 0/ 4):
pnml2lts-mc( 0/ 4): Explored 167 states 11141 transitions, fanout: 66.713
pnml2lts-mc( 0/ 4): Total exploration time 1.910 sec (1.880 sec minimum, 1.895 sec on average)
pnml2lts-mc( 0/ 4): States per second: 87, Transitions per second: 5833
pnml2lts-mc( 0/ 4):
pnml2lts-mc( 0/ 4): Queue width: 12B, total height: 0, memory: 0.00MB
pnml2lts-mc( 0/ 4): Tree memory: 0.2MB, 20.9 B/state, compr.: 0.3%
pnml2lts-mc( 0/ 4): Tree fill ratio (roots/leafs): 0.0%/0.0%
pnml2lts-mc( 0/ 4): Stored 2077 string chucks using 0MB
pnml2lts-mc( 0/ 4): Total memory used for chunk indexing: 0MB
pnml2lts-mc( 0/ 4): Est. total memory use: 0.2MB (~8192.0MB paged-in)
ltl formula name BART-PT-010-LTLFireability-10
ltl formula formula --ltl=/tmp/ltl_10_
pnml2lts-mc( 0/ 4): Loading model from model.pnml
pnml2lts-mc( 0/ 4): Edge label is id
pnml2lts-mc( 0/ 4): Petri net has 1530 places, 2020 transitions and 16200 arcs
pnml2lts-mc( 0/ 4): Petri net BART-PT-010 analyzed
pnml2lts-mc( 2/ 4): LTL layer: formula: /tmp/ltl_10_
pnml2lts-mc( 0/ 4): There are no safe places
pnml2lts-mc( 0/ 4): Loading Petri net took 1.410 real 0.550 user 1.970 sys
pnml2lts-mc( 0/ 4): Weak Buchi automaton detected, adding non-accepting as progress label.
pnml2lts-mc( 0/ 4): There are 1532 state labels and 1 edge labels
pnml2lts-mc( 0/ 4): State length is 1531, there are 2021 groups
pnml2lts-mc( 0/ 4): Running ufscc using 4 cores
pnml2lts-mc( 0/ 4): Using a tree table with 2^30 elements
pnml2lts-mc( 0/ 4): Successor permutation: dynamic
pnml2lts-mc( 0/ 4): Global bits: 0, count bits: 0, local bits: 0
pnml2lts-mc( 0/ 4):
pnml2lts-mc( 0/ 4): Accepting cycle FOUND at depth ~46!
pnml2lts-mc( 0/ 4):
pnml2lts-mc( 0/ 4):
pnml2lts-mc( 0/ 4): total scc count: 0
pnml2lts-mc( 0/ 4): unique states count: 113
pnml2lts-mc( 0/ 4): unique transitions count: 8640
pnml2lts-mc( 0/ 4): - self-loop count: 0
pnml2lts-mc( 0/ 4): - claim dead count: 0
pnml2lts-mc( 0/ 4): - claim found count: 1
pnml2lts-mc( 0/ 4): - claim success count: 116
pnml2lts-mc( 0/ 4): - cum. max stack depth: 116
pnml2lts-mc( 0/ 4):
pnml2lts-mc( 0/ 4): Explored 116 states 9724 transitions, fanout: 83.828
pnml2lts-mc( 0/ 4): Total exploration time 1.390 sec (1.380 sec minimum, 1.387 sec on average)
pnml2lts-mc( 0/ 4): States per second: 83, Transitions per second: 6996
pnml2lts-mc( 0/ 4):
pnml2lts-mc( 0/ 4): Queue width: 12B, total height: 0, memory: 0.00MB
pnml2lts-mc( 0/ 4): Tree memory: 0.2MB, 20.1 B/state, compr.: 0.3%
pnml2lts-mc( 0/ 4): Tree fill ratio (roots/leafs): 0.0%/0.0%
pnml2lts-mc( 0/ 4): Stored 2077 string chucks using 0MB
pnml2lts-mc( 0/ 4): Total memory used for chunk indexing: 0MB
pnml2lts-mc( 0/ 4): Est. total memory use: 0.2MB (~8192.0MB paged-in)
ltl formula name BART-PT-010-LTLFireability-11
ltl formula formula --ltl=/tmp/ltl_11_
pnml2lts-mc( 0/ 4): Loading model from model.pnml
pnml2lts-mc( 0/ 4): Edge label is id
pnml2lts-mc( 0/ 4): Petri net has 1530 places, 2020 transitions and 16200 arcs
pnml2lts-mc( 0/ 4): Petri net BART-PT-010 analyzed
pnml2lts-mc( 0/ 4): There are no safe places
pnml2lts-mc( 0/ 4): Loading Petri net took 0.960 real 0.550 user 0.810 sys
pnml2lts-mc( 1/ 4): LTL layer: formula: /tmp/ltl_11_
pnml2lts-mc( 0/ 4): Weak Buchi automaton detected, adding non-accepting as progress label.
pnml2lts-mc( 0/ 4): There are 1532 state labels and 1 edge labels
pnml2lts-mc( 0/ 4): State length is 1531, there are 2026 groups
pnml2lts-mc( 0/ 4): Running ufscc using 4 cores
pnml2lts-mc( 0/ 4): Using a tree table with 2^30 elements
pnml2lts-mc( 0/ 4): Successor permutation: dynamic
pnml2lts-mc( 0/ 4): Global bits: 0, count bits: 0, local bits: 0
pnml2lts-mc( 0/ 4):
pnml2lts-mc( 0/ 4): total scc count: 1
pnml2lts-mc( 0/ 4): unique states count: 1
pnml2lts-mc( 0/ 4): unique transitions count: 0
pnml2lts-mc( 0/ 4): - self-loop count: 0
pnml2lts-mc( 0/ 4): - claim dead count: 0
pnml2lts-mc( 0/ 4): - claim found count: 0
pnml2lts-mc( 0/ 4): - claim success count: 4
pnml2lts-mc( 0/ 4): - cum. max stack depth: 4
pnml2lts-mc( 0/ 4):
pnml2lts-mc( 0/ 4): Explored 4 states 4 transitions, fanout: 1.000
pnml2lts-mc( 0/ 4): Total exploration time 0.010 sec (0.000 sec minimum, 0.007 sec on average)
pnml2lts-mc( 0/ 4): States per second: 400, Transitions per second: 400
pnml2lts-mc( 0/ 4):
pnml2lts-mc( 0/ 4): Queue width: 12B, total height: 0, memory: 0.00MB
pnml2lts-mc( 0/ 4): Tree memory: 0.0MB, 224.0 B/state, compr.: 3.7%
pnml2lts-mc( 0/ 4): Tree fill ratio (roots/leafs): 0.0%/0.0%
pnml2lts-mc( 0/ 4): Stored 2077 string chucks using 0MB
pnml2lts-mc( 0/ 4): Total memory used for chunk indexing: 0MB
pnml2lts-mc( 0/ 4): Est. total memory use: 0.0MB (~8192.0MB paged-in)
ltl formula name BART-PT-010-LTLFireability-12
ltl formula formula --ltl=/tmp/ltl_12_
pnml2lts-mc( 0/ 4): Loading model from model.pnml
pnml2lts-mc( 0/ 4): Edge label is id
pnml2lts-mc( 0/ 4): Petri net has 1530 places, 2020 transitions and 16200 arcs
pnml2lts-mc( 0/ 4): Petri net BART-PT-010 analyzed
pnml2lts-mc( 3/ 4): LTL layer: formula: /tmp/ltl_12_
pnml2lts-mc( 0/ 4): There are no safe places
pnml2lts-mc( 0/ 4): Loading Petri net took 1.200 real 0.530 user 1.600 sys
pnml2lts-mc( 0/ 4): Weak Buchi automaton detected, adding non-accepting as progress label.
pnml2lts-mc( 0/ 4): There are 1532 state labels and 1 edge labels
pnml2lts-mc( 0/ 4): State length is 1531, there are 2021 groups
pnml2lts-mc( 0/ 4): Running ufscc using 4 cores
pnml2lts-mc( 0/ 4): Using a tree table with 2^30 elements
pnml2lts-mc( 0/ 4): Successor permutation: dynamic
pnml2lts-mc( 0/ 4): Global bits: 0, count bits: 0, local bits: 0
pnml2lts-mc( 3/ 4):
pnml2lts-mc( 3/ 4): Accepting cycle FOUND at depth ~39!
pnml2lts-mc( 3/ 4):
pnml2lts-mc( 0/ 4):
pnml2lts-mc( 0/ 4): total scc count: 0
pnml2lts-mc( 0/ 4): unique states count: 71
pnml2lts-mc( 0/ 4): unique transitions count: 7538
pnml2lts-mc( 0/ 4): - self-loop count: 0
pnml2lts-mc( 0/ 4): - claim dead count: 0
pnml2lts-mc( 0/ 4): - claim found count: 1
pnml2lts-mc( 0/ 4): - claim success count: 74
pnml2lts-mc( 0/ 4): - cum. max stack depth: 74
pnml2lts-mc( 0/ 4):
pnml2lts-mc( 0/ 4): Explored 74 states 8622 transitions, fanout: 116.514
pnml2lts-mc( 0/ 4): Total exploration time 1.310 sec (1.270 sec minimum, 1.285 sec on average)
pnml2lts-mc( 0/ 4): States per second: 56, Transitions per second: 6582
pnml2lts-mc( 0/ 4):
pnml2lts-mc( 0/ 4): Queue width: 12B, total height: 0, memory: 0.00MB
pnml2lts-mc( 0/ 4): Tree memory: 0.1MB, 20.0 B/state, compr.: 0.3%
pnml2lts-mc( 0/ 4): Tree fill ratio (roots/leafs): 0.0%/0.0%
pnml2lts-mc( 0/ 4): Stored 2077 string chucks using 0MB
pnml2lts-mc( 0/ 4): Total memory used for chunk indexing: 0MB
pnml2lts-mc( 0/ 4): Est. total memory use: 0.1MB (~8192.0MB paged-in)
ltl formula name BART-PT-010-LTLFireability-13
ltl formula formula --ltl=/tmp/ltl_13_
pnml2lts-mc( 0/ 4): Loading model from model.pnml
pnml2lts-mc( 0/ 4): Edge label is id
pnml2lts-mc( 0/ 4): Petri net has 1530 places, 2020 transitions and 16200 arcs
pnml2lts-mc( 0/ 4): Petri net BART-PT-010 analyzed
pnml2lts-mc( 3/ 4): LTL layer: formula: /tmp/ltl_13_
pnml2lts-mc( 0/ 4): There are no safe places
pnml2lts-mc( 0/ 4): Loading Petri net took 1.080 real 0.620 user 1.390 sys
pnml2lts-mc( 0/ 4): Weak Buchi automaton detected, adding non-accepting as progress label.
pnml2lts-mc( 0/ 4): There are 1532 state labels and 1 edge labels
pnml2lts-mc( 0/ 4): State length is 1531, there are 2027 groups
pnml2lts-mc( 0/ 4): Running ufscc using 4 cores
pnml2lts-mc( 0/ 4): Using a tree table with 2^30 elements
pnml2lts-mc( 0/ 4): Successor permutation: dynamic
pnml2lts-mc( 0/ 4): Global bits: 0, count bits: 0, local bits: 0
pnml2lts-mc( 1/ 4):
pnml2lts-mc( 1/ 4): Accepting cycle FOUND at depth ~53!
pnml2lts-mc( 1/ 4):
pnml2lts-mc( 0/ 4):
pnml2lts-mc( 0/ 4): total scc count: 0
pnml2lts-mc( 0/ 4): unique states count: 74
pnml2lts-mc( 0/ 4): unique transitions count: 21982
pnml2lts-mc( 0/ 4): - self-loop count: 0
pnml2lts-mc( 0/ 4): - claim dead count: 0
pnml2lts-mc( 0/ 4): - claim found count: 2
pnml2lts-mc( 0/ 4): - claim success count: 77
pnml2lts-mc( 0/ 4): - cum. max stack depth: 77
pnml2lts-mc( 0/ 4):
pnml2lts-mc( 0/ 4): Explored 77 states 23066 transitions, fanout: 299.558
pnml2lts-mc( 0/ 4): Total exploration time 2.630 sec (2.570 sec minimum, 2.608 sec on average)
pnml2lts-mc( 0/ 4): States per second: 29, Transitions per second: 8770
pnml2lts-mc( 0/ 4):
pnml2lts-mc( 0/ 4): Queue width: 12B, total height: 0, memory: 0.00MB
pnml2lts-mc( 0/ 4): Tree memory: 0.3MB, 16.2 B/state, compr.: 0.3%
pnml2lts-mc( 0/ 4): Tree fill ratio (roots/leafs): 0.0%/0.0%
pnml2lts-mc( 0/ 4): Stored 2077 string chucks using 0MB
pnml2lts-mc( 0/ 4): Total memory used for chunk indexing: 0MB
pnml2lts-mc( 0/ 4): Est. total memory use: 0.3MB (~8192.0MB paged-in)
ltl formula name BART-PT-010-LTLFireability-14
ltl formula formula --ltl=/tmp/ltl_14_
pnml2lts-mc( 0/ 4): Loading model from model.pnml
pnml2lts-mc( 0/ 4): Edge label is id
pnml2lts-mc( 0/ 4): Petri net has 1530 places, 2020 transitions and 16200 arcs
pnml2lts-mc( 0/ 4): Petri net BART-PT-010 analyzed
pnml2lts-mc( 0/ 4): There are no safe places
pnml2lts-mc( 3/ 4): LTL layer: formula: /tmp/ltl_14_
pnml2lts-mc( 0/ 4): Loading Petri net took 0.990 real 0.480 user 1.320 sys
pnml2lts-mc( 0/ 4): Weak Buchi automaton detected, adding non-accepting as progress label.
pnml2lts-mc( 0/ 4): There are 1532 state labels and 1 edge labels
pnml2lts-mc( 0/ 4): State length is 1531, there are 2022 groups
pnml2lts-mc( 0/ 4): Running ufscc using 4 cores
pnml2lts-mc( 0/ 4): Using a tree table with 2^30 elements
pnml2lts-mc( 0/ 4): Successor permutation: dynamic
pnml2lts-mc( 0/ 4): Global bits: 0, count bits: 0, local bits: 0
pnml2lts-mc( 2/ 4):
pnml2lts-mc( 2/ 4): Accepting cycle FOUND at depth ~29!
pnml2lts-mc( 2/ 4):
pnml2lts-mc( 0/ 4):
pnml2lts-mc( 0/ 4): total scc count: 0
pnml2lts-mc( 0/ 4): unique states count: 61
pnml2lts-mc( 0/ 4): unique transitions count: 7333
pnml2lts-mc( 0/ 4): - self-loop count: 0
pnml2lts-mc( 0/ 4): - claim dead count: 0
pnml2lts-mc( 0/ 4): - claim found count: 1
pnml2lts-mc( 0/ 4): - claim success count: 64
pnml2lts-mc( 0/ 4): - cum. max stack depth: 64
pnml2lts-mc( 0/ 4):
pnml2lts-mc( 0/ 4): Explored 64 states 8417 transitions, fanout: 131.516
pnml2lts-mc( 0/ 4): Total exploration time 1.150 sec (1.130 sec minimum, 1.140 sec on average)
pnml2lts-mc( 0/ 4): States per second: 56, Transitions per second: 7319
pnml2lts-mc( 0/ 4):
pnml2lts-mc( 0/ 4): Queue width: 12B, total height: 0, memory: 0.00MB
pnml2lts-mc( 0/ 4): Tree memory: 0.1MB, 21.3 B/state, compr.: 0.3%
pnml2lts-mc( 0/ 4): Tree fill ratio (roots/leafs): 0.0%/0.0%
pnml2lts-mc( 0/ 4): Stored 2077 string chucks using 0MB
pnml2lts-mc( 0/ 4): Total memory used for chunk indexing: 0MB
pnml2lts-mc( 0/ 4): Est. total memory use: 0.1MB (~8192.0MB paged-in)
ltl formula name BART-PT-010-LTLFireability-15
ltl formula formula --ltl=/tmp/ltl_15_
pnml2lts-mc( 0/ 4): Loading model from model.pnml
pnml2lts-mc( 0/ 4): Edge label is id
pnml2lts-mc( 0/ 4): Petri net has 1530 places, 2020 transitions and 16200 arcs
pnml2lts-mc( 0/ 4): Petri net BART-PT-010 analyzed
pnml2lts-mc( 3/ 4): LTL layer: formula: /tmp/ltl_15_
pnml2lts-mc( 0/ 4): There are no safe places
pnml2lts-mc( 0/ 4): Loading Petri net took 0.940 real 0.650 user 1.150 sys
pnml2lts-mc( 0/ 4): Weak Buchi automaton detected, adding non-accepting as progress label.
pnml2lts-mc( 0/ 4): There are 1532 state labels and 1 edge labels
pnml2lts-mc( 0/ 4): State length is 1531, there are 2021 groups
pnml2lts-mc( 0/ 4): Running ufscc using 4 cores
pnml2lts-mc( 0/ 4): Using a tree table with 2^30 elements
pnml2lts-mc( 0/ 4): Successor permutation: dynamic
pnml2lts-mc( 0/ 4): Global bits: 0, count bits: 0, local bits: 0
pnml2lts-mc( 3/ 4):
pnml2lts-mc( 3/ 4): Accepting cycle FOUND at depth ~37!
pnml2lts-mc( 3/ 4):
pnml2lts-mc( 0/ 4):
pnml2lts-mc( 0/ 4): total scc count: 0
pnml2lts-mc( 0/ 4): unique states count: 82
pnml2lts-mc( 0/ 4): unique transitions count: 7502
pnml2lts-mc( 0/ 4): - self-loop count: 0
pnml2lts-mc( 0/ 4): - claim dead count: 0
pnml2lts-mc( 0/ 4): - claim found count: 1
pnml2lts-mc( 0/ 4): - claim success count: 85
pnml2lts-mc( 0/ 4): - cum. max stack depth: 85
pnml2lts-mc( 0/ 4):
pnml2lts-mc( 0/ 4): Explored 85 states 8586 transitions, fanout: 101.012
pnml2lts-mc( 0/ 4): Total exploration time 1.130 sec (1.030 sec minimum, 1.072 sec on average)
pnml2lts-mc( 0/ 4): States per second: 75, Transitions per second: 7598
pnml2lts-mc( 0/ 4):
pnml2lts-mc( 0/ 4): Queue width: 12B, total height: 0, memory: 0.00MB
pnml2lts-mc( 0/ 4): Tree memory: 0.1MB, 20.7 B/state, compr.: 0.3%
pnml2lts-mc( 0/ 4): Tree fill ratio (roots/leafs): 0.0%/0.0%
pnml2lts-mc( 0/ 4): Stored 2077 string chucks using 0MB
pnml2lts-mc( 0/ 4): Total memory used for chunk indexing: 0MB
pnml2lts-mc( 0/ 4): Est. total memory use: 0.1MB (~8192.0MB paged-in)
Sequence of Actions to be Executed by the VM
This is useful if one wants to reexecute the tool in the VM from the submitted image disk.
set -x
# this is for BenchKit: configuration of major elements for the test
export BK_INPUT="BART-PT-010"
export BK_EXAMINATION="LTLFireability"
export BK_TOOL="ltsmin"
export BK_RESULT_DIR="/tmp/BK_RESULTS/OUTPUTS"
export BK_TIME_CONFINEMENT="3600"
export BK_MEMORY_CONFINEMENT="16384"
# this is specific to your benchmark or test
export BIN_DIR="$HOME/BenchKit/bin"
# remove the execution directoty if it exists (to avoid increse of .vmdk images)
if [ -d execution ] ; then
rm -rf execution
fi
tar xzf /home/mcc/BenchKit/INPUTS/BART-PT-010.tgz
mv BART-PT-010 execution
cd execution
pwd
ls -lh
# this is for BenchKit: explicit launching of the test
echo "====================================================================="
echo " Generated by BenchKit 2-3637"
echo " Executing tool ltsmin"
echo " Input is BART-PT-010, examination is LTLFireability"
echo " Time confinement is $BK_TIME_CONFINEMENT seconds"
echo " Memory confinement is 16384 MBytes"
echo " Number of cores is 4"
echo " Run identifier is r221-ebro-152732363300022"
echo "====================================================================="
echo
echo "--------------------"
echo "content from stdout:"
echo
echo "=== Data for post analysis generated by BenchKit (invocation template)"
echo
if [ "LTLFireability" = "UpperBounds" ] ; then
echo "The expected result is a vector of positive values"
echo NUM_VECTOR
elif [ "LTLFireability" != "StateSpace" ] ; then
echo "The expected result is a vector of booleans"
echo BOOL_VECTOR
else
echo "no data necessary for post analysis"
fi
echo
if [ -f "LTLFireability.txt" ] ; then
echo "here is the order used to build the result vector(from text file)"
for x in $(grep Property LTLFireability.txt | cut -d ' ' -f 2 | sort -u) ; do
echo "FORMULA_NAME $x"
done
elif [ -f "LTLFireability.xml" ] ; then # for cunf (txt files deleted;-)
echo echo "here is the order used to build the result vector(from xml file)"
for x in $(grep '
echo "FORMULA_NAME $x"
done
fi
echo
echo "=== Now, execution of the tool begins"
echo
echo -n "BK_START "
date -u +%s%3N
echo
timeout -s 9 $BK_TIME_CONFINEMENT bash -c "/home/mcc/BenchKit/BenchKit_head.sh 2> STDERR ; echo ; echo -n \"BK_STOP \" ; date -u +%s%3N"
if [ $? -eq 137 ] ; then
echo
echo "BK_TIME_CONFINEMENT_REACHED"
fi
echo
echo "--------------------"
echo "content from stderr:"
echo
cat STDERR ;