

About the Execution of LTSMin for BART-PT-005
| Execution Summary | |||||
| Max Memory Used (MB) |
Time wait (ms) | CPU Usage (ms) | I/O Wait (ms) | Computed Result | Execution Status |
| 15914.220 | 1801837.00 | 2420691.00 | 10278.10 | ?T??????T?FTTTFF | normal |
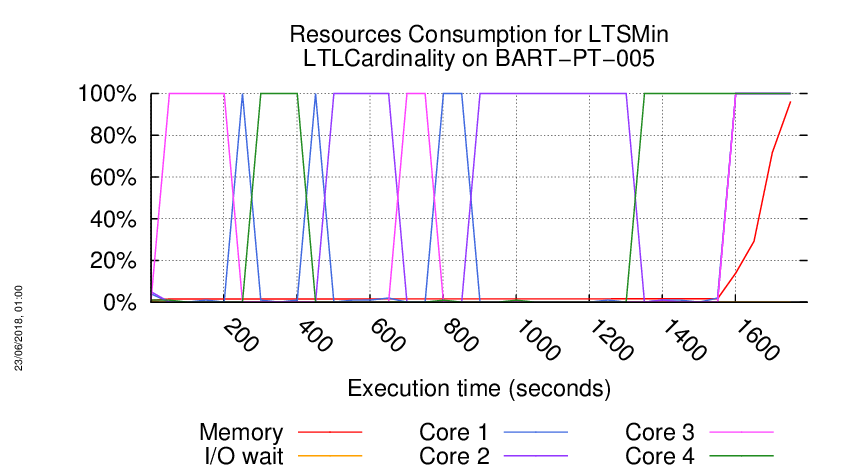
Execution Chart
We display below the execution chart for this examination (boot time has been removed).
Trace from the execution
Waiting for the VM to be ready (probing ssh)
...................
/home/mcc/execution
total 4.0M
-rw-r--r-- 1 mcc users 211K May 15 18:54 CTLCardinality.txt
-rw-r--r-- 1 mcc users 531K May 15 18:54 CTLCardinality.xml
-rw-r--r-- 1 mcc users 84K May 15 18:54 CTLFireability.txt
-rw-r--r-- 1 mcc users 221K May 15 18:54 CTLFireability.xml
-rw-r--r-- 1 mcc users 4.0K May 15 18:49 GenericPropertiesDefinition.xml
-rw-r--r-- 1 mcc users 6.1K May 15 18:49 GenericPropertiesVerdict.xml
-rw-r--r-- 1 mcc users 100K May 26 09:26 LTLCardinality.txt
-rw-r--r-- 1 mcc users 230K May 26 09:26 LTLCardinality.xml
-rw-r--r-- 1 mcc users 38K May 26 09:26 LTLFireability.txt
-rw-r--r-- 1 mcc users 97K May 26 09:26 LTLFireability.xml
-rw-r--r-- 1 mcc users 260K May 15 18:54 ReachabilityCardinality.txt
-rw-r--r-- 1 mcc users 646K May 15 18:54 ReachabilityCardinality.xml
-rw-r--r-- 1 mcc users 102 May 15 18:54 ReachabilityDeadlock.txt
-rw-r--r-- 1 mcc users 340 May 15 18:54 ReachabilityDeadlock.xml
-rw-r--r-- 1 mcc users 69K May 15 18:54 ReachabilityFireability.txt
-rw-r--r-- 1 mcc users 184K May 15 18:54 ReachabilityFireability.xml
-rw-r--r-- 1 mcc users 34K May 15 18:54 UpperBounds.txt
-rw-r--r-- 1 mcc users 66K May 15 18:54 UpperBounds.xml
-rw-r--r-- 1 mcc users 5 May 15 18:49 equiv_col
-rw-r--r-- 1 mcc users 4 May 15 18:49 instance
-rw-r--r-- 1 mcc users 6 May 15 18:49 iscolored
-rw-r--r-- 1 mcc users 1.2M May 15 18:49 model.pnml
=====================================================================
Generated by BenchKit 2-3637
Executing tool ltsmin
Input is BART-PT-005, examination is LTLCardinality
Time confinement is 3600 seconds
Memory confinement is 16384 MBytes
Number of cores is 4
Run identifier is r221-ebro-152732363300019
=====================================================================
--------------------
content from stdout:
=== Data for post analysis generated by BenchKit (invocation template)
The expected result is a vector of booleans
BOOL_VECTOR
here is the order used to build the result vector(from text file)
FORMULA_NAME BART-PT-005-LTLCardinality-00
FORMULA_NAME BART-PT-005-LTLCardinality-01
FORMULA_NAME BART-PT-005-LTLCardinality-02
FORMULA_NAME BART-PT-005-LTLCardinality-03
FORMULA_NAME BART-PT-005-LTLCardinality-04
FORMULA_NAME BART-PT-005-LTLCardinality-05
FORMULA_NAME BART-PT-005-LTLCardinality-06
FORMULA_NAME BART-PT-005-LTLCardinality-07
FORMULA_NAME BART-PT-005-LTLCardinality-08
FORMULA_NAME BART-PT-005-LTLCardinality-09
FORMULA_NAME BART-PT-005-LTLCardinality-10
FORMULA_NAME BART-PT-005-LTLCardinality-11
FORMULA_NAME BART-PT-005-LTLCardinality-12
FORMULA_NAME BART-PT-005-LTLCardinality-13
FORMULA_NAME BART-PT-005-LTLCardinality-14
FORMULA_NAME BART-PT-005-LTLCardinality-15
=== Now, execution of the tool begins
BK_START 1527484381943
FORMULA BART-PT-005-LTLCardinality-00 CANNOT_COMPUTE
FORMULA BART-PT-005-LTLCardinality-01 TRUE TECHNIQUES EXPLICIT PARALLEL_PROCESSING USE_NUPN
FORMULA BART-PT-005-LTLCardinality-02 CANNOT_COMPUTE
FORMULA BART-PT-005-LTLCardinality-03 CANNOT_COMPUTE
FORMULA BART-PT-005-LTLCardinality-04 CANNOT_COMPUTE
FORMULA BART-PT-005-LTLCardinality-05 CANNOT_COMPUTE
FORMULA BART-PT-005-LTLCardinality-06 CANNOT_COMPUTE
FORMULA BART-PT-005-LTLCardinality-07 CANNOT_COMPUTE
FORMULA BART-PT-005-LTLCardinality-08 TRUE TECHNIQUES EXPLICIT PARALLEL_PROCESSING USE_NUPN
FORMULA BART-PT-005-LTLCardinality-09 CANNOT_COMPUTE
FORMULA BART-PT-005-LTLCardinality-10 FALSE TECHNIQUES EXPLICIT PARALLEL_PROCESSING USE_NUPN
FORMULA BART-PT-005-LTLCardinality-11 TRUE TECHNIQUES EXPLICIT PARALLEL_PROCESSING USE_NUPN
FORMULA BART-PT-005-LTLCardinality-12 TRUE TECHNIQUES EXPLICIT PARALLEL_PROCESSING USE_NUPN
FORMULA BART-PT-005-LTLCardinality-13 TRUE TECHNIQUES EXPLICIT PARALLEL_PROCESSING USE_NUPN
FORMULA BART-PT-005-LTLCardinality-14 FALSE TECHNIQUES EXPLICIT PARALLEL_PROCESSING USE_NUPN
FORMULA BART-PT-005-LTLCardinality-15 FALSE TECHNIQUES EXPLICIT PARALLEL_PROCESSING USE_NUPN
BK_STOP 1527486183780
--------------------
content from stderr:
mcc2018
ltl formula name BART-PT-005-LTLCardinality-00
ltl formula formula --ltl=/tmp/ltl_0_
pnml2lts-mc( 0/ 4): Loading model from model.pnml
pnml2lts-mc( 0/ 4): Edge label is id
pnml2lts-mc( 0/ 4): Petri net has 870 places, 1010 transitions and 8100 arcs
pnml2lts-mc( 0/ 4): Petri net BART-PT-005 analyzed
pnml2lts-mc( 0/ 4): There are no safe places
pnml2lts-mc( 3/ 4): LTL layer: formula: /tmp/ltl_0_
pnml2lts-mc( 0/ 4): Loading Petri net took 0.520 real 0.240 user 0.510 sys
ltl formula name BART-PT-005-LTLCardinality-01
ltl formula formula --ltl=/tmp/ltl_1_
pnml2lts-mc( 0/ 4): Loading model from model.pnml
pnml2lts-mc( 0/ 4): Edge label is id
pnml2lts-mc( 0/ 4): Petri net has 870 places, 1010 transitions and 8100 arcs
pnml2lts-mc( 0/ 4): Petri net BART-PT-005 analyzed
pnml2lts-mc( 0/ 4): There are no safe places
pnml2lts-mc( 0/ 4): Loading Petri net took 0.410 real 0.260 user 0.380 sys
pnml2lts-mc( 0/ 4): LTL layer: formula: /tmp/ltl_1_
pnml2lts-mc( 0/ 4): buchi has 2 states
pnml2lts-mc( 0/ 4): Weak Buchi automaton detected, adding non-accepting as progress label.
pnml2lts-mc( 0/ 4): There are 872 state labels and 1 edge labels
pnml2lts-mc( 0/ 4): State length is 871, there are 1012 groups
pnml2lts-mc( 0/ 4): Running ufscc using 4 cores
pnml2lts-mc( 0/ 4): Using a tree table with 2^30 elements
pnml2lts-mc( 0/ 4): Successor permutation: dynamic
pnml2lts-mc( 0/ 4): Global bits: 0, count bits: 0, local bits: 0
pnml2lts-mc( 0/ 4):
pnml2lts-mc( 0/ 4): total scc count: 1
pnml2lts-mc( 0/ 4): unique states count: 1
pnml2lts-mc( 0/ 4): unique transitions count: 0
pnml2lts-mc( 0/ 4): - self-loop count: 0
pnml2lts-mc( 0/ 4): - claim dead count: 0
pnml2lts-mc( 0/ 4): - claim found count: 0
pnml2lts-mc( 0/ 4): - claim success count: 4
pnml2lts-mc( 0/ 4): - cum. max stack depth: 4
pnml2lts-mc( 0/ 4):
pnml2lts-mc( 0/ 4): Explored 4 states 4 transitions, fanout: 1.000
pnml2lts-mc( 0/ 4): Total exploration time 0.000 sec (0.000 sec minimum, 0.000 sec on average)
pnml2lts-mc( 0/ 4): States per second: inf, Transitions per second: inf
pnml2lts-mc( 0/ 4):
pnml2lts-mc( 0/ 4): Queue width: 12B, total height: 0, memory: 0.00MB
pnml2lts-mc( 0/ 4): Tree memory: 0.0MB, 216.0 B/state, compr.: 6.2%
pnml2lts-mc( 0/ 4): Tree fill ratio (roots/leafs): 0.0%/0.0%
pnml2lts-mc( 0/ 4): Stored 1040 string chucks using 0MB
pnml2lts-mc( 0/ 4): Total memory used for chunk indexing: 0MB
pnml2lts-mc( 0/ 4): Est. total memory use: 0.0MB (~8192.0MB paged-in)
ltl formula name BART-PT-005-LTLCardinality-02
ltl formula formula --ltl=/tmp/ltl_2_
pnml2lts-mc( 0/ 4): Loading model from model.pnml
pnml2lts-mc( 0/ 4): Edge label is id
pnml2lts-mc( 0/ 4): Petri net has 870 places, 1010 transitions and 8100 arcs
pnml2lts-mc( 0/ 4): Petri net BART-PT-005 analyzed
pnml2lts-mc( 0/ 4): There are no safe places
pnml2lts-mc( 2/ 4): LTL layer: formula: /tmp/ltl_2_
pnml2lts-mc( 0/ 4): Loading Petri net took 0.500 real 0.310 user 0.500 sys
ltl formula name BART-PT-005-LTLCardinality-03
ltl formula formula --ltl=/tmp/ltl_3_
pnml2lts-mc( 0/ 4): Loading model from model.pnml
pnml2lts-mc( 0/ 4): Edge label is id
pnml2lts-mc( 0/ 4): Petri net has 870 places, 1010 transitions and 8100 arcs
pnml2lts-mc( 0/ 4): Petri net BART-PT-005 analyzed
pnml2lts-mc( 0/ 4): There are no safe places
pnml2lts-mc( 2/ 4): LTL layer: formula: /tmp/ltl_3_
pnml2lts-mc( 0/ 4): Loading Petri net took 0.470 real 0.240 user 0.430 sys
ltl formula name BART-PT-005-LTLCardinality-04
ltl formula formula --ltl=/tmp/ltl_4_
pnml2lts-mc( 0/ 4): Loading model from model.pnml
pnml2lts-mc( 0/ 4): Edge label is id
pnml2lts-mc( 0/ 4): Petri net has 870 places, 1010 transitions and 8100 arcs
pnml2lts-mc( 0/ 4): Petri net BART-PT-005 analyzed
pnml2lts-mc( 1/ 4): LTL layer: formula: /tmp/ltl_4_
pnml2lts-mc( 0/ 4): There are no safe places
pnml2lts-mc( 0/ 4): Loading Petri net took 0.560 real 0.210 user 0.620 sys
ltl formula name BART-PT-005-LTLCardinality-05
ltl formula formula --ltl=/tmp/ltl_5_
pnml2lts-mc( 0/ 4): Loading model from model.pnml
pnml2lts-mc( 0/ 4): Edge label is id
pnml2lts-mc( 0/ 4): Petri net has 870 places, 1010 transitions and 8100 arcs
pnml2lts-mc( 0/ 4): Petri net BART-PT-005 analyzed
pnml2lts-mc( 0/ 4): There are no safe places
pnml2lts-mc( 3/ 4): LTL layer: formula: /tmp/ltl_5_
pnml2lts-mc( 0/ 4): Loading Petri net took 0.470 real 0.240 user 0.430 sys
ltl formula name BART-PT-005-LTLCardinality-06
ltl formula formula --ltl=/tmp/ltl_6_
pnml2lts-mc( 0/ 4): Loading model from model.pnml
pnml2lts-mc( 0/ 4): Edge label is id
pnml2lts-mc( 0/ 4): Petri net has 870 places, 1010 transitions and 8100 arcs
pnml2lts-mc( 0/ 4): Petri net BART-PT-005 analyzed
pnml2lts-mc( 1/ 4): LTL layer: formula: /tmp/ltl_6_
pnml2lts-mc( 0/ 4): There are no safe places
pnml2lts-mc( 0/ 4): Loading Petri net took 0.620 real 0.330 user 0.740 sys
ltl formula name BART-PT-005-LTLCardinality-07
ltl formula formula --ltl=/tmp/ltl_7_
pnml2lts-mc( 0/ 4): Loading model from model.pnml
pnml2lts-mc( 0/ 4): Edge label is id
pnml2lts-mc( 0/ 4): Petri net has 870 places, 1010 transitions and 8100 arcs
pnml2lts-mc( 0/ 4): Petri net BART-PT-005 analyzed
pnml2lts-mc( 0/ 4): There are no safe places
pnml2lts-mc( 1/ 4): LTL layer: formula: /tmp/ltl_7_
pnml2lts-mc( 0/ 4): Loading Petri net took 0.370 real 0.270 user 0.260 sys
ltl formula name BART-PT-005-LTLCardinality-08
ltl formula formula --ltl=/tmp/ltl_8_
pnml2lts-mc( 0/ 4): Loading model from model.pnml
pnml2lts-mc( 0/ 4): Edge label is id
pnml2lts-mc( 0/ 4): Petri net has 870 places, 1010 transitions and 8100 arcs
pnml2lts-mc( 0/ 4): Petri net BART-PT-005 analyzed
pnml2lts-mc( 1/ 4): LTL layer: formula: /tmp/ltl_8_
pnml2lts-mc( 0/ 4): There are no safe places
pnml2lts-mc( 0/ 4): Loading Petri net took 0.480 real 0.240 user 0.510 sys
pnml2lts-mc( 0/ 4): Weak Buchi automaton detected, adding non-accepting as progress label.
pnml2lts-mc( 0/ 4): There are 872 state labels and 1 edge labels
pnml2lts-mc( 0/ 4): State length is 871, there are 1011 groups
pnml2lts-mc( 0/ 4): Running ufscc using 4 cores
pnml2lts-mc( 0/ 4): Using a tree table with 2^30 elements
pnml2lts-mc( 0/ 4): Successor permutation: dynamic
pnml2lts-mc( 0/ 4): Global bits: 0, count bits: 0, local bits: 0
pnml2lts-mc( 0/ 4):
pnml2lts-mc( 0/ 4): total scc count: 1
pnml2lts-mc( 0/ 4): unique states count: 1
pnml2lts-mc( 0/ 4): unique transitions count: 0
pnml2lts-mc( 0/ 4): - self-loop count: 0
pnml2lts-mc( 0/ 4): - claim dead count: 0
pnml2lts-mc( 0/ 4): - claim found count: 0
pnml2lts-mc( 0/ 4): - claim success count: 4
pnml2lts-mc( 0/ 4): - cum. max stack depth: 4
pnml2lts-mc( 0/ 4):
pnml2lts-mc( 0/ 4): Explored 4 states 4 transitions, fanout: 1.000
pnml2lts-mc( 0/ 4): Total exploration time 0.010 sec (0.000 sec minimum, 0.002 sec on average)
pnml2lts-mc( 0/ 4): States per second: 400, Transitions per second: 400
pnml2lts-mc( 0/ 4):
pnml2lts-mc( 0/ 4): Queue width: 12B, total height: 0, memory: 0.00MB
pnml2lts-mc( 0/ 4): Tree memory: 0.0MB, 216.0 B/state, compr.: 6.2%
pnml2lts-mc( 0/ 4): Tree fill ratio (roots/leafs): 0.0%/0.0%
pnml2lts-mc( 0/ 4): Stored 1040 string chucks using 0MB
pnml2lts-mc( 0/ 4): Total memory used for chunk indexing: 0MB
pnml2lts-mc( 0/ 4): Est. total memory use: 0.0MB (~8192.0MB paged-in)
ltl formula name BART-PT-005-LTLCardinality-09
ltl formula formula --ltl=/tmp/ltl_9_
pnml2lts-mc( 0/ 4): Loading model from model.pnml
pnml2lts-mc( 0/ 4): Edge label is id
pnml2lts-mc( 0/ 4): Petri net has 870 places, 1010 transitions and 8100 arcs
pnml2lts-mc( 0/ 4): Petri net BART-PT-005 analyzed
pnml2lts-mc( 0/ 4): There are no safe places
pnml2lts-mc( 0/ 4): Loading Petri net took 0.440 real 0.160 user 0.600 sys
pnml2lts-mc( 0/ 4): LTL layer: formula: /tmp/ltl_9_
pnml2lts-mc( 0/ 4): buchi has 2 states
pnml2lts-mc( 0/ 4): Weak Buchi automaton detected, adding non-accepting as progress label.
pnml2lts-mc( 0/ 4): There are 872 state labels and 1 edge labels
pnml2lts-mc( 0/ 4): State length is 871, there are 1013 groups
pnml2lts-mc( 0/ 4): Running ufscc using 4 cores
pnml2lts-mc( 0/ 4): Using a tree table with 2^30 elements
pnml2lts-mc( 0/ 4): Successor permutation: dynamic
pnml2lts-mc( 0/ 4): Global bits: 0, count bits: 0, local bits: 0
pnml2lts-mc( 2/ 4): ~2500 levels ~10000 states ~85784 transitions
pnml2lts-mc( 2/ 4): ~4999 levels ~20000 states ~169352 transitions
pnml2lts-mc( 3/ 4): ~9995 levels ~40000 states ~366516 transitions
pnml2lts-mc( 3/ 4): ~19976 levels ~80000 states ~735196 transitions
pnml2lts-mc( 3/ 4): ~39941 levels ~160000 states ~1479460 transitions
pnml2lts-mc( 3/ 4): ~79722 levels ~320000 states ~2970096 transitions
pnml2lts-mc( 3/ 4): ~158855 levels ~640000 states ~5941556 transitions
pnml2lts-mc( 0/ 4): ~315081 levels ~1280000 states ~10654884 transitions
ltl formula name BART-PT-005-LTLCardinality-10
ltl formula formula --ltl=/tmp/ltl_10_
pnml2lts-mc( 0/ 4): Loading model from model.pnml
pnml2lts-mc( 0/ 4): Edge label is id
pnml2lts-mc( 0/ 4): Petri net has 870 places, 1010 transitions and 8100 arcs
pnml2lts-mc( 0/ 4): Petri net BART-PT-005 analyzed
pnml2lts-mc( 2/ 4): LTL layer: formula: /tmp/ltl_10_
pnml2lts-mc( 0/ 4): There are no safe places
pnml2lts-mc( 0/ 4): Loading Petri net took 0.600 real 0.260 user 0.810 sys
pnml2lts-mc( 0/ 4): Weak Buchi automaton detected, adding non-accepting as progress label.
pnml2lts-mc( 0/ 4): There are 872 state labels and 1 edge labels
pnml2lts-mc( 0/ 4): State length is 871, there are 1012 groups
pnml2lts-mc( 0/ 4): Running ufscc using 4 cores
pnml2lts-mc( 0/ 4): Using a tree table with 2^30 elements
pnml2lts-mc( 0/ 4): Successor permutation: dynamic
pnml2lts-mc( 0/ 4): Global bits: 0, count bits: 0, local bits: 0
pnml2lts-mc( 3/ 4):
pnml2lts-mc( 3/ 4): Accepting cycle FOUND at depth ~30!
pnml2lts-mc( 3/ 4):
pnml2lts-mc( 0/ 4):
pnml2lts-mc( 0/ 4): total scc count: 0
pnml2lts-mc( 0/ 4): unique states count: 61
pnml2lts-mc( 0/ 4): unique transitions count: 1987
pnml2lts-mc( 0/ 4): - self-loop count: 0
pnml2lts-mc( 0/ 4): - claim dead count: 0
pnml2lts-mc( 0/ 4): - claim found count: 1
pnml2lts-mc( 0/ 4): - claim success count: 64
pnml2lts-mc( 0/ 4): - cum. max stack depth: 64
pnml2lts-mc( 0/ 4):
pnml2lts-mc( 0/ 4): Explored 64 states 2531 transitions, fanout: 39.547
pnml2lts-mc( 0/ 4): Total exploration time 0.460 sec (0.420 sec minimum, 0.440 sec on average)
pnml2lts-mc( 0/ 4): States per second: 139, Transitions per second: 5502
pnml2lts-mc( 0/ 4):
pnml2lts-mc( 0/ 4): Queue width: 12B, total height: 0, memory: 0.00MB
pnml2lts-mc( 0/ 4): Tree memory: 0.0MB, 21.7 B/state, compr.: 0.6%
pnml2lts-mc( 0/ 4): Tree fill ratio (roots/leafs): 0.0%/0.0%
pnml2lts-mc( 0/ 4): Stored 1040 string chucks using 0MB
pnml2lts-mc( 0/ 4): Total memory used for chunk indexing: 0MB
pnml2lts-mc( 0/ 4): Est. total memory use: 0.0MB (~8192.0MB paged-in)
ltl formula name BART-PT-005-LTLCardinality-11
ltl formula formula --ltl=/tmp/ltl_11_
pnml2lts-mc( 0/ 4): Loading model from model.pnml
pnml2lts-mc( 0/ 4): Edge label is id
pnml2lts-mc( 0/ 4): Petri net has 870 places, 1010 transitions and 8100 arcs
pnml2lts-mc( 0/ 4): Petri net BART-PT-005 analyzed
pnml2lts-mc( 2/ 4): LTL layer: formula: /tmp/ltl_11_
pnml2lts-mc( 0/ 4): There are no safe places
pnml2lts-mc( 0/ 4): Loading Petri net took 0.660 real 0.190 user 0.960 sys
pnml2lts-mc( 0/ 4): Weak Buchi automaton detected, adding non-accepting as progress label.
pnml2lts-mc( 0/ 4): There are 872 state labels and 1 edge labels
pnml2lts-mc( 0/ 4): State length is 871, there are 1014 groups
pnml2lts-mc( 0/ 4): Running ufscc using 4 cores
pnml2lts-mc( 0/ 4): Using a tree table with 2^30 elements
pnml2lts-mc( 0/ 4): Successor permutation: dynamic
pnml2lts-mc( 0/ 4): Global bits: 0, count bits: 0, local bits: 0
pnml2lts-mc( 3/ 4): ~3 levels ~10000 states ~12988 transitions
pnml2lts-mc( 0/ 4):
pnml2lts-mc( 0/ 4): total scc count: 13496
pnml2lts-mc( 0/ 4): unique states count: 13496
pnml2lts-mc( 0/ 4): unique transitions count: 26455
pnml2lts-mc( 0/ 4): - self-loop count: 0
pnml2lts-mc( 0/ 4): - claim dead count: 14108
pnml2lts-mc( 0/ 4): - claim found count: 0
pnml2lts-mc( 0/ 4): - claim success count: 13551
pnml2lts-mc( 0/ 4): - cum. max stack depth: 12
pnml2lts-mc( 0/ 4):
pnml2lts-mc( 0/ 4): Explored 13551 states 29335 transitions, fanout: 2.165
pnml2lts-mc( 0/ 4): Total exploration time 4.130 sec (4.130 sec minimum, 4.130 sec on average)
pnml2lts-mc( 0/ 4): States per second: 3281, Transitions per second: 7103
pnml2lts-mc( 0/ 4):
pnml2lts-mc( 0/ 4): Queue width: 12B, total height: 0, memory: 0.00MB
pnml2lts-mc( 0/ 4): Tree memory: 0.2MB, 18.4 B/state, compr.: 0.5%
pnml2lts-mc( 0/ 4): Tree fill ratio (roots/leafs): 0.0%/0.0%
pnml2lts-mc( 0/ 4): Stored 1040 string chucks using 0MB
pnml2lts-mc( 0/ 4): Total memory used for chunk indexing: 0MB
pnml2lts-mc( 0/ 4): Est. total memory use: 0.2MB (~8192.0MB paged-in)
ltl formula name BART-PT-005-LTLCardinality-12
ltl formula formula --ltl=/tmp/ltl_12_
pnml2lts-mc( 0/ 4): Loading model from model.pnml
pnml2lts-mc( 0/ 4): Edge label is id
pnml2lts-mc( 0/ 4): Petri net has 870 places, 1010 transitions and 8100 arcs
pnml2lts-mc( 0/ 4): Petri net BART-PT-005 analyzed
pnml2lts-mc( 0/ 4): There are no safe places
pnml2lts-mc( 3/ 4): LTL layer: formula: /tmp/ltl_12_
pnml2lts-mc( 0/ 4): Loading Petri net took 0.500 real 0.200 user 0.600 sys
pnml2lts-mc( 0/ 4): Weak Buchi automaton detected, adding non-accepting as progress label.
pnml2lts-mc( 0/ 4): There are 872 state labels and 1 edge labels
pnml2lts-mc( 0/ 4): State length is 871, there are 1012 groups
pnml2lts-mc( 0/ 4): Running ufscc using 4 cores
pnml2lts-mc( 0/ 4): Using a tree table with 2^30 elements
pnml2lts-mc( 0/ 4): Successor permutation: dynamic
pnml2lts-mc( 0/ 4): Global bits: 0, count bits: 0, local bits: 0
pnml2lts-mc( 0/ 4):
pnml2lts-mc( 0/ 4): total scc count: 1
pnml2lts-mc( 0/ 4): unique states count: 1
pnml2lts-mc( 0/ 4): unique transitions count: 0
pnml2lts-mc( 0/ 4): - self-loop count: 0
pnml2lts-mc( 0/ 4): - claim dead count: 0
pnml2lts-mc( 0/ 4): - claim found count: 0
pnml2lts-mc( 0/ 4): - claim success count: 4
pnml2lts-mc( 0/ 4): - cum. max stack depth: 4
pnml2lts-mc( 0/ 4):
pnml2lts-mc( 0/ 4): Explored 4 states 4 transitions, fanout: 1.000
pnml2lts-mc( 0/ 4): Total exploration time 0.020 sec (0.000 sec minimum, 0.010 sec on average)
pnml2lts-mc( 0/ 4): States per second: 200, Transitions per second: 200
pnml2lts-mc( 0/ 4):
pnml2lts-mc( 0/ 4): Queue width: 12B, total height: 0, memory: 0.00MB
pnml2lts-mc( 0/ 4): Tree memory: 0.0MB, 216.0 B/state, compr.: 6.2%
pnml2lts-mc( 0/ 4): Tree fill ratio (roots/leafs): 0.0%/0.0%
pnml2lts-mc( 0/ 4): Stored 1040 string chucks using 0MB
pnml2lts-mc( 0/ 4): Total memory used for chunk indexing: 0MB
pnml2lts-mc( 0/ 4): Est. total memory use: 0.0MB (~8192.0MB paged-in)
ltl formula name BART-PT-005-LTLCardinality-13
ltl formula formula --ltl=/tmp/ltl_13_
pnml2lts-mc( 0/ 4): Loading model from model.pnml
pnml2lts-mc( 0/ 4): Edge label is id
pnml2lts-mc( 0/ 4): Petri net has 870 places, 1010 transitions and 8100 arcs
pnml2lts-mc( 0/ 4): Petri net BART-PT-005 analyzed
pnml2lts-mc( 0/ 4): There are no safe places
pnml2lts-mc( 2/ 4): LTL layer: formula: /tmp/ltl_13_
pnml2lts-mc( 0/ 4): Loading Petri net took 0.460 real 0.270 user 0.510 sys
pnml2lts-mc( 0/ 4): Weak Buchi automaton detected, adding non-accepting as progress label.
pnml2lts-mc( 0/ 4): There are 872 state labels and 1 edge labels
pnml2lts-mc( 0/ 4): State length is 871, there are 1012 groups
pnml2lts-mc( 0/ 4): Running ufscc using 4 cores
pnml2lts-mc( 0/ 4): Using a tree table with 2^30 elements
pnml2lts-mc( 0/ 4): Successor permutation: dynamic
pnml2lts-mc( 0/ 4): Global bits: 0, count bits: 0, local bits: 0
pnml2lts-mc( 0/ 4):
pnml2lts-mc( 0/ 4): total scc count: 1
pnml2lts-mc( 0/ 4): unique states count: 1
pnml2lts-mc( 0/ 4): unique transitions count: 0
pnml2lts-mc( 0/ 4): - self-loop count: 0
pnml2lts-mc( 0/ 4): - claim dead count: 0
pnml2lts-mc( 0/ 4): - claim found count: 0
pnml2lts-mc( 0/ 4): - claim success count: 4
pnml2lts-mc( 0/ 4): - cum. max stack depth: 4
pnml2lts-mc( 0/ 4):
pnml2lts-mc( 0/ 4): Explored 4 states 4 transitions, fanout: 1.000
pnml2lts-mc( 0/ 4): Total exploration time 0.000 sec (0.000 sec minimum, 0.000 sec on average)
pnml2lts-mc( 0/ 4): States per second: inf, Transitions per second: inf
pnml2lts-mc( 0/ 4):
pnml2lts-mc( 0/ 4): Queue width: 12B, total height: 0, memory: 0.00MB
pnml2lts-mc( 0/ 4): Tree memory: 0.0MB, 216.0 B/state, compr.: 6.2%
pnml2lts-mc( 0/ 4): Tree fill ratio (roots/leafs): 0.0%/0.0%
pnml2lts-mc( 0/ 4): Stored 1040 string chucks using 0MB
pnml2lts-mc( 0/ 4): Total memory used for chunk indexing: 0MB
pnml2lts-mc( 0/ 4): Est. total memory use: 0.0MB (~8192.0MB paged-in)
ltl formula name BART-PT-005-LTLCardinality-14
ltl formula formula --ltl=/tmp/ltl_14_
pnml2lts-mc( 0/ 4): Loading model from model.pnml
pnml2lts-mc( 0/ 4): Edge label is id
pnml2lts-mc( 0/ 4): Petri net has 870 places, 1010 transitions and 8100 arcs
pnml2lts-mc( 0/ 4): Petri net BART-PT-005 analyzed
pnml2lts-mc( 0/ 4): There are no safe places
pnml2lts-mc( 3/ 4): LTL layer: formula: /tmp/ltl_14_
pnml2lts-mc( 0/ 4): Loading Petri net took 0.470 real 0.260 user 0.480 sys
pnml2lts-mc( 0/ 4): Weak Buchi automaton detected, adding non-accepting as progress label.
pnml2lts-mc( 0/ 4): There are 872 state labels and 1 edge labels
pnml2lts-mc( 0/ 4): State length is 871, there are 1014 groups
pnml2lts-mc( 0/ 4): Running ufscc using 4 cores
pnml2lts-mc( 0/ 4): Using a tree table with 2^30 elements
pnml2lts-mc( 0/ 4): Successor permutation: dynamic
pnml2lts-mc( 0/ 4): Global bits: 0, count bits: 0, local bits: 0
pnml2lts-mc( 2/ 4):
pnml2lts-mc( 2/ 4): Accepting cycle FOUND at depth ~38!
pnml2lts-mc( 2/ 4):
pnml2lts-mc( 0/ 4):
pnml2lts-mc( 0/ 4): total scc count: 0
pnml2lts-mc( 0/ 4): unique states count: 79
pnml2lts-mc( 0/ 4): unique transitions count: 2142
pnml2lts-mc( 0/ 4): - self-loop count: 0
pnml2lts-mc( 0/ 4): - claim dead count: 0
pnml2lts-mc( 0/ 4): - claim found count: 1
pnml2lts-mc( 0/ 4): - claim success count: 82
pnml2lts-mc( 0/ 4): - cum. max stack depth: 82
pnml2lts-mc( 0/ 4):
pnml2lts-mc( 0/ 4): Explored 82 states 2686 transitions, fanout: 32.756
pnml2lts-mc( 0/ 4): Total exploration time 0.350 sec (0.340 sec minimum, 0.343 sec on average)
pnml2lts-mc( 0/ 4): States per second: 234, Transitions per second: 7674
pnml2lts-mc( 0/ 4):
pnml2lts-mc( 0/ 4): Queue width: 12B, total height: 0, memory: 0.00MB
pnml2lts-mc( 0/ 4): Tree memory: 0.0MB, 22.5 B/state, compr.: 0.6%
pnml2lts-mc( 0/ 4): Tree fill ratio (roots/leafs): 0.0%/0.0%
pnml2lts-mc( 0/ 4): Stored 1040 string chucks using 0MB
pnml2lts-mc( 0/ 4): Total memory used for chunk indexing: 0MB
pnml2lts-mc( 0/ 4): Est. total memory use: 0.0MB (~8192.0MB paged-in)
ltl formula name BART-PT-005-LTLCardinality-15
ltl formula formula --ltl=/tmp/ltl_15_
pnml2lts-mc( 0/ 4): Loading model from model.pnml
pnml2lts-mc( 0/ 4): Edge label is id
pnml2lts-mc( 0/ 4): Petri net has 870 places, 1010 transitions and 8100 arcs
pnml2lts-mc( 0/ 4): Petri net BART-PT-005 analyzed
pnml2lts-mc( 3/ 4): LTL layer: formula: /tmp/ltl_15_
pnml2lts-mc( 0/ 4): There are no safe places
pnml2lts-mc( 0/ 4): Loading Petri net took 0.550 real 0.290 user 0.640 sys
pnml2lts-mc( 0/ 4): Weak Buchi automaton detected, adding non-accepting as progress label.
pnml2lts-mc( 0/ 4): There are 872 state labels and 1 edge labels
pnml2lts-mc( 0/ 4): State length is 871, there are 1012 groups
pnml2lts-mc( 0/ 4): Running ufscc using 4 cores
pnml2lts-mc( 0/ 4): Using a tree table with 2^30 elements
pnml2lts-mc( 0/ 4): Successor permutation: dynamic
pnml2lts-mc( 0/ 4): Global bits: 0, count bits: 0, local bits: 0
pnml2lts-mc( 3/ 4):
pnml2lts-mc( 3/ 4): Accepting cycle FOUND at depth ~35!
pnml2lts-mc( 3/ 4):
pnml2lts-mc( 0/ 4):
pnml2lts-mc( 0/ 4): total scc count: 0
pnml2lts-mc( 0/ 4): unique states count: 63
pnml2lts-mc( 0/ 4): unique transitions count: 2224
pnml2lts-mc( 0/ 4): - self-loop count: 0
pnml2lts-mc( 0/ 4): - claim dead count: 0
pnml2lts-mc( 0/ 4): - claim found count: 1
pnml2lts-mc( 0/ 4): - claim success count: 66
pnml2lts-mc( 0/ 4): - cum. max stack depth: 66
pnml2lts-mc( 0/ 4):
pnml2lts-mc( 0/ 4): Explored 66 states 2768 transitions, fanout: 41.939
pnml2lts-mc( 0/ 4): Total exploration time 0.490 sec (0.470 sec minimum, 0.478 sec on average)
pnml2lts-mc( 0/ 4): States per second: 135, Transitions per second: 5649
pnml2lts-mc( 0/ 4):
pnml2lts-mc( 0/ 4): Queue width: 12B, total height: 0, memory: 0.00MB
pnml2lts-mc( 0/ 4): Tree memory: 0.0MB, 21.2 B/state, compr.: 0.6%
pnml2lts-mc( 0/ 4): Tree fill ratio (roots/leafs): 0.0%/0.0%
pnml2lts-mc( 0/ 4): Stored 1040 string chucks using 0MB
pnml2lts-mc( 0/ 4): Total memory used for chunk indexing: 0MB
pnml2lts-mc( 0/ 4): Est. total memory use: 0.0MB (~8192.0MB paged-in)
Sequence of Actions to be Executed by the VM
This is useful if one wants to reexecute the tool in the VM from the submitted image disk.
set -x
# this is for BenchKit: configuration of major elements for the test
export BK_INPUT="BART-PT-005"
export BK_EXAMINATION="LTLCardinality"
export BK_TOOL="ltsmin"
export BK_RESULT_DIR="/tmp/BK_RESULTS/OUTPUTS"
export BK_TIME_CONFINEMENT="3600"
export BK_MEMORY_CONFINEMENT="16384"
# this is specific to your benchmark or test
export BIN_DIR="$HOME/BenchKit/bin"
# remove the execution directoty if it exists (to avoid increse of .vmdk images)
if [ -d execution ] ; then
rm -rf execution
fi
tar xzf /home/mcc/BenchKit/INPUTS/BART-PT-005.tgz
mv BART-PT-005 execution
cd execution
pwd
ls -lh
# this is for BenchKit: explicit launching of the test
echo "====================================================================="
echo " Generated by BenchKit 2-3637"
echo " Executing tool ltsmin"
echo " Input is BART-PT-005, examination is LTLCardinality"
echo " Time confinement is $BK_TIME_CONFINEMENT seconds"
echo " Memory confinement is 16384 MBytes"
echo " Number of cores is 4"
echo " Run identifier is r221-ebro-152732363300019"
echo "====================================================================="
echo
echo "--------------------"
echo "content from stdout:"
echo
echo "=== Data for post analysis generated by BenchKit (invocation template)"
echo
if [ "LTLCardinality" = "UpperBounds" ] ; then
echo "The expected result is a vector of positive values"
echo NUM_VECTOR
elif [ "LTLCardinality" != "StateSpace" ] ; then
echo "The expected result is a vector of booleans"
echo BOOL_VECTOR
else
echo "no data necessary for post analysis"
fi
echo
if [ -f "LTLCardinality.txt" ] ; then
echo "here is the order used to build the result vector(from text file)"
for x in $(grep Property LTLCardinality.txt | cut -d ' ' -f 2 | sort -u) ; do
echo "FORMULA_NAME $x"
done
elif [ -f "LTLCardinality.xml" ] ; then # for cunf (txt files deleted;-)
echo echo "here is the order used to build the result vector(from xml file)"
for x in $(grep '
echo "FORMULA_NAME $x"
done
fi
echo
echo "=== Now, execution of the tool begins"
echo
echo -n "BK_START "
date -u +%s%3N
echo
timeout -s 9 $BK_TIME_CONFINEMENT bash -c "/home/mcc/BenchKit/BenchKit_head.sh 2> STDERR ; echo ; echo -n \"BK_STOP \" ; date -u +%s%3N"
if [ $? -eq 137 ] ; then
echo
echo "BK_TIME_CONFINEMENT_REACHED"
fi
echo
echo "--------------------"
echo "content from stderr:"
echo
cat STDERR ;