

About the Execution of LTSMin for PolyORBNT-PT-S10J60
| Execution Summary | |||||
| Max Memory Used (MB) |
Time wait (ms) | CPU Usage (ms) | I/O Wait (ms) | Computed Result | Execution Status |
| 2136.790 | 1183561.00 | 1298196.00 | 3040.20 | F??F???FFFFFFFFF | normal |
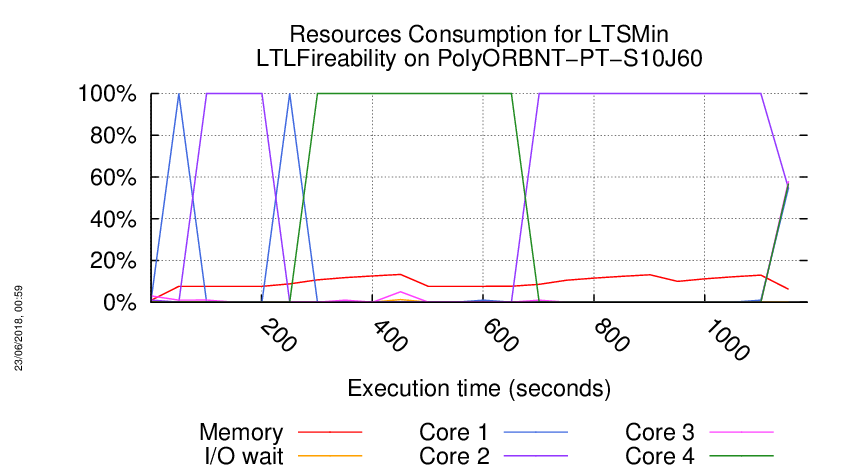
Execution Chart
We display below the execution chart for this examination (boot time has been removed).
Trace from the execution
Waiting for the VM to be ready (probing ssh)
...................
/home/mcc/execution
total 22M
-rw-r--r-- 1 mcc users 16K May 15 18:54 CTLCardinality.txt
-rw-r--r-- 1 mcc users 51K May 15 18:54 CTLCardinality.xml
-rw-r--r-- 1 mcc users 271K May 15 18:54 CTLFireability.txt
-rw-r--r-- 1 mcc users 795K May 15 18:54 CTLFireability.xml
-rw-r--r-- 1 mcc users 4.0K May 15 18:50 GenericPropertiesDefinition.xml
-rw-r--r-- 1 mcc users 6.2K May 15 18:50 GenericPropertiesVerdict.xml
-rw-r--r-- 1 mcc users 9.2K May 26 09:27 LTLCardinality.txt
-rw-r--r-- 1 mcc users 28K May 26 09:27 LTLCardinality.xml
-rw-r--r-- 1 mcc users 40K May 26 09:27 LTLFireability.txt
-rw-r--r-- 1 mcc users 121K May 26 09:27 LTLFireability.xml
-rw-r--r-- 1 mcc users 13K May 15 18:54 ReachabilityCardinality.txt
-rw-r--r-- 1 mcc users 37K May 15 18:54 ReachabilityCardinality.xml
-rw-r--r-- 1 mcc users 110 May 15 18:54 ReachabilityDeadlock.txt
-rw-r--r-- 1 mcc users 348 May 15 18:54 ReachabilityDeadlock.xml
-rw-r--r-- 1 mcc users 494K May 15 18:54 ReachabilityFireability.txt
-rw-r--r-- 1 mcc users 1.3M May 15 18:54 ReachabilityFireability.xml
-rw-r--r-- 1 mcc users 15K May 15 18:54 UpperBounds.txt
-rw-r--r-- 1 mcc users 30K May 15 18:54 UpperBounds.xml
-rw-r--r-- 1 mcc users 5 May 15 18:50 equiv_col
-rw-r--r-- 1 mcc users 7 May 15 18:50 instance
-rw-r--r-- 1 mcc users 6 May 15 18:50 iscolored
-rw-r--r-- 1 mcc users 19M May 15 18:50 model.pnml
=====================================================================
Generated by BenchKit 2-3637
Executing tool ltsmin
Input is PolyORBNT-PT-S10J60, examination is LTLFireability
Time confinement is 3600 seconds
Memory confinement is 16384 MBytes
Number of cores is 4
Run identifier is r209-smll-152732259200462
=====================================================================
--------------------
content from stdout:
=== Data for post analysis generated by BenchKit (invocation template)
The expected result is a vector of booleans
BOOL_VECTOR
here is the order used to build the result vector(from text file)
FORMULA_NAME PolyORBNT-PT-S10J60-LTLFireability-00
FORMULA_NAME PolyORBNT-PT-S10J60-LTLFireability-01
FORMULA_NAME PolyORBNT-PT-S10J60-LTLFireability-02
FORMULA_NAME PolyORBNT-PT-S10J60-LTLFireability-03
FORMULA_NAME PolyORBNT-PT-S10J60-LTLFireability-04
FORMULA_NAME PolyORBNT-PT-S10J60-LTLFireability-05
FORMULA_NAME PolyORBNT-PT-S10J60-LTLFireability-06
FORMULA_NAME PolyORBNT-PT-S10J60-LTLFireability-07
FORMULA_NAME PolyORBNT-PT-S10J60-LTLFireability-08
FORMULA_NAME PolyORBNT-PT-S10J60-LTLFireability-09
FORMULA_NAME PolyORBNT-PT-S10J60-LTLFireability-10
FORMULA_NAME PolyORBNT-PT-S10J60-LTLFireability-11
FORMULA_NAME PolyORBNT-PT-S10J60-LTLFireability-12
FORMULA_NAME PolyORBNT-PT-S10J60-LTLFireability-13
FORMULA_NAME PolyORBNT-PT-S10J60-LTLFireability-14
FORMULA_NAME PolyORBNT-PT-S10J60-LTLFireability-15
=== Now, execution of the tool begins
BK_START 1527415292172
FORMULA PolyORBNT-PT-S10J60-LTLFireability-00 FALSE TECHNIQUES EXPLICIT PARALLEL_PROCESSING USE_NUPN
FORMULA PolyORBNT-PT-S10J60-LTLFireability-01 CANNOT_COMPUTE
FORMULA PolyORBNT-PT-S10J60-LTLFireability-02 CANNOT_COMPUTE
FORMULA PolyORBNT-PT-S10J60-LTLFireability-03 FALSE TECHNIQUES EXPLICIT PARALLEL_PROCESSING USE_NUPN
FORMULA PolyORBNT-PT-S10J60-LTLFireability-04 CANNOT_COMPUTE
FORMULA PolyORBNT-PT-S10J60-LTLFireability-05 CANNOT_COMPUTE
FORMULA PolyORBNT-PT-S10J60-LTLFireability-06 CANNOT_COMPUTE
FORMULA PolyORBNT-PT-S10J60-LTLFireability-07 FALSE TECHNIQUES EXPLICIT PARALLEL_PROCESSING USE_NUPN
FORMULA PolyORBNT-PT-S10J60-LTLFireability-08 FALSE TECHNIQUES EXPLICIT PARALLEL_PROCESSING USE_NUPN
FORMULA PolyORBNT-PT-S10J60-LTLFireability-09 FALSE TECHNIQUES EXPLICIT PARALLEL_PROCESSING USE_NUPN
FORMULA PolyORBNT-PT-S10J60-LTLFireability-10 FALSE TECHNIQUES EXPLICIT PARALLEL_PROCESSING USE_NUPN
FORMULA PolyORBNT-PT-S10J60-LTLFireability-11 FALSE TECHNIQUES EXPLICIT PARALLEL_PROCESSING USE_NUPN
FORMULA PolyORBNT-PT-S10J60-LTLFireability-12 FALSE TECHNIQUES EXPLICIT PARALLEL_PROCESSING USE_NUPN
FORMULA PolyORBNT-PT-S10J60-LTLFireability-13 FALSE TECHNIQUES EXPLICIT PARALLEL_PROCESSING USE_NUPN
FORMULA PolyORBNT-PT-S10J60-LTLFireability-14 FALSE TECHNIQUES EXPLICIT PARALLEL_PROCESSING USE_NUPN
FORMULA PolyORBNT-PT-S10J60-LTLFireability-15 FALSE TECHNIQUES EXPLICIT PARALLEL_PROCESSING USE_NUPN
BK_STOP 1527416475733
--------------------
content from stderr:
mcc2018
ltl formula name PolyORBNT-PT-S10J60-LTLFireability-00
ltl formula formula --ltl=/tmp/ltl_0_
pnml2lts-mc( 0/ 4): Loading model from model.pnml
pnml2lts-mc( 0/ 4): Edge label is id
pnml2lts-mc( 0/ 4): Petri net has 1234 places, 12920 transitions and 116879 arcs
pnml2lts-mc( 0/ 4): Petri net PolyORBNT-PT-S10J60 analyzed
pnml2lts-mc( 0/ 4): There are no safe places
pnml2lts-mc( 0/ 4): Loading Petri net took 1.530 real 2.380 user 1.310 sys
pnml2lts-mc( 1/ 4): LTL layer: formula: /tmp/ltl_0_
pnml2lts-mc( 0/ 4): Weak Buchi automaton detected, adding non-accepting as progress label.
pnml2lts-mc( 0/ 4): There are 1271 state labels and 1 edge labels
pnml2lts-mc( 0/ 4): State length is 1235, there are 12923 groups
pnml2lts-mc( 0/ 4): Running ufscc using 4 cores
pnml2lts-mc( 0/ 4): Using a tree table with 2^30 elements
pnml2lts-mc( 0/ 4): Successor permutation: dynamic
pnml2lts-mc( 0/ 4): Global bits: 0, count bits: 0, local bits: 0
pnml2lts-mc( 2/ 4):
pnml2lts-mc( 2/ 4): Accepting cycle FOUND at depth ~15!
pnml2lts-mc( 2/ 4):
pnml2lts-mc( 0/ 4):
pnml2lts-mc( 0/ 4): total scc count: 0
pnml2lts-mc( 0/ 4): unique states count: 50
pnml2lts-mc( 0/ 4): unique transitions count: 744
pnml2lts-mc( 0/ 4): - self-loop count: 1
pnml2lts-mc( 0/ 4): - claim dead count: 0
pnml2lts-mc( 0/ 4): - claim found count: 0
pnml2lts-mc( 0/ 4): - claim success count: 56
pnml2lts-mc( 0/ 4): - cum. max stack depth: 56
pnml2lts-mc( 0/ 4):
pnml2lts-mc( 0/ 4): Explored 56 states 805 transitions, fanout: 14.375
pnml2lts-mc( 0/ 4): Total exploration time 0.060 sec (0.050 sec minimum, 0.055 sec on average)
pnml2lts-mc( 0/ 4): States per second: 933, Transitions per second: 13417
pnml2lts-mc( 0/ 4):
pnml2lts-mc( 0/ 4): Queue width: 12B, total height: 0, memory: 0.00MB
pnml2lts-mc( 0/ 4): Tree memory: 0.0MB, 66.9 B/state, compr.: 1.4%
pnml2lts-mc( 0/ 4): Tree fill ratio (roots/leafs): 0.0%/0.0%
pnml2lts-mc( 0/ 4): Stored 13159 string chucks using 0MB
pnml2lts-mc( 0/ 4): Total memory used for chunk indexing: 0MB
pnml2lts-mc( 0/ 4): Est. total memory use: 0.0MB (~8192.0MB paged-in)
ltl formula name PolyORBNT-PT-S10J60-LTLFireability-01
ltl formula formula --ltl=/tmp/ltl_1_
pnml2lts-mc( 0/ 4): Loading model from model.pnml
pnml2lts-mc( 0/ 4): Edge label is id
pnml2lts-mc( 0/ 4): Petri net has 1234 places, 12920 transitions and 116879 arcs
pnml2lts-mc( 0/ 4): Petri net PolyORBNT-PT-S10J60 analyzed
pnml2lts-mc( 0/ 4): There are no safe places
pnml2lts-mc( 0/ 4): Loading Petri net took 1.480 real 2.480 user 1.280 sys
pnml2lts-mc( 2/ 4): LTL layer: formula: /tmp/ltl_1_
ltl formula name PolyORBNT-PT-S10J60-LTLFireability-02
ltl formula formula --ltl=/tmp/ltl_2_
pnml2lts-mc( 0/ 4): Loading model from model.pnml
pnml2lts-mc( 0/ 4): Edge label is id
pnml2lts-mc( 0/ 4): Petri net has 1234 places, 12920 transitions and 116879 arcs
pnml2lts-mc( 0/ 4): Petri net PolyORBNT-PT-S10J60 analyzed
pnml2lts-mc( 0/ 4): There are no safe places
pnml2lts-mc( 0/ 4): Loading Petri net took 1.480 real 2.540 user 1.220 sys
pnml2lts-mc( 1/ 4): LTL layer: formula: /tmp/ltl_2_
ltl formula name PolyORBNT-PT-S10J60-LTLFireability-03
ltl formula formula --ltl=/tmp/ltl_3_
pnml2lts-mc( 0/ 4): Loading model from model.pnml
pnml2lts-mc( 0/ 4): Edge label is id
pnml2lts-mc( 0/ 4): Petri net has 1234 places, 12920 transitions and 116879 arcs
pnml2lts-mc( 0/ 4): Petri net PolyORBNT-PT-S10J60 analyzed
pnml2lts-mc( 0/ 4): There are no safe places
pnml2lts-mc( 0/ 4): Loading Petri net took 1.420 real 2.380 user 1.260 sys
pnml2lts-mc( 3/ 4): LTL layer: formula: /tmp/ltl_3_
pnml2lts-mc( 0/ 4): There are 1270 state labels and 1 edge labels
pnml2lts-mc( 0/ 4): State length is 1235, there are 12924 groups
pnml2lts-mc( 0/ 4): Running ufscc using 4 cores
pnml2lts-mc( 0/ 4): Using a tree table with 2^30 elements
pnml2lts-mc( 0/ 4): Successor permutation: dynamic
pnml2lts-mc( 0/ 4): Global bits: 0, count bits: 0, local bits: 0
pnml2lts-mc( 3/ 4):
pnml2lts-mc( 3/ 4): Accepting cycle FOUND at depth ~18!
pnml2lts-mc( 3/ 4):
pnml2lts-mc( 0/ 4):
pnml2lts-mc( 0/ 4): total scc count: 0
pnml2lts-mc( 0/ 4): unique states count: 49
pnml2lts-mc( 0/ 4): unique transitions count: 252
pnml2lts-mc( 0/ 4): - self-loop count: 4
pnml2lts-mc( 0/ 4): - claim dead count: 0
pnml2lts-mc( 0/ 4): - claim found count: 0
pnml2lts-mc( 0/ 4): - claim success count: 72
pnml2lts-mc( 0/ 4): - cum. max stack depth: 72
pnml2lts-mc( 0/ 4):
pnml2lts-mc( 0/ 4): Explored 72 states 345 transitions, fanout: 4.792
pnml2lts-mc( 0/ 4): Total exploration time 0.050 sec (0.050 sec minimum, 0.050 sec on average)
pnml2lts-mc( 0/ 4): States per second: 1440, Transitions per second: 6900
pnml2lts-mc( 0/ 4):
pnml2lts-mc( 0/ 4): Queue width: 12B, total height: 0, memory: 0.00MB
pnml2lts-mc( 0/ 4): Tree memory: 0.0MB, 47.9 B/state, compr.: 1.0%
pnml2lts-mc( 0/ 4): Tree fill ratio (roots/leafs): 0.0%/0.0%
pnml2lts-mc( 0/ 4): Stored 13159 string chucks using 0MB
pnml2lts-mc( 0/ 4): Total memory used for chunk indexing: 0MB
pnml2lts-mc( 0/ 4): Est. total memory use: 0.0MB (~8192.0MB paged-in)
ltl formula name PolyORBNT-PT-S10J60-LTLFireability-04
ltl formula formula --ltl=/tmp/ltl_4_
pnml2lts-mc( 0/ 4): Loading model from model.pnml
pnml2lts-mc( 0/ 4): Edge label is id
pnml2lts-mc( 0/ 4): Petri net has 1234 places, 12920 transitions and 116879 arcs
pnml2lts-mc( 0/ 4): Petri net PolyORBNT-PT-S10J60 analyzed
pnml2lts-mc( 0/ 4): There are no safe places
pnml2lts-mc( 0/ 4): Loading Petri net took 1.430 real 2.530 user 1.170 sys
pnml2lts-mc( 2/ 4): LTL layer: formula: /tmp/ltl_4_
ltl formula name PolyORBNT-PT-S10J60-LTLFireability-05
ltl formula formula --ltl=/tmp/ltl_5_
pnml2lts-mc( 0/ 4): Loading model from model.pnml
pnml2lts-mc( 0/ 4): Edge label is id
pnml2lts-mc( 0/ 4): Petri net has 1234 places, 12920 transitions and 116879 arcs
pnml2lts-mc( 0/ 4): Petri net PolyORBNT-PT-S10J60 analyzed
pnml2lts-mc( 0/ 4): There are no safe places
pnml2lts-mc( 0/ 4): Loading Petri net took 2.180 real 2.900 user 1.860 sys
pnml2lts-mc( 0/ 4): LTL layer: formula: /tmp/ltl_5_
ltl formula name PolyORBNT-PT-S10J60-LTLFireability-06
ltl formula formula --ltl=/tmp/ltl_6_
pnml2lts-mc( 0/ 4): Loading model from model.pnml
pnml2lts-mc( 0/ 4): Edge label is id
pnml2lts-mc( 0/ 4): Petri net has 1234 places, 12920 transitions and 116879 arcs
pnml2lts-mc( 0/ 4): Petri net PolyORBNT-PT-S10J60 analyzed
pnml2lts-mc( 0/ 4): There are no safe places
pnml2lts-mc( 0/ 4): Loading Petri net took 1.710 real 2.760 user 1.360 sys
pnml2lts-mc( 0/ 4): LTL layer: formula: /tmp/ltl_6_
ltl formula name PolyORBNT-PT-S10J60-LTLFireability-07
ltl formula formula --ltl=/tmp/ltl_7_
pnml2lts-mc( 0/ 4): Loading model from model.pnml
pnml2lts-mc( 0/ 4): Edge label is id
pnml2lts-mc( 0/ 4): Petri net has 1234 places, 12920 transitions and 116879 arcs
pnml2lts-mc( 0/ 4): Petri net PolyORBNT-PT-S10J60 analyzed
pnml2lts-mc( 0/ 4): There are no safe places
pnml2lts-mc( 0/ 4): Loading Petri net took 1.600 real 2.760 user 1.180 sys
pnml2lts-mc( 3/ 4): LTL layer: formula: /tmp/ltl_7_
pnml2lts-mc( 0/ 4): Weak Buchi automaton detected, adding non-accepting as progress label.
pnml2lts-mc( 0/ 4): There are 1271 state labels and 1 edge labels
pnml2lts-mc( 0/ 4): State length is 1235, there are 12923 groups
pnml2lts-mc( 0/ 4): Running ufscc using 4 cores
pnml2lts-mc( 0/ 4): Using a tree table with 2^30 elements
pnml2lts-mc( 0/ 4): Successor permutation: dynamic
pnml2lts-mc( 0/ 4): Global bits: 0, count bits: 0, local bits: 0
pnml2lts-mc( 0/ 4):
pnml2lts-mc( 0/ 4): Accepting cycle FOUND at depth ~16!
pnml2lts-mc( 0/ 4):
pnml2lts-mc( 0/ 4):
pnml2lts-mc( 0/ 4): total scc count: 0
pnml2lts-mc( 0/ 4): unique states count: 65
pnml2lts-mc( 0/ 4): unique transitions count: 682
pnml2lts-mc( 0/ 4): - self-loop count: 6
pnml2lts-mc( 0/ 4): - claim dead count: 0
pnml2lts-mc( 0/ 4): - claim found count: 0
pnml2lts-mc( 0/ 4): - claim success count: 68
pnml2lts-mc( 0/ 4): - cum. max stack depth: 68
pnml2lts-mc( 0/ 4):
pnml2lts-mc( 0/ 4): Explored 68 states 752 transitions, fanout: 11.059
pnml2lts-mc( 0/ 4): Total exploration time 0.110 sec (0.090 sec minimum, 0.105 sec on average)
pnml2lts-mc( 0/ 4): States per second: 618, Transitions per second: 6836
pnml2lts-mc( 0/ 4):
pnml2lts-mc( 0/ 4): Queue width: 12B, total height: 0, memory: 0.00MB
pnml2lts-mc( 0/ 4): Tree memory: 0.0MB, 34.0 B/state, compr.: 0.7%
pnml2lts-mc( 0/ 4): Tree fill ratio (roots/leafs): 0.0%/0.0%
pnml2lts-mc( 0/ 4): Stored 13159 string chucks using 0MB
pnml2lts-mc( 0/ 4): Total memory used for chunk indexing: 0MB
pnml2lts-mc( 0/ 4): Est. total memory use: 0.0MB (~8192.0MB paged-in)
ltl formula name PolyORBNT-PT-S10J60-LTLFireability-08
ltl formula formula --ltl=/tmp/ltl_8_
pnml2lts-mc( 0/ 4): Loading model from model.pnml
pnml2lts-mc( 0/ 4): Edge label is id
pnml2lts-mc( 0/ 4): Petri net has 1234 places, 12920 transitions and 116879 arcs
pnml2lts-mc( 0/ 4): Petri net PolyORBNT-PT-S10J60 analyzed
pnml2lts-mc( 0/ 4): There are no safe places
pnml2lts-mc( 0/ 4): Loading Petri net took 2.180 real 3.390 user 1.690 sys
pnml2lts-mc( 0/ 4): LTL layer: formula: /tmp/ltl_8_
pnml2lts-mc( 0/ 4): buchi has 2 states
pnml2lts-mc( 0/ 4): There are 1270 state labels and 1 edge labels
pnml2lts-mc( 0/ 4): State length is 1235, there are 12924 groups
pnml2lts-mc( 0/ 4): Running ufscc using 4 cores
pnml2lts-mc( 0/ 4): Using a tree table with 2^30 elements
pnml2lts-mc( 0/ 4): Successor permutation: dynamic
pnml2lts-mc( 0/ 4): Global bits: 0, count bits: 0, local bits: 0
pnml2lts-mc( 0/ 4):
pnml2lts-mc( 0/ 4): Accepting cycle FOUND at depth ~17!
pnml2lts-mc( 0/ 4):
pnml2lts-mc( 0/ 4):
pnml2lts-mc( 0/ 4): total scc count: 0
pnml2lts-mc( 0/ 4): unique states count: 56
pnml2lts-mc( 0/ 4): unique transitions count: 331
pnml2lts-mc( 0/ 4): - self-loop count: 1
pnml2lts-mc( 0/ 4): - claim dead count: 0
pnml2lts-mc( 0/ 4): - claim found count: 0
pnml2lts-mc( 0/ 4): - claim success count: 59
pnml2lts-mc( 0/ 4): - cum. max stack depth: 59
pnml2lts-mc( 0/ 4):
pnml2lts-mc( 0/ 4): Explored 59 states 368 transitions, fanout: 6.237
pnml2lts-mc( 0/ 4): Total exploration time 0.040 sec (0.040 sec minimum, 0.040 sec on average)
pnml2lts-mc( 0/ 4): States per second: 1475, Transitions per second: 9200
pnml2lts-mc( 0/ 4):
pnml2lts-mc( 0/ 4): Queue width: 12B, total height: 0, memory: 0.00MB
pnml2lts-mc( 0/ 4): Tree memory: 0.0MB, 44.6 B/state, compr.: 0.9%
pnml2lts-mc( 0/ 4): Tree fill ratio (roots/leafs): 0.0%/0.0%
pnml2lts-mc( 0/ 4): Stored 13159 string chucks using 0MB
pnml2lts-mc( 0/ 4): Total memory used for chunk indexing: 0MB
pnml2lts-mc( 0/ 4): Est. total memory use: 0.0MB (~8192.0MB paged-in)
ltl formula name PolyORBNT-PT-S10J60-LTLFireability-09
ltl formula formula --ltl=/tmp/ltl_9_
pnml2lts-mc( 0/ 4): Loading model from model.pnml
pnml2lts-mc( 0/ 4): Edge label is id
pnml2lts-mc( 0/ 4): Petri net has 1234 places, 12920 transitions and 116879 arcs
pnml2lts-mc( 0/ 4): Petri net PolyORBNT-PT-S10J60 analyzed
pnml2lts-mc( 0/ 4): There are no safe places
pnml2lts-mc( 0/ 4): Loading Petri net took 1.980 real 2.760 user 1.730 sys
pnml2lts-mc( 1/ 4): LTL layer: formula: /tmp/ltl_9_
pnml2lts-mc( 0/ 4): Weak Buchi automaton detected, adding non-accepting as progress label.
pnml2lts-mc( 0/ 4): There are 1271 state labels and 1 edge labels
pnml2lts-mc( 0/ 4): State length is 1235, there are 12924 groups
pnml2lts-mc( 0/ 4): Running ufscc using 4 cores
pnml2lts-mc( 0/ 4): Using a tree table with 2^30 elements
pnml2lts-mc( 0/ 4): Successor permutation: dynamic
pnml2lts-mc( 0/ 4): Global bits: 0, count bits: 0, local bits: 0
pnml2lts-mc( 0/ 4):
pnml2lts-mc( 0/ 4): Accepting cycle FOUND at depth ~18!
pnml2lts-mc( 0/ 4):
pnml2lts-mc( 0/ 4):
pnml2lts-mc( 0/ 4): total scc count: 0
pnml2lts-mc( 0/ 4): unique states count: 56
pnml2lts-mc( 0/ 4): unique transitions count: 508
pnml2lts-mc( 0/ 4): - self-loop count: 3
pnml2lts-mc( 0/ 4): - claim dead count: 0
pnml2lts-mc( 0/ 4): - claim found count: 0
pnml2lts-mc( 0/ 4): - claim success count: 64
pnml2lts-mc( 0/ 4): - cum. max stack depth: 64
pnml2lts-mc( 0/ 4):
pnml2lts-mc( 0/ 4): Explored 64 states 559 transitions, fanout: 8.734
pnml2lts-mc( 0/ 4): Total exploration time 0.070 sec (0.060 sec minimum, 0.065 sec on average)
pnml2lts-mc( 0/ 4): States per second: 914, Transitions per second: 7986
pnml2lts-mc( 0/ 4):
pnml2lts-mc( 0/ 4): Queue width: 12B, total height: 0, memory: 0.00MB
pnml2lts-mc( 0/ 4): Tree memory: 0.0MB, 64.0 B/state, compr.: 1.3%
pnml2lts-mc( 0/ 4): Tree fill ratio (roots/leafs): 0.0%/0.0%
pnml2lts-mc( 0/ 4): Stored 13159 string chucks using 0MB
pnml2lts-mc( 0/ 4): Total memory used for chunk indexing: 0MB
pnml2lts-mc( 0/ 4): Est. total memory use: 0.0MB (~8192.0MB paged-in)
ltl formula name PolyORBNT-PT-S10J60-LTLFireability-10
ltl formula formula --ltl=/tmp/ltl_10_
pnml2lts-mc( 0/ 4): Loading model from model.pnml
pnml2lts-mc( 0/ 4): Edge label is id
pnml2lts-mc( 0/ 4): Petri net has 1234 places, 12920 transitions and 116879 arcs
pnml2lts-mc( 0/ 4): Petri net PolyORBNT-PT-S10J60 analyzed
pnml2lts-mc( 0/ 4): There are no safe places
pnml2lts-mc( 0/ 4): Loading Petri net took 2.110 real 3.280 user 1.720 sys
pnml2lts-mc( 0/ 4): LTL layer: formula: /tmp/ltl_10_
pnml2lts-mc( 0/ 4): buchi has 1 states
pnml2lts-mc( 0/ 4): Weak Buchi automaton detected, adding non-accepting as progress label.
pnml2lts-mc( 0/ 4): There are 1271 state labels and 1 edge labels
pnml2lts-mc( 0/ 4): State length is 1235, there are 12921 groups
pnml2lts-mc( 0/ 4): Running ufscc using 4 cores
pnml2lts-mc( 0/ 4): Using a tree table with 2^30 elements
pnml2lts-mc( 0/ 4): Successor permutation: dynamic
pnml2lts-mc( 0/ 4): Global bits: 0, count bits: 0, local bits: 0
pnml2lts-mc( 0/ 4):
pnml2lts-mc( 0/ 4): Accepting cycle FOUND at depth ~15!
pnml2lts-mc( 0/ 4):
pnml2lts-mc( 0/ 4):
pnml2lts-mc( 0/ 4): total scc count: 0
pnml2lts-mc( 0/ 4): unique states count: 54
pnml2lts-mc( 0/ 4): unique transitions count: 313
pnml2lts-mc( 0/ 4): - self-loop count: 1
pnml2lts-mc( 0/ 4): - claim dead count: 0
pnml2lts-mc( 0/ 4): - claim found count: 0
pnml2lts-mc( 0/ 4): - claim success count: 62
pnml2lts-mc( 0/ 4): - cum. max stack depth: 62
pnml2lts-mc( 0/ 4):
pnml2lts-mc( 0/ 4): Explored 62 states 364 transitions, fanout: 5.871
pnml2lts-mc( 0/ 4): Total exploration time 0.040 sec (0.040 sec minimum, 0.040 sec on average)
pnml2lts-mc( 0/ 4): States per second: 1550, Transitions per second: 9100
pnml2lts-mc( 0/ 4):
pnml2lts-mc( 0/ 4): Queue width: 12B, total height: 0, memory: 0.00MB
pnml2lts-mc( 0/ 4): Tree memory: 0.0MB, 44.2 B/state, compr.: 0.9%
pnml2lts-mc( 0/ 4): Tree fill ratio (roots/leafs): 0.0%/0.0%
pnml2lts-mc( 0/ 4): Stored 13159 string chucks using 0MB
pnml2lts-mc( 0/ 4): Total memory used for chunk indexing: 0MB
pnml2lts-mc( 0/ 4): Est. total memory use: 0.0MB (~8192.0MB paged-in)
ltl formula name PolyORBNT-PT-S10J60-LTLFireability-11
ltl formula formula --ltl=/tmp/ltl_11_
pnml2lts-mc( 0/ 4): Loading model from model.pnml
pnml2lts-mc( 0/ 4): Edge label is id
pnml2lts-mc( 0/ 4): Petri net has 1234 places, 12920 transitions and 116879 arcs
pnml2lts-mc( 0/ 4): Petri net PolyORBNT-PT-S10J60 analyzed
pnml2lts-mc( 0/ 4): There are no safe places
pnml2lts-mc( 0/ 4): Loading Petri net took 1.660 real 2.440 user 1.400 sys
pnml2lts-mc( 0/ 4): LTL layer: formula: /tmp/ltl_11_
pnml2lts-mc( 0/ 4): buchi has 3 states
pnml2lts-mc( 0/ 4): Weak Buchi automaton detected, adding non-accepting as progress label.
pnml2lts-mc( 0/ 4): There are 1271 state labels and 1 edge labels
pnml2lts-mc( 0/ 4): State length is 1235, there are 12926 groups
pnml2lts-mc( 0/ 4): Running ufscc using 4 cores
pnml2lts-mc( 0/ 4): Using a tree table with 2^30 elements
pnml2lts-mc( 0/ 4): Successor permutation: dynamic
pnml2lts-mc( 0/ 4): Global bits: 0, count bits: 0, local bits: 0
pnml2lts-mc( 0/ 4):
pnml2lts-mc( 0/ 4): Accepting cycle FOUND at depth ~16!
pnml2lts-mc( 0/ 4):
pnml2lts-mc( 0/ 4):
pnml2lts-mc( 0/ 4): total scc count: 0
pnml2lts-mc( 0/ 4): unique states count: 46
pnml2lts-mc( 0/ 4): unique transitions count: 278
pnml2lts-mc( 0/ 4): - self-loop count: 1
pnml2lts-mc( 0/ 4): - claim dead count: 0
pnml2lts-mc( 0/ 4): - claim found count: 0
pnml2lts-mc( 0/ 4): - claim success count: 49
pnml2lts-mc( 0/ 4): - cum. max stack depth: 49
pnml2lts-mc( 0/ 4):
pnml2lts-mc( 0/ 4): Explored 49 states 315 transitions, fanout: 6.429
pnml2lts-mc( 0/ 4): Total exploration time 0.040 sec (0.040 sec minimum, 0.040 sec on average)
pnml2lts-mc( 0/ 4): States per second: 1225, Transitions per second: 7875
pnml2lts-mc( 0/ 4):
pnml2lts-mc( 0/ 4): Queue width: 12B, total height: 0, memory: 0.00MB
pnml2lts-mc( 0/ 4): Tree memory: 0.0MB, 45.6 B/state, compr.: 0.9%
pnml2lts-mc( 0/ 4): Tree fill ratio (roots/leafs): 0.0%/0.0%
pnml2lts-mc( 0/ 4): Stored 13159 string chucks using 0MB
pnml2lts-mc( 0/ 4): Total memory used for chunk indexing: 0MB
pnml2lts-mc( 0/ 4): Est. total memory use: 0.0MB (~8192.0MB paged-in)
ltl formula name PolyORBNT-PT-S10J60-LTLFireability-12
ltl formula formula --ltl=/tmp/ltl_12_
pnml2lts-mc( 0/ 4): Loading model from model.pnml
pnml2lts-mc( 0/ 4): Edge label is id
pnml2lts-mc( 0/ 4): Petri net has 1234 places, 12920 transitions and 116879 arcs
pnml2lts-mc( 0/ 4): Petri net PolyORBNT-PT-S10J60 analyzed
pnml2lts-mc( 0/ 4): There are no safe places
pnml2lts-mc( 0/ 4): Loading Petri net took 1.510 real 2.450 user 1.290 sys
pnml2lts-mc( 1/ 4): LTL layer: formula: /tmp/ltl_12_
pnml2lts-mc( 0/ 4): Weak Buchi automaton detected, adding non-accepting as progress label.
pnml2lts-mc( 0/ 4): There are 1271 state labels and 1 edge labels
pnml2lts-mc( 0/ 4): State length is 1235, there are 12921 groups
pnml2lts-mc( 0/ 4): Running ufscc using 4 cores
pnml2lts-mc( 0/ 4): Using a tree table with 2^30 elements
pnml2lts-mc( 0/ 4): Successor permutation: dynamic
pnml2lts-mc( 0/ 4): Global bits: 0, count bits: 0, local bits: 0
pnml2lts-mc( 1/ 4):
pnml2lts-mc( 1/ 4): Accepting cycle FOUND at depth ~16!
pnml2lts-mc( 1/ 4):
pnml2lts-mc( 0/ 4):
pnml2lts-mc( 0/ 4): total scc count: 0
pnml2lts-mc( 0/ 4): unique states count: 49
pnml2lts-mc( 0/ 4): unique transitions count: 280
pnml2lts-mc( 0/ 4): - self-loop count: 1
pnml2lts-mc( 0/ 4): - claim dead count: 0
pnml2lts-mc( 0/ 4): - claim found count: 0
pnml2lts-mc( 0/ 4): - claim success count: 55
pnml2lts-mc( 0/ 4): - cum. max stack depth: 55
pnml2lts-mc( 0/ 4):
pnml2lts-mc( 0/ 4): Explored 55 states 328 transitions, fanout: 5.964
pnml2lts-mc( 0/ 4): Total exploration time 0.040 sec (0.040 sec minimum, 0.040 sec on average)
pnml2lts-mc( 0/ 4): States per second: 1375, Transitions per second: 8200
pnml2lts-mc( 0/ 4):
pnml2lts-mc( 0/ 4): Queue width: 12B, total height: 0, memory: 0.00MB
pnml2lts-mc( 0/ 4): Tree memory: 0.0MB, 46.3 B/state, compr.: 0.9%
pnml2lts-mc( 0/ 4): Tree fill ratio (roots/leafs): 0.0%/0.0%
pnml2lts-mc( 0/ 4): Stored 13159 string chucks using 0MB
pnml2lts-mc( 0/ 4): Total memory used for chunk indexing: 0MB
pnml2lts-mc( 0/ 4): Est. total memory use: 0.0MB (~8192.0MB paged-in)
ltl formula name PolyORBNT-PT-S10J60-LTLFireability-13
ltl formula formula --ltl=/tmp/ltl_13_
pnml2lts-mc( 0/ 4): Loading model from model.pnml
pnml2lts-mc( 0/ 4): Edge label is id
pnml2lts-mc( 0/ 4): Petri net has 1234 places, 12920 transitions and 116879 arcs
pnml2lts-mc( 0/ 4): Petri net PolyORBNT-PT-S10J60 analyzed
pnml2lts-mc( 0/ 4): There are no safe places
pnml2lts-mc( 0/ 4): Loading Petri net took 1.560 real 2.640 user 1.210 sys
pnml2lts-mc( 3/ 4): LTL layer: formula: /tmp/ltl_13_
pnml2lts-mc( 0/ 4): Weak Buchi automaton detected, adding non-accepting as progress label.
pnml2lts-mc( 0/ 4): There are 1271 state labels and 1 edge labels
pnml2lts-mc( 0/ 4): State length is 1235, there are 12924 groups
pnml2lts-mc( 0/ 4): Running ufscc using 4 cores
pnml2lts-mc( 0/ 4): Using a tree table with 2^30 elements
pnml2lts-mc( 0/ 4): Successor permutation: dynamic
pnml2lts-mc( 0/ 4): Global bits: 0, count bits: 0, local bits: 0
pnml2lts-mc( 1/ 4):
pnml2lts-mc( 1/ 4): Accepting cycle FOUND at depth ~17!
pnml2lts-mc( 1/ 4):
pnml2lts-mc( 0/ 4):
pnml2lts-mc( 0/ 4): total scc count: 0
pnml2lts-mc( 0/ 4): unique states count: 53
pnml2lts-mc( 0/ 4): unique transitions count: 282
pnml2lts-mc( 0/ 4): - self-loop count: 2
pnml2lts-mc( 0/ 4): - claim dead count: 0
pnml2lts-mc( 0/ 4): - claim found count: 0
pnml2lts-mc( 0/ 4): - claim success count: 56
pnml2lts-mc( 0/ 4): - cum. max stack depth: 56
pnml2lts-mc( 0/ 4):
pnml2lts-mc( 0/ 4): Explored 56 states 319 transitions, fanout: 5.696
pnml2lts-mc( 0/ 4): Total exploration time 0.070 sec (0.050 sec minimum, 0.060 sec on average)
pnml2lts-mc( 0/ 4): States per second: 800, Transitions per second: 4557
pnml2lts-mc( 0/ 4):
pnml2lts-mc( 0/ 4): Queue width: 12B, total height: 0, memory: 0.00MB
pnml2lts-mc( 0/ 4): Tree memory: 0.0MB, 45.7 B/state, compr.: 0.9%
pnml2lts-mc( 0/ 4): Tree fill ratio (roots/leafs): 0.0%/0.0%
pnml2lts-mc( 0/ 4): Stored 13159 string chucks using 0MB
pnml2lts-mc( 0/ 4): Total memory used for chunk indexing: 0MB
pnml2lts-mc( 0/ 4): Est. total memory use: 0.0MB (~8192.0MB paged-in)
ltl formula name PolyORBNT-PT-S10J60-LTLFireability-14
ltl formula formula --ltl=/tmp/ltl_14_
pnml2lts-mc( 0/ 4): Loading model from model.pnml
pnml2lts-mc( 0/ 4): Edge label is id
pnml2lts-mc( 0/ 4): Petri net has 1234 places, 12920 transitions and 116879 arcs
pnml2lts-mc( 0/ 4): Petri net PolyORBNT-PT-S10J60 analyzed
pnml2lts-mc( 0/ 4): There are no safe places
pnml2lts-mc( 0/ 4): Loading Petri net took 3.480 real 3.420 user 2.700 sys
pnml2lts-mc( 0/ 4): LTL layer: formula: /tmp/ltl_14_
pnml2lts-mc( 0/ 4): buchi has 2 states
pnml2lts-mc( 0/ 4): There are 1270 state labels and 1 edge labels
pnml2lts-mc( 0/ 4): State length is 1235, there are 12924 groups
pnml2lts-mc( 0/ 4): Running ufscc using 4 cores
pnml2lts-mc( 0/ 4): Using a tree table with 2^30 elements
pnml2lts-mc( 0/ 4): Successor permutation: dynamic
pnml2lts-mc( 0/ 4): Global bits: 0, count bits: 0, local bits: 0
pnml2lts-mc( 0/ 4):
pnml2lts-mc( 0/ 4): Accepting cycle FOUND at depth ~18!
pnml2lts-mc( 0/ 4):
pnml2lts-mc( 0/ 4):
pnml2lts-mc( 0/ 4): total scc count: 0
pnml2lts-mc( 0/ 4): unique states count: 54
pnml2lts-mc( 0/ 4): unique transitions count: 547
pnml2lts-mc( 0/ 4): - self-loop count: 2
pnml2lts-mc( 0/ 4): - claim dead count: 0
pnml2lts-mc( 0/ 4): - claim found count: 0
pnml2lts-mc( 0/ 4): - claim success count: 65
pnml2lts-mc( 0/ 4): - cum. max stack depth: 65
pnml2lts-mc( 0/ 4):
pnml2lts-mc( 0/ 4): Explored 65 states 610 transitions, fanout: 9.385
pnml2lts-mc( 0/ 4): Total exploration time 0.060 sec (0.040 sec minimum, 0.045 sec on average)
pnml2lts-mc( 0/ 4): States per second: 1083, Transitions per second: 10167
pnml2lts-mc( 0/ 4):
pnml2lts-mc( 0/ 4): Queue width: 12B, total height: 0, memory: 0.00MB
pnml2lts-mc( 0/ 4): Tree memory: 0.0MB, 65.2 B/state, compr.: 1.3%
pnml2lts-mc( 0/ 4): Tree fill ratio (roots/leafs): 0.0%/0.0%
pnml2lts-mc( 0/ 4): Stored 13159 string chucks using 0MB
pnml2lts-mc( 0/ 4): Total memory used for chunk indexing: 0MB
pnml2lts-mc( 0/ 4): Est. total memory use: 0.0MB (~8192.0MB paged-in)
ltl formula name PolyORBNT-PT-S10J60-LTLFireability-15
ltl formula formula --ltl=/tmp/ltl_15_
pnml2lts-mc( 0/ 4): Loading model from model.pnml
pnml2lts-mc( 0/ 4): Edge label is id
pnml2lts-mc( 0/ 4): Petri net has 1234 places, 12920 transitions and 116879 arcs
pnml2lts-mc( 0/ 4): Petri net PolyORBNT-PT-S10J60 analyzed
pnml2lts-mc( 0/ 4): There are no safe places
pnml2lts-mc( 0/ 4): Loading Petri net took 2.040 real 2.980 user 1.590 sys
pnml2lts-mc( 0/ 4): LTL layer: formula: /tmp/ltl_15_
pnml2lts-mc( 0/ 4): buchi has 2 states
pnml2lts-mc( 0/ 4): Weak Buchi automaton detected, adding non-accepting as progress label.
pnml2lts-mc( 0/ 4): There are 1271 state labels and 1 edge labels
pnml2lts-mc( 0/ 4): State length is 1235, there are 12923 groups
pnml2lts-mc( 0/ 4): Running ufscc using 4 cores
pnml2lts-mc( 0/ 4): Using a tree table with 2^30 elements
pnml2lts-mc( 0/ 4): Successor permutation: dynamic
pnml2lts-mc( 0/ 4): Global bits: 0, count bits: 0, local bits: 0
pnml2lts-mc( 0/ 4):
pnml2lts-mc( 0/ 4): Accepting cycle FOUND at depth ~16!
pnml2lts-mc( 0/ 4):
pnml2lts-mc( 0/ 4):
pnml2lts-mc( 0/ 4): total scc count: 0
pnml2lts-mc( 0/ 4): unique states count: 43
pnml2lts-mc( 0/ 4): unique transitions count: 577
pnml2lts-mc( 0/ 4): - self-loop count: 2
pnml2lts-mc( 0/ 4): - claim dead count: 0
pnml2lts-mc( 0/ 4): - claim found count: 0
pnml2lts-mc( 0/ 4): - claim success count: 46
pnml2lts-mc( 0/ 4): - cum. max stack depth: 46
pnml2lts-mc( 0/ 4):
pnml2lts-mc( 0/ 4): Explored 46 states 647 transitions, fanout: 14.065
pnml2lts-mc( 0/ 4): Total exploration time 0.040 sec (0.040 sec minimum, 0.040 sec on average)
pnml2lts-mc( 0/ 4): States per second: 1150, Transitions per second: 16175
pnml2lts-mc( 0/ 4):
pnml2lts-mc( 0/ 4): Queue width: 12B, total height: 0, memory: 0.00MB
pnml2lts-mc( 0/ 4): Tree memory: 0.0MB, 34.2 B/state, compr.: 0.7%
pnml2lts-mc( 0/ 4): Tree fill ratio (roots/leafs): 0.0%/0.0%
pnml2lts-mc( 0/ 4): Stored 13159 string chucks using 0MB
pnml2lts-mc( 0/ 4): Total memory used for chunk indexing: 0MB
pnml2lts-mc( 0/ 4): Est. total memory use: 0.0MB (~8192.0MB paged-in)
Sequence of Actions to be Executed by the VM
This is useful if one wants to reexecute the tool in the VM from the submitted image disk.
set -x
# this is for BenchKit: configuration of major elements for the test
export BK_INPUT="PolyORBNT-PT-S10J60"
export BK_EXAMINATION="LTLFireability"
export BK_TOOL="ltsmin"
export BK_RESULT_DIR="/tmp/BK_RESULTS/OUTPUTS"
export BK_TIME_CONFINEMENT="3600"
export BK_MEMORY_CONFINEMENT="16384"
# this is specific to your benchmark or test
export BIN_DIR="$HOME/BenchKit/bin"
# remove the execution directoty if it exists (to avoid increse of .vmdk images)
if [ -d execution ] ; then
rm -rf execution
fi
tar xzf /home/mcc/BenchKit/INPUTS/PolyORBNT-PT-S10J60.tgz
mv PolyORBNT-PT-S10J60 execution
cd execution
pwd
ls -lh
# this is for BenchKit: explicit launching of the test
echo "====================================================================="
echo " Generated by BenchKit 2-3637"
echo " Executing tool ltsmin"
echo " Input is PolyORBNT-PT-S10J60, examination is LTLFireability"
echo " Time confinement is $BK_TIME_CONFINEMENT seconds"
echo " Memory confinement is 16384 MBytes"
echo " Number of cores is 4"
echo " Run identifier is r209-smll-152732259200462"
echo "====================================================================="
echo
echo "--------------------"
echo "content from stdout:"
echo
echo "=== Data for post analysis generated by BenchKit (invocation template)"
echo
if [ "LTLFireability" = "UpperBounds" ] ; then
echo "The expected result is a vector of positive values"
echo NUM_VECTOR
elif [ "LTLFireability" != "StateSpace" ] ; then
echo "The expected result is a vector of booleans"
echo BOOL_VECTOR
else
echo "no data necessary for post analysis"
fi
echo
if [ -f "LTLFireability.txt" ] ; then
echo "here is the order used to build the result vector(from text file)"
for x in $(grep Property LTLFireability.txt | cut -d ' ' -f 2 | sort -u) ; do
echo "FORMULA_NAME $x"
done
elif [ -f "LTLFireability.xml" ] ; then # for cunf (txt files deleted;-)
echo echo "here is the order used to build the result vector(from xml file)"
for x in $(grep '
echo "FORMULA_NAME $x"
done
fi
echo
echo "=== Now, execution of the tool begins"
echo
echo -n "BK_START "
date -u +%s%3N
echo
timeout -s 9 $BK_TIME_CONFINEMENT bash -c "/home/mcc/BenchKit/BenchKit_head.sh 2> STDERR ; echo ; echo -n \"BK_STOP \" ; date -u +%s%3N"
if [ $? -eq 137 ] ; then
echo
echo "BK_TIME_CONFINEMENT_REACHED"
fi
echo
echo "--------------------"
echo "content from stderr:"
echo
cat STDERR ;