

About the Execution of LTSMin for PolyORBLF-PT-S04J06T10
| Execution Summary | |||||
| Max Memory Used (MB) |
Time wait (ms) | CPU Usage (ms) | I/O Wait (ms) | Computed Result | Execution Status |
| 12002.620 | 490878.00 | 1230378.00 | 519.60 | FFF?FFTTTFT?FTTF | normal |
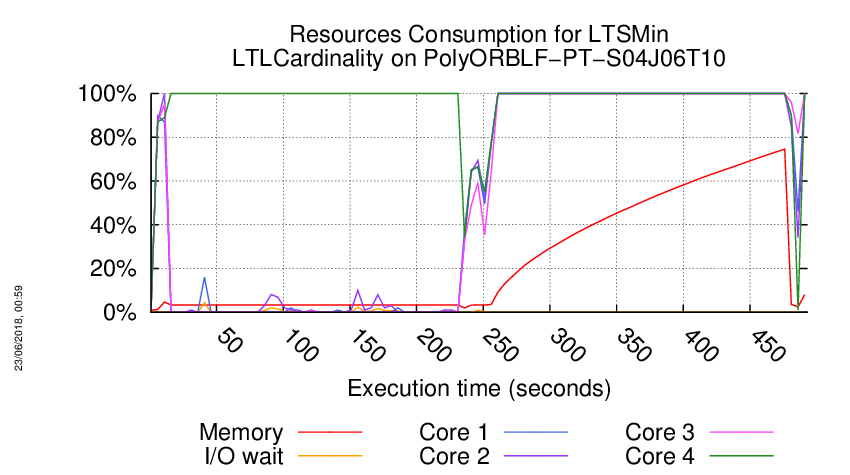
Execution Chart
We display below the execution chart for this examination (boot time has been removed).
Trace from the execution
Waiting for the VM to be ready (probing ssh)
....................
/home/mcc/execution
total 6.9M
-rw-r--r-- 1 mcc users 14K May 15 18:54 CTLCardinality.txt
-rw-r--r-- 1 mcc users 48K May 15 18:54 CTLCardinality.xml
-rw-r--r-- 1 mcc users 75K May 15 18:54 CTLFireability.txt
-rw-r--r-- 1 mcc users 242K May 15 18:54 CTLFireability.xml
-rw-r--r-- 1 mcc users 4.0K May 15 18:50 GenericPropertiesDefinition.xml
-rw-r--r-- 1 mcc users 5.9K May 15 18:50 GenericPropertiesVerdict.xml
-rw-r--r-- 1 mcc users 9.5K May 26 09:27 LTLCardinality.txt
-rw-r--r-- 1 mcc users 26K May 26 09:27 LTLCardinality.xml
-rw-r--r-- 1 mcc users 16K May 26 09:27 LTLFireability.txt
-rw-r--r-- 1 mcc users 53K May 26 09:27 LTLFireability.xml
-rw-r--r-- 1 mcc users 9.7K May 15 18:54 ReachabilityCardinality.txt
-rw-r--r-- 1 mcc users 33K May 15 18:54 ReachabilityCardinality.xml
-rw-r--r-- 1 mcc users 113 May 15 18:54 ReachabilityDeadlock.txt
-rw-r--r-- 1 mcc users 351 May 15 18:54 ReachabilityDeadlock.xml
-rw-r--r-- 1 mcc users 28K May 15 18:54 ReachabilityFireability.txt
-rw-r--r-- 1 mcc users 92K May 15 18:54 ReachabilityFireability.xml
-rw-r--r-- 1 mcc users 3.3K May 15 18:54 UpperBounds.txt
-rw-r--r-- 1 mcc users 6.8K May 15 18:54 UpperBounds.xml
-rw-r--r-- 1 mcc users 5 May 15 18:50 equiv_col
-rw-r--r-- 1 mcc users 10 May 15 18:50 instance
-rw-r--r-- 1 mcc users 6 May 15 18:50 iscolored
-rw-r--r-- 1 mcc users 6.2M May 15 18:50 model.pnml
=====================================================================
Generated by BenchKit 2-3637
Executing tool ltsmin
Input is PolyORBLF-PT-S04J06T10, examination is LTLCardinality
Time confinement is 3600 seconds
Memory confinement is 16384 MBytes
Number of cores is 4
Run identifier is r209-smll-152732259200411
=====================================================================
--------------------
content from stdout:
=== Data for post analysis generated by BenchKit (invocation template)
The expected result is a vector of booleans
BOOL_VECTOR
here is the order used to build the result vector(from text file)
FORMULA_NAME PolyORBLF-PT-S04J06T10-LTLCardinality-00
FORMULA_NAME PolyORBLF-PT-S04J06T10-LTLCardinality-01
FORMULA_NAME PolyORBLF-PT-S04J06T10-LTLCardinality-02
FORMULA_NAME PolyORBLF-PT-S04J06T10-LTLCardinality-03
FORMULA_NAME PolyORBLF-PT-S04J06T10-LTLCardinality-04
FORMULA_NAME PolyORBLF-PT-S04J06T10-LTLCardinality-05
FORMULA_NAME PolyORBLF-PT-S04J06T10-LTLCardinality-06
FORMULA_NAME PolyORBLF-PT-S04J06T10-LTLCardinality-07
FORMULA_NAME PolyORBLF-PT-S04J06T10-LTLCardinality-08
FORMULA_NAME PolyORBLF-PT-S04J06T10-LTLCardinality-09
FORMULA_NAME PolyORBLF-PT-S04J06T10-LTLCardinality-10
FORMULA_NAME PolyORBLF-PT-S04J06T10-LTLCardinality-11
FORMULA_NAME PolyORBLF-PT-S04J06T10-LTLCardinality-12
FORMULA_NAME PolyORBLF-PT-S04J06T10-LTLCardinality-13
FORMULA_NAME PolyORBLF-PT-S04J06T10-LTLCardinality-14
FORMULA_NAME PolyORBLF-PT-S04J06T10-LTLCardinality-15
=== Now, execution of the tool begins
BK_START 1527402282718
FORMULA PolyORBLF-PT-S04J06T10-LTLCardinality-00 FALSE TECHNIQUES EXPLICIT PARALLEL_PROCESSING USE_NUPN
FORMULA PolyORBLF-PT-S04J06T10-LTLCardinality-01 FALSE TECHNIQUES EXPLICIT PARALLEL_PROCESSING USE_NUPN
FORMULA PolyORBLF-PT-S04J06T10-LTLCardinality-02 FALSE TECHNIQUES EXPLICIT PARALLEL_PROCESSING USE_NUPN
FORMULA PolyORBLF-PT-S04J06T10-LTLCardinality-03 CANNOT_COMPUTE
FORMULA PolyORBLF-PT-S04J06T10-LTLCardinality-04 FALSE TECHNIQUES EXPLICIT PARALLEL_PROCESSING USE_NUPN
FORMULA PolyORBLF-PT-S04J06T10-LTLCardinality-05 FALSE TECHNIQUES EXPLICIT PARALLEL_PROCESSING USE_NUPN
FORMULA PolyORBLF-PT-S04J06T10-LTLCardinality-06 TRUE TECHNIQUES EXPLICIT PARALLEL_PROCESSING USE_NUPN
FORMULA PolyORBLF-PT-S04J06T10-LTLCardinality-07 TRUE TECHNIQUES EXPLICIT PARALLEL_PROCESSING USE_NUPN
FORMULA PolyORBLF-PT-S04J06T10-LTLCardinality-08 TRUE TECHNIQUES EXPLICIT PARALLEL_PROCESSING USE_NUPN
FORMULA PolyORBLF-PT-S04J06T10-LTLCardinality-09 FALSE TECHNIQUES EXPLICIT PARALLEL_PROCESSING USE_NUPN
FORMULA PolyORBLF-PT-S04J06T10-LTLCardinality-10 TRUE TECHNIQUES EXPLICIT PARALLEL_PROCESSING USE_NUPN
FORMULA PolyORBLF-PT-S04J06T10-LTLCardinality-11 CANNOT_COMPUTE
FORMULA PolyORBLF-PT-S04J06T10-LTLCardinality-12 FALSE TECHNIQUES EXPLICIT PARALLEL_PROCESSING USE_NUPN
FORMULA PolyORBLF-PT-S04J06T10-LTLCardinality-13 TRUE TECHNIQUES EXPLICIT PARALLEL_PROCESSING USE_NUPN
FORMULA PolyORBLF-PT-S04J06T10-LTLCardinality-14 TRUE TECHNIQUES EXPLICIT PARALLEL_PROCESSING USE_NUPN
FORMULA PolyORBLF-PT-S04J06T10-LTLCardinality-15 FALSE TECHNIQUES EXPLICIT PARALLEL_PROCESSING USE_NUPN
BK_STOP 1527402773596
--------------------
content from stderr:
mcc2018
ltl formula name PolyORBLF-PT-S04J06T10-LTLCardinality-00
ltl formula formula --ltl=/tmp/ltl_0_
pnml2lts-mc( 0/ 4): Loading model from model.pnml
pnml2lts-mc( 0/ 4): Edge label is id
pnml2lts-mc( 0/ 4): Petri net has 966 places, 5354 transitions and 36134 arcs
pnml2lts-mc( 0/ 4): Petri net PolyORBLF-PT-S04J06T10 analyzed
pnml2lts-mc( 0/ 4): There are no safe places
pnml2lts-mc( 0/ 4): Loading Petri net took 1.520 real 1.160 user 1.080 sys
pnml2lts-mc( 0/ 4): LTL layer: formula: /tmp/ltl_0_
pnml2lts-mc( 0/ 4): buchi has 2 states
pnml2lts-mc( 0/ 4): There are 986 state labels and 1 edge labels
pnml2lts-mc( 0/ 4): State length is 967, there are 5358 groups
pnml2lts-mc( 0/ 4): Running ufscc using 4 cores
pnml2lts-mc( 0/ 4): Using a tree table with 2^30 elements
pnml2lts-mc( 0/ 4): Successor permutation: dynamic
pnml2lts-mc( 0/ 4): Global bits: 0, count bits: 0, local bits: 0
pnml2lts-mc( 1/ 4):
pnml2lts-mc( 1/ 4): Accepting cycle FOUND at depth ~398!
pnml2lts-mc( 1/ 4):
pnml2lts-mc( 0/ 4):
pnml2lts-mc( 0/ 4): total scc count: 0
pnml2lts-mc( 0/ 4): unique states count: 1686
pnml2lts-mc( 0/ 4): unique transitions count: 4187
pnml2lts-mc( 0/ 4): - self-loop count: 0
pnml2lts-mc( 0/ 4): - claim dead count: 0
pnml2lts-mc( 0/ 4): - claim found count: 1
pnml2lts-mc( 0/ 4): - claim success count: 1690
pnml2lts-mc( 0/ 4): - cum. max stack depth: 1690
pnml2lts-mc( 0/ 4):
pnml2lts-mc( 0/ 4): Explored 1690 states 4207 transitions, fanout: 2.489
pnml2lts-mc( 0/ 4): Total exploration time 0.520 sec (0.520 sec minimum, 0.520 sec on average)
pnml2lts-mc( 0/ 4): States per second: 3250, Transitions per second: 8090
pnml2lts-mc( 0/ 4):
pnml2lts-mc( 0/ 4): Queue width: 12B, total height: 0, memory: 0.00MB
pnml2lts-mc( 0/ 4): Tree memory: 0.2MB, 50.8 B/state, compr.: 1.3%
pnml2lts-mc( 0/ 4): Tree fill ratio (roots/leafs): 0.0%/0.0%
pnml2lts-mc( 0/ 4): Stored 5469 string chucks using 0MB
pnml2lts-mc( 0/ 4): Total memory used for chunk indexing: 0MB
pnml2lts-mc( 0/ 4): Est. total memory use: 0.2MB (~8192.0MB paged-in)
ltl formula name PolyORBLF-PT-S04J06T10-LTLCardinality-01
ltl formula formula --ltl=/tmp/ltl_1_
pnml2lts-mc( 0/ 4): Loading model from model.pnml
pnml2lts-mc( 0/ 4): Edge label is id
pnml2lts-mc( 0/ 4): Petri net has 966 places, 5354 transitions and 36134 arcs
pnml2lts-mc( 0/ 4): Petri net PolyORBLF-PT-S04J06T10 analyzed
pnml2lts-mc( 0/ 4): There are no safe places
pnml2lts-mc( 0/ 4): Loading Petri net took 0.640 real 0.900 user 0.600 sys
pnml2lts-mc( 1/ 4): LTL layer: formula: /tmp/ltl_1_
pnml2lts-mc( 0/ 4): Weak Buchi automaton detected, adding non-accepting as progress label.
pnml2lts-mc( 0/ 4): There are 987 state labels and 1 edge labels
pnml2lts-mc( 0/ 4): State length is 967, there are 5355 groups
pnml2lts-mc( 0/ 4): Running ufscc using 4 cores
pnml2lts-mc( 0/ 4): Using a tree table with 2^30 elements
pnml2lts-mc( 0/ 4): Successor permutation: dynamic
pnml2lts-mc( 0/ 4): Global bits: 0, count bits: 0, local bits: 0
pnml2lts-mc( 1/ 4):
pnml2lts-mc( 1/ 4): Accepting cycle FOUND at depth ~549!
pnml2lts-mc( 1/ 4):
pnml2lts-mc( 0/ 4):
pnml2lts-mc( 0/ 4): total scc count: 0
pnml2lts-mc( 0/ 4): unique states count: 1729
pnml2lts-mc( 0/ 4): unique transitions count: 4382
pnml2lts-mc( 0/ 4): - self-loop count: 0
pnml2lts-mc( 0/ 4): - claim dead count: 0
pnml2lts-mc( 0/ 4): - claim found count: 1
pnml2lts-mc( 0/ 4): - claim success count: 1736
pnml2lts-mc( 0/ 4): - cum. max stack depth: 1736
pnml2lts-mc( 0/ 4):
pnml2lts-mc( 0/ 4): Explored 1736 states 4411 transitions, fanout: 2.541
pnml2lts-mc( 0/ 4): Total exploration time 0.530 sec (0.530 sec minimum, 0.530 sec on average)
pnml2lts-mc( 0/ 4): States per second: 3275, Transitions per second: 8323
pnml2lts-mc( 0/ 4):
pnml2lts-mc( 0/ 4): Queue width: 12B, total height: 0, memory: 0.00MB
pnml2lts-mc( 0/ 4): Tree memory: 0.2MB, 52.0 B/state, compr.: 1.3%
pnml2lts-mc( 0/ 4): Tree fill ratio (roots/leafs): 0.0%/0.0%
pnml2lts-mc( 0/ 4): Stored 5469 string chucks using 0MB
pnml2lts-mc( 0/ 4): Total memory used for chunk indexing: 0MB
pnml2lts-mc( 0/ 4): Est. total memory use: 0.2MB (~8192.0MB paged-in)
ltl formula name PolyORBLF-PT-S04J06T10-LTLCardinality-02
ltl formula formula --ltl=/tmp/ltl_2_
pnml2lts-mc( 0/ 4): Loading model from model.pnml
pnml2lts-mc( 0/ 4): Edge label is id
pnml2lts-mc( 0/ 4): Petri net has 966 places, 5354 transitions and 36134 arcs
pnml2lts-mc( 0/ 4): Petri net PolyORBLF-PT-S04J06T10 analyzed
pnml2lts-mc( 0/ 4): There are no safe places
pnml2lts-mc( 0/ 4): Loading Petri net took 0.620 real 0.970 user 0.520 sys
pnml2lts-mc( 3/ 4): LTL layer: formula: /tmp/ltl_2_
pnml2lts-mc( 0/ 4): Weak Buchi automaton detected, adding non-accepting as progress label.
pnml2lts-mc( 0/ 4): There are 987 state labels and 1 edge labels
pnml2lts-mc( 0/ 4): State length is 967, there are 5360 groups
pnml2lts-mc( 0/ 4): Running ufscc using 4 cores
pnml2lts-mc( 0/ 4): Using a tree table with 2^30 elements
pnml2lts-mc( 0/ 4): Successor permutation: dynamic
pnml2lts-mc( 0/ 4): Global bits: 0, count bits: 0, local bits: 0
pnml2lts-mc( 1/ 4):
pnml2lts-mc( 1/ 4): Accepting cycle FOUND at depth ~1328!
pnml2lts-mc( 1/ 4):
pnml2lts-mc( 0/ 4):
pnml2lts-mc( 0/ 4): total scc count: 0
pnml2lts-mc( 0/ 4): unique states count: 5589
pnml2lts-mc( 0/ 4): unique transitions count: 15064
pnml2lts-mc( 0/ 4): - self-loop count: 0
pnml2lts-mc( 0/ 4): - claim dead count: 0
pnml2lts-mc( 0/ 4): - claim found count: 1
pnml2lts-mc( 0/ 4): - claim success count: 5593
pnml2lts-mc( 0/ 4): - cum. max stack depth: 5593
pnml2lts-mc( 0/ 4):
pnml2lts-mc( 0/ 4): Explored 5593 states 15084 transitions, fanout: 2.697
pnml2lts-mc( 0/ 4): Total exploration time 1.490 sec (1.480 sec minimum, 1.487 sec on average)
pnml2lts-mc( 0/ 4): States per second: 3754, Transitions per second: 10123
pnml2lts-mc( 0/ 4):
pnml2lts-mc( 0/ 4): Queue width: 12B, total height: 0, memory: 0.00MB
pnml2lts-mc( 0/ 4): Tree memory: 0.6MB, 44.5 B/state, compr.: 1.2%
pnml2lts-mc( 0/ 4): Tree fill ratio (roots/leafs): 0.0%/0.0%
pnml2lts-mc( 0/ 4): Stored 5469 string chucks using 0MB
pnml2lts-mc( 0/ 4): Total memory used for chunk indexing: 0MB
pnml2lts-mc( 0/ 4): Est. total memory use: 0.6MB (~8192.0MB paged-in)
ltl formula name PolyORBLF-PT-S04J06T10-LTLCardinality-03
ltl formula formula --ltl=/tmp/ltl_3_
pnml2lts-mc( 0/ 4): Loading model from model.pnml
pnml2lts-mc( 0/ 4): Edge label is id
pnml2lts-mc( 0/ 4): Petri net has 966 places, 5354 transitions and 36134 arcs
pnml2lts-mc( 0/ 4): Petri net PolyORBLF-PT-S04J06T10 analyzed
pnml2lts-mc( 0/ 4): There are no safe places
pnml2lts-mc( 0/ 4): Loading Petri net took 0.650 real 0.990 user 0.540 sys
pnml2lts-mc( 0/ 4): LTL layer: formula: /tmp/ltl_3_
ltl formula name PolyORBLF-PT-S04J06T10-LTLCardinality-04
ltl formula formula --ltl=/tmp/ltl_4_
pnml2lts-mc( 0/ 4): Loading model from model.pnml
pnml2lts-mc( 0/ 4): Edge label is id
pnml2lts-mc( 0/ 4): Petri net has 966 places, 5354 transitions and 36134 arcs
pnml2lts-mc( 0/ 4): Petri net PolyORBLF-PT-S04J06T10 analyzed
pnml2lts-mc( 0/ 4): There are no safe places
pnml2lts-mc( 0/ 4): Loading Petri net took 0.740 real 0.990 user 0.620 sys
pnml2lts-mc( 0/ 4): LTL layer: formula: /tmp/ltl_4_
pnml2lts-mc( 0/ 4): buchi has 2 states
pnml2lts-mc( 0/ 4): Weak Buchi automaton detected, adding non-accepting as progress label.
pnml2lts-mc( 0/ 4): There are 987 state labels and 1 edge labels
pnml2lts-mc( 0/ 4): State length is 967, there are 5356 groups
pnml2lts-mc( 0/ 4): Running ufscc using 4 cores
pnml2lts-mc( 0/ 4): Using a tree table with 2^30 elements
pnml2lts-mc( 0/ 4): Successor permutation: dynamic
pnml2lts-mc( 0/ 4): Global bits: 0, count bits: 0, local bits: 0
pnml2lts-mc( 2/ 4):
pnml2lts-mc( 2/ 4): Accepting cycle FOUND at depth ~566!
pnml2lts-mc( 2/ 4):
pnml2lts-mc( 0/ 4):
pnml2lts-mc( 0/ 4): total scc count: 0
pnml2lts-mc( 0/ 4): unique states count: 3489
pnml2lts-mc( 0/ 4): unique transitions count: 9731
pnml2lts-mc( 0/ 4): - self-loop count: 0
pnml2lts-mc( 0/ 4): - claim dead count: 0
pnml2lts-mc( 0/ 4): - claim found count: 1
pnml2lts-mc( 0/ 4): - claim success count: 3493
pnml2lts-mc( 0/ 4): - cum. max stack depth: 3493
pnml2lts-mc( 0/ 4):
pnml2lts-mc( 0/ 4): Explored 3493 states 9751 transitions, fanout: 2.792
pnml2lts-mc( 0/ 4): Total exploration time 1.090 sec (1.090 sec minimum, 1.090 sec on average)
pnml2lts-mc( 0/ 4): States per second: 3205, Transitions per second: 8946
pnml2lts-mc( 0/ 4):
pnml2lts-mc( 0/ 4): Queue width: 12B, total height: 0, memory: 0.00MB
pnml2lts-mc( 0/ 4): Tree memory: 0.4MB, 46.3 B/state, compr.: 1.2%
pnml2lts-mc( 0/ 4): Tree fill ratio (roots/leafs): 0.0%/0.0%
pnml2lts-mc( 0/ 4): Stored 5469 string chucks using 0MB
pnml2lts-mc( 0/ 4): Total memory used for chunk indexing: 0MB
pnml2lts-mc( 0/ 4): Est. total memory use: 0.4MB (~8192.0MB paged-in)
ltl formula name PolyORBLF-PT-S04J06T10-LTLCardinality-05
ltl formula formula --ltl=/tmp/ltl_5_
pnml2lts-mc( 0/ 4): Loading model from model.pnml
pnml2lts-mc( 0/ 4): Edge label is id
pnml2lts-mc( 0/ 4): Petri net has 966 places, 5354 transitions and 36134 arcs
pnml2lts-mc( 0/ 4): Petri net PolyORBLF-PT-S04J06T10 analyzed
pnml2lts-mc( 0/ 4): There are no safe places
pnml2lts-mc( 0/ 4): Loading Petri net took 0.640 real 0.890 user 0.560 sys
pnml2lts-mc( 2/ 4): LTL layer: formula: /tmp/ltl_5_
pnml2lts-mc( 0/ 4): Weak Buchi automaton detected, adding non-accepting as progress label.
pnml2lts-mc( 0/ 4): There are 987 state labels and 1 edge labels
pnml2lts-mc( 0/ 4): State length is 967, there are 5361 groups
pnml2lts-mc( 0/ 4): Running ufscc using 4 cores
pnml2lts-mc( 0/ 4): Using a tree table with 2^30 elements
pnml2lts-mc( 0/ 4): Successor permutation: dynamic
pnml2lts-mc( 0/ 4): Global bits: 0, count bits: 0, local bits: 0
pnml2lts-mc( 0/ 4):
pnml2lts-mc( 0/ 4): Accepting cycle FOUND at depth ~675!
pnml2lts-mc( 0/ 4):
pnml2lts-mc( 0/ 4):
pnml2lts-mc( 0/ 4): total scc count: 0
pnml2lts-mc( 0/ 4): unique states count: 2906
pnml2lts-mc( 0/ 4): unique transitions count: 7203
pnml2lts-mc( 0/ 4): - self-loop count: 0
pnml2lts-mc( 0/ 4): - claim dead count: 0
pnml2lts-mc( 0/ 4): - claim found count: 1
pnml2lts-mc( 0/ 4): - claim success count: 2910
pnml2lts-mc( 0/ 4): - cum. max stack depth: 2910
pnml2lts-mc( 0/ 4):
pnml2lts-mc( 0/ 4): Explored 2910 states 7223 transitions, fanout: 2.482
pnml2lts-mc( 0/ 4): Total exploration time 0.830 sec (0.830 sec minimum, 0.830 sec on average)
pnml2lts-mc( 0/ 4): States per second: 3506, Transitions per second: 8702
pnml2lts-mc( 0/ 4):
pnml2lts-mc( 0/ 4): Queue width: 12B, total height: 0, memory: 0.00MB
pnml2lts-mc( 0/ 4): Tree memory: 0.3MB, 47.0 B/state, compr.: 1.2%
pnml2lts-mc( 0/ 4): Tree fill ratio (roots/leafs): 0.0%/0.0%
pnml2lts-mc( 0/ 4): Stored 5469 string chucks using 0MB
pnml2lts-mc( 0/ 4): Total memory used for chunk indexing: 0MB
pnml2lts-mc( 0/ 4): Est. total memory use: 0.3MB (~8192.0MB paged-in)
ltl formula name PolyORBLF-PT-S04J06T10-LTLCardinality-06
ltl formula formula --ltl=/tmp/ltl_6_
pnml2lts-mc( 0/ 4): Loading model from model.pnml
pnml2lts-mc( 0/ 4): Edge label is id
pnml2lts-mc( 0/ 4): Petri net has 966 places, 5354 transitions and 36134 arcs
pnml2lts-mc( 0/ 4): Petri net PolyORBLF-PT-S04J06T10 analyzed
pnml2lts-mc( 0/ 4): There are no safe places
pnml2lts-mc( 0/ 4): Loading Petri net took 0.710 real 1.070 user 0.610 sys
pnml2lts-mc( 0/ 4): LTL layer: formula: /tmp/ltl_6_
pnml2lts-mc( 0/ 4): buchi has 2 states
pnml2lts-mc( 0/ 4): Weak Buchi automaton detected, adding non-accepting as progress label.
pnml2lts-mc( 0/ 4): There are 987 state labels and 1 edge labels
pnml2lts-mc( 0/ 4): State length is 967, there are 5356 groups
pnml2lts-mc( 0/ 4): Running ufscc using 4 cores
pnml2lts-mc( 0/ 4): Using a tree table with 2^30 elements
pnml2lts-mc( 0/ 4): Successor permutation: dynamic
pnml2lts-mc( 0/ 4): Global bits: 0, count bits: 0, local bits: 0
pnml2lts-mc( 0/ 4):
pnml2lts-mc( 0/ 4): total scc count: 1
pnml2lts-mc( 0/ 4): unique states count: 1
pnml2lts-mc( 0/ 4): unique transitions count: 0
pnml2lts-mc( 0/ 4): - self-loop count: 0
pnml2lts-mc( 0/ 4): - claim dead count: 0
pnml2lts-mc( 0/ 4): - claim found count: 0
pnml2lts-mc( 0/ 4): - claim success count: 4
pnml2lts-mc( 0/ 4): - cum. max stack depth: 4
pnml2lts-mc( 0/ 4):
pnml2lts-mc( 0/ 4): Explored 4 states 4 transitions, fanout: 1.000
pnml2lts-mc( 0/ 4): Total exploration time 0.000 sec (0.000 sec minimum, 0.000 sec on average)
pnml2lts-mc( 0/ 4): States per second: inf, Transitions per second: inf
pnml2lts-mc( 0/ 4):
pnml2lts-mc( 0/ 4): Queue width: 12B, total height: 0, memory: 0.00MB
pnml2lts-mc( 0/ 4): Tree memory: 0.0MB, 912.0 B/state, compr.: 23.6%
pnml2lts-mc( 0/ 4): Tree fill ratio (roots/leafs): 0.0%/0.0%
pnml2lts-mc( 0/ 4): Stored 5469 string chucks using 0MB
pnml2lts-mc( 0/ 4): Total memory used for chunk indexing: 0MB
pnml2lts-mc( 0/ 4): Est. total memory use: 0.0MB (~8192.0MB paged-in)
ltl formula name PolyORBLF-PT-S04J06T10-LTLCardinality-07
ltl formula formula --ltl=/tmp/ltl_7_
pnml2lts-mc( 0/ 4): Loading model from model.pnml
pnml2lts-mc( 0/ 4): Edge label is id
pnml2lts-mc( 0/ 4): Petri net has 966 places, 5354 transitions and 36134 arcs
pnml2lts-mc( 0/ 4): Petri net PolyORBLF-PT-S04J06T10 analyzed
pnml2lts-mc( 0/ 4): There are no safe places
pnml2lts-mc( 0/ 4): Loading Petri net took 0.610 real 0.940 user 0.480 sys
pnml2lts-mc( 3/ 4): LTL layer: formula: /tmp/ltl_7_
pnml2lts-mc( 0/ 4): Weak Buchi automaton detected, adding non-accepting as progress label.
pnml2lts-mc( 0/ 4): There are 987 state labels and 1 edge labels
pnml2lts-mc( 0/ 4): State length is 967, there are 5357 groups
pnml2lts-mc( 0/ 4): Running ufscc using 4 cores
pnml2lts-mc( 0/ 4): Using a tree table with 2^30 elements
pnml2lts-mc( 0/ 4): Successor permutation: dynamic
pnml2lts-mc( 0/ 4): Global bits: 0, count bits: 0, local bits: 0
pnml2lts-mc( 0/ 4):
pnml2lts-mc( 0/ 4): total scc count: 5
pnml2lts-mc( 0/ 4): unique states count: 5
pnml2lts-mc( 0/ 4): unique transitions count: 4
pnml2lts-mc( 0/ 4): - self-loop count: 0
pnml2lts-mc( 0/ 4): - claim dead count: 1
pnml2lts-mc( 0/ 4): - claim found count: 0
pnml2lts-mc( 0/ 4): - claim success count: 13
pnml2lts-mc( 0/ 4): - cum. max stack depth: 8
pnml2lts-mc( 0/ 4):
pnml2lts-mc( 0/ 4): Explored 13 states 20 transitions, fanout: 1.538
pnml2lts-mc( 0/ 4): Total exploration time 0.000 sec (0.000 sec minimum, 0.000 sec on average)
pnml2lts-mc( 0/ 4): States per second: inf, Transitions per second: inf
pnml2lts-mc( 0/ 4):
pnml2lts-mc( 0/ 4): Queue width: 12B, total height: 0, memory: 0.00MB
pnml2lts-mc( 0/ 4): Tree memory: 0.0MB, 288.0 B/state, compr.: 7.4%
pnml2lts-mc( 0/ 4): Tree fill ratio (roots/leafs): 0.0%/0.0%
pnml2lts-mc( 0/ 4): Stored 5469 string chucks using 0MB
pnml2lts-mc( 0/ 4): Total memory used for chunk indexing: 0MB
pnml2lts-mc( 0/ 4): Est. total memory use: 0.0MB (~8192.0MB paged-in)
ltl formula name PolyORBLF-PT-S04J06T10-LTLCardinality-08
ltl formula formula --ltl=/tmp/ltl_8_
pnml2lts-mc( 0/ 4): Loading model from model.pnml
pnml2lts-mc( 0/ 4): Edge label is id
pnml2lts-mc( 0/ 4): Petri net has 966 places, 5354 transitions and 36134 arcs
pnml2lts-mc( 0/ 4): Petri net PolyORBLF-PT-S04J06T10 analyzed
pnml2lts-mc( 0/ 4): There are no safe places
pnml2lts-mc( 0/ 4): Loading Petri net took 1.080 real 1.200 user 0.670 sys
pnml2lts-mc( 0/ 4): LTL layer: formula: /tmp/ltl_8_
pnml2lts-mc( 0/ 4): buchi has 2 states
pnml2lts-mc( 0/ 4): Weak Buchi automaton detected, adding non-accepting as progress label.
pnml2lts-mc( 0/ 4): There are 987 state labels and 1 edge labels
pnml2lts-mc( 0/ 4): State length is 967, there are 5356 groups
pnml2lts-mc( 0/ 4): Running ufscc using 4 cores
pnml2lts-mc( 0/ 4): Using a tree table with 2^30 elements
pnml2lts-mc( 0/ 4): Successor permutation: dynamic
pnml2lts-mc( 0/ 4): Global bits: 0, count bits: 0, local bits: 0
pnml2lts-mc( 0/ 4):
pnml2lts-mc( 0/ 4): total scc count: 5
pnml2lts-mc( 0/ 4): unique states count: 5
pnml2lts-mc( 0/ 4): unique transitions count: 4
pnml2lts-mc( 0/ 4): - self-loop count: 0
pnml2lts-mc( 0/ 4): - claim dead count: 3
pnml2lts-mc( 0/ 4): - claim found count: 0
pnml2lts-mc( 0/ 4): - claim success count: 13
pnml2lts-mc( 0/ 4): - cum. max stack depth: 8
pnml2lts-mc( 0/ 4):
pnml2lts-mc( 0/ 4): Explored 13 states 20 transitions, fanout: 1.538
pnml2lts-mc( 0/ 4): Total exploration time 0.010 sec (0.010 sec minimum, 0.010 sec on average)
pnml2lts-mc( 0/ 4): States per second: 1300, Transitions per second: 2000
pnml2lts-mc( 0/ 4):
pnml2lts-mc( 0/ 4): Queue width: 12B, total height: 0, memory: 0.00MB
pnml2lts-mc( 0/ 4): Tree memory: 0.0MB, 288.0 B/state, compr.: 7.4%
pnml2lts-mc( 0/ 4): Tree fill ratio (roots/leafs): 0.0%/0.0%
pnml2lts-mc( 0/ 4): Stored 5469 string chucks using 0MB
pnml2lts-mc( 0/ 4): Total memory used for chunk indexing: 0MB
pnml2lts-mc( 0/ 4): Est. total memory use: 0.0MB (~8192.0MB paged-in)
ltl formula name PolyORBLF-PT-S04J06T10-LTLCardinality-09
ltl formula formula --ltl=/tmp/ltl_9_
pnml2lts-mc( 0/ 4): Loading model from model.pnml
pnml2lts-mc( 0/ 4): Edge label is id
pnml2lts-mc( 0/ 4): Petri net has 966 places, 5354 transitions and 36134 arcs
pnml2lts-mc( 0/ 4): Petri net PolyORBLF-PT-S04J06T10 analyzed
pnml2lts-mc( 0/ 4): There are no safe places
pnml2lts-mc( 0/ 4): Loading Petri net took 0.880 real 0.970 user 0.680 sys
pnml2lts-mc( 1/ 4): LTL layer: formula: /tmp/ltl_9_
pnml2lts-mc( 0/ 4): There are 986 state labels and 1 edge labels
pnml2lts-mc( 0/ 4): State length is 967, there are 5358 groups
pnml2lts-mc( 0/ 4): Running ufscc using 4 cores
pnml2lts-mc( 0/ 4): Using a tree table with 2^30 elements
pnml2lts-mc( 0/ 4): Successor permutation: dynamic
pnml2lts-mc( 0/ 4): Global bits: 0, count bits: 0, local bits: 0
pnml2lts-mc( 1/ 4):
pnml2lts-mc( 1/ 4): Accepting cycle FOUND at depth ~682!
pnml2lts-mc( 1/ 4):
pnml2lts-mc( 0/ 4):
pnml2lts-mc( 0/ 4): total scc count: 0
pnml2lts-mc( 0/ 4): unique states count: 2406
pnml2lts-mc( 0/ 4): unique transitions count: 6120
pnml2lts-mc( 0/ 4): - self-loop count: 0
pnml2lts-mc( 0/ 4): - claim dead count: 0
pnml2lts-mc( 0/ 4): - claim found count: 1
pnml2lts-mc( 0/ 4): - claim success count: 2411
pnml2lts-mc( 0/ 4): - cum. max stack depth: 2411
pnml2lts-mc( 0/ 4):
pnml2lts-mc( 0/ 4): Explored 2411 states 6144 transitions, fanout: 2.548
pnml2lts-mc( 0/ 4): Total exploration time 0.660 sec (0.660 sec minimum, 0.660 sec on average)
pnml2lts-mc( 0/ 4): States per second: 3653, Transitions per second: 9309
pnml2lts-mc( 0/ 4):
pnml2lts-mc( 0/ 4): Queue width: 12B, total height: 0, memory: 0.00MB
pnml2lts-mc( 0/ 4): Tree memory: 0.3MB, 50.1 B/state, compr.: 1.3%
pnml2lts-mc( 0/ 4): Tree fill ratio (roots/leafs): 0.0%/0.0%
pnml2lts-mc( 0/ 4): Stored 5469 string chucks using 0MB
pnml2lts-mc( 0/ 4): Total memory used for chunk indexing: 0MB
pnml2lts-mc( 0/ 4): Est. total memory use: 0.3MB (~8192.0MB paged-in)
ltl formula name PolyORBLF-PT-S04J06T10-LTLCardinality-10
ltl formula formula --ltl=/tmp/ltl_10_
pnml2lts-mc( 0/ 4): Loading model from model.pnml
pnml2lts-mc( 0/ 4): Edge label is id
pnml2lts-mc( 0/ 4): Petri net has 966 places, 5354 transitions and 36134 arcs
pnml2lts-mc( 0/ 4): Petri net PolyORBLF-PT-S04J06T10 analyzed
pnml2lts-mc( 0/ 4): There are no safe places
pnml2lts-mc( 0/ 4): Loading Petri net took 0.620 real 0.880 user 0.540 sys
pnml2lts-mc( 3/ 4): LTL layer: formula: /tmp/ltl_10_
pnml2lts-mc( 0/ 4): Weak Buchi automaton detected, adding non-accepting as progress label.
pnml2lts-mc( 0/ 4): There are 987 state labels and 1 edge labels
pnml2lts-mc( 0/ 4): State length is 967, there are 5356 groups
pnml2lts-mc( 0/ 4): Running ufscc using 4 cores
pnml2lts-mc( 0/ 4): Using a tree table with 2^30 elements
pnml2lts-mc( 0/ 4): Successor permutation: dynamic
pnml2lts-mc( 0/ 4): Global bits: 0, count bits: 0, local bits: 0
pnml2lts-mc( 0/ 4):
pnml2lts-mc( 0/ 4): total scc count: 1
pnml2lts-mc( 0/ 4): unique states count: 1
pnml2lts-mc( 0/ 4): unique transitions count: 0
pnml2lts-mc( 0/ 4): - self-loop count: 0
pnml2lts-mc( 0/ 4): - claim dead count: 0
pnml2lts-mc( 0/ 4): - claim found count: 0
pnml2lts-mc( 0/ 4): - claim success count: 4
pnml2lts-mc( 0/ 4): - cum. max stack depth: 4
pnml2lts-mc( 0/ 4):
pnml2lts-mc( 0/ 4): Explored 4 states 4 transitions, fanout: 1.000
pnml2lts-mc( 0/ 4): Total exploration time 0.000 sec (0.000 sec minimum, 0.000 sec on average)
pnml2lts-mc( 0/ 4): States per second: inf, Transitions per second: inf
pnml2lts-mc( 0/ 4):
pnml2lts-mc( 0/ 4): Queue width: 12B, total height: 0, memory: 0.00MB
pnml2lts-mc( 0/ 4): Tree memory: 0.0MB, 912.0 B/state, compr.: 23.6%
pnml2lts-mc( 0/ 4): Tree fill ratio (roots/leafs): 0.0%/0.0%
pnml2lts-mc( 0/ 4): Stored 5469 string chucks using 0MB
pnml2lts-mc( 0/ 4): Total memory used for chunk indexing: 0MB
pnml2lts-mc( 0/ 4): Est. total memory use: 0.0MB (~8192.0MB paged-in)
ltl formula name PolyORBLF-PT-S04J06T10-LTLCardinality-11
ltl formula formula --ltl=/tmp/ltl_11_
pnml2lts-mc( 0/ 4): Loading model from model.pnml
pnml2lts-mc( 0/ 4): Edge label is id
pnml2lts-mc( 0/ 4): Petri net has 966 places, 5354 transitions and 36134 arcs
pnml2lts-mc( 0/ 4): Petri net PolyORBLF-PT-S04J06T10 analyzed
pnml2lts-mc( 0/ 4): There are no safe places
pnml2lts-mc( 0/ 4): Loading Petri net took 0.790 real 1.110 user 0.730 sys
pnml2lts-mc( 0/ 4): LTL layer: formula: /tmp/ltl_11_
pnml2lts-mc( 0/ 4): buchi has 2 states
pnml2lts-mc( 0/ 4): Weak Buchi automaton detected, adding non-accepting as progress label.
pnml2lts-mc( 0/ 4): There are 987 state labels and 1 edge labels
pnml2lts-mc( 0/ 4): State length is 967, there are 5357 groups
pnml2lts-mc( 0/ 4): Running ufscc using 4 cores
pnml2lts-mc( 0/ 4): Using a tree table with 2^30 elements
pnml2lts-mc( 0/ 4): Successor permutation: dynamic
pnml2lts-mc( 0/ 4): Global bits: 0, count bits: 0, local bits: 0
pnml2lts-mc( 0/ 4): ~2464 levels ~10000 states ~22520 transitions
pnml2lts-mc( 0/ 4): ~4964 levels ~20000 states ~43960 transitions
pnml2lts-mc( 0/ 4): ~9922 levels ~40000 states ~88460 transitions
pnml2lts-mc( 0/ 4): ~19006 levels ~80000 states ~159624 transitions
pnml2lts-mc( 0/ 4): ~37810 levels ~160000 states ~319852 transitions
pnml2lts-mc( 0/ 4): ~75237 levels ~320000 states ~639988 transitions
pnml2lts-mc( 0/ 4): ~137036 levels ~640000 states ~1235876 transitions
ltl formula name PolyORBLF-PT-S04J06T10-LTLCardinality-12
ltl formula formula --ltl=/tmp/ltl_12_
pnml2lts-mc( 0/ 4): Loading model from model.pnml
pnml2lts-mc( 0/ 4): Edge label is id
pnml2lts-mc( 0/ 4): Petri net has 966 places, 5354 transitions and 36134 arcs
pnml2lts-mc( 0/ 4): Petri net PolyORBLF-PT-S04J06T10 analyzed
pnml2lts-mc( 0/ 4): There are no safe places
pnml2lts-mc( 0/ 4): Loading Petri net took 0.630 real 0.960 user 0.520 sys
pnml2lts-mc( 3/ 4): LTL layer: formula: /tmp/ltl_12_
pnml2lts-mc( 0/ 4): Weak Buchi automaton detected, adding non-accepting as progress label.
pnml2lts-mc( 0/ 4): There are 987 state labels and 1 edge labels
pnml2lts-mc( 0/ 4): State length is 967, there are 5357 groups
pnml2lts-mc( 0/ 4): Running ufscc using 4 cores
pnml2lts-mc( 0/ 4): Using a tree table with 2^30 elements
pnml2lts-mc( 0/ 4): Successor permutation: dynamic
pnml2lts-mc( 0/ 4): Global bits: 0, count bits: 0, local bits: 0
pnml2lts-mc( 2/ 4):
pnml2lts-mc( 2/ 4): Accepting cycle FOUND at depth ~572!
pnml2lts-mc( 2/ 4):
pnml2lts-mc( 0/ 4):
pnml2lts-mc( 0/ 4): total scc count: 52
pnml2lts-mc( 0/ 4): unique states count: 2329
pnml2lts-mc( 0/ 4): unique transitions count: 5555
pnml2lts-mc( 0/ 4): - self-loop count: 0
pnml2lts-mc( 0/ 4): - claim dead count: 0
pnml2lts-mc( 0/ 4): - claim found count: 1
pnml2lts-mc( 0/ 4): - claim success count: 2336
pnml2lts-mc( 0/ 4): - cum. max stack depth: 2284
pnml2lts-mc( 0/ 4):
pnml2lts-mc( 0/ 4): Explored 2336 states 5584 transitions, fanout: 2.390
pnml2lts-mc( 0/ 4): Total exploration time 0.680 sec (0.680 sec minimum, 0.680 sec on average)
pnml2lts-mc( 0/ 4): States per second: 3435, Transitions per second: 8212
pnml2lts-mc( 0/ 4):
pnml2lts-mc( 0/ 4): Queue width: 12B, total height: 0, memory: 0.00MB
pnml2lts-mc( 0/ 4): Tree memory: 0.3MB, 52.9 B/state, compr.: 1.4%
pnml2lts-mc( 0/ 4): Tree fill ratio (roots/leafs): 0.0%/0.0%
pnml2lts-mc( 0/ 4): Stored 5469 string chucks using 0MB
pnml2lts-mc( 0/ 4): Total memory used for chunk indexing: 0MB
pnml2lts-mc( 0/ 4): Est. total memory use: 0.3MB (~8192.0MB paged-in)
ltl formula name PolyORBLF-PT-S04J06T10-LTLCardinality-13
ltl formula formula --ltl=/tmp/ltl_13_
pnml2lts-mc( 0/ 4): Loading model from model.pnml
pnml2lts-mc( 0/ 4): Edge label is id
pnml2lts-mc( 0/ 4): Petri net has 966 places, 5354 transitions and 36134 arcs
pnml2lts-mc( 0/ 4): Petri net PolyORBLF-PT-S04J06T10 analyzed
pnml2lts-mc( 0/ 4): There are no safe places
pnml2lts-mc( 0/ 4): Loading Petri net took 0.620 real 0.810 user 0.600 sys
pnml2lts-mc( 1/ 4): LTL layer: formula: /tmp/ltl_13_
pnml2lts-mc( 0/ 4): Weak Buchi automaton detected, adding non-accepting as progress label.
pnml2lts-mc( 0/ 4): There are 987 state labels and 1 edge labels
pnml2lts-mc( 0/ 4): State length is 967, there are 5357 groups
pnml2lts-mc( 0/ 4): Running ufscc using 4 cores
pnml2lts-mc( 0/ 4): Using a tree table with 2^30 elements
pnml2lts-mc( 0/ 4): Successor permutation: dynamic
pnml2lts-mc( 0/ 4): Global bits: 0, count bits: 0, local bits: 0
pnml2lts-mc( 0/ 4):
pnml2lts-mc( 0/ 4): total scc count: 5
pnml2lts-mc( 0/ 4): unique states count: 5
pnml2lts-mc( 0/ 4): unique transitions count: 4
pnml2lts-mc( 0/ 4): - self-loop count: 0
pnml2lts-mc( 0/ 4): - claim dead count: 4
pnml2lts-mc( 0/ 4): - claim found count: 0
pnml2lts-mc( 0/ 4): - claim success count: 15
pnml2lts-mc( 0/ 4): - cum. max stack depth: 8
pnml2lts-mc( 0/ 4):
pnml2lts-mc( 0/ 4): Explored 15 states 20 transitions, fanout: 1.333
pnml2lts-mc( 0/ 4): Total exploration time 0.000 sec (0.000 sec minimum, 0.000 sec on average)
pnml2lts-mc( 0/ 4): States per second: inf, Transitions per second: inf
pnml2lts-mc( 0/ 4):
pnml2lts-mc( 0/ 4): Queue width: 12B, total height: 0, memory: 0.00MB
pnml2lts-mc( 0/ 4): Tree memory: 0.0MB, 288.0 B/state, compr.: 7.4%
pnml2lts-mc( 0/ 4): Tree fill ratio (roots/leafs): 0.0%/0.0%
pnml2lts-mc( 0/ 4): Stored 5469 string chucks using 0MB
pnml2lts-mc( 0/ 4): Total memory used for chunk indexing: 0MB
pnml2lts-mc( 0/ 4): Est. total memory use: 0.0MB (~8192.0MB paged-in)
ltl formula name PolyORBLF-PT-S04J06T10-LTLCardinality-14
ltl formula formula --ltl=/tmp/ltl_14_
pnml2lts-mc( 0/ 4): Loading model from model.pnml
pnml2lts-mc( 0/ 4): Edge label is id
pnml2lts-mc( 0/ 4): Petri net has 966 places, 5354 transitions and 36134 arcs
pnml2lts-mc( 0/ 4): Petri net PolyORBLF-PT-S04J06T10 analyzed
pnml2lts-mc( 0/ 4): There are no safe places
pnml2lts-mc( 0/ 4): Loading Petri net took 0.630 real 0.940 user 0.510 sys
pnml2lts-mc( 1/ 4): LTL layer: formula: /tmp/ltl_14_
pnml2lts-mc( 0/ 4): Weak Buchi automaton detected, adding non-accepting as progress label.
pnml2lts-mc( 0/ 4): There are 987 state labels and 1 edge labels
pnml2lts-mc( 0/ 4): State length is 967, there are 5355 groups
pnml2lts-mc( 0/ 4): Running ufscc using 4 cores
pnml2lts-mc( 0/ 4): Using a tree table with 2^30 elements
pnml2lts-mc( 0/ 4): Successor permutation: dynamic
pnml2lts-mc( 0/ 4): Global bits: 0, count bits: 0, local bits: 0
pnml2lts-mc( 0/ 4):
pnml2lts-mc( 0/ 4): total scc count: 1
pnml2lts-mc( 0/ 4): unique states count: 1
pnml2lts-mc( 0/ 4): unique transitions count: 0
pnml2lts-mc( 0/ 4): - self-loop count: 0
pnml2lts-mc( 0/ 4): - claim dead count: 0
pnml2lts-mc( 0/ 4): - claim found count: 0
pnml2lts-mc( 0/ 4): - claim success count: 4
pnml2lts-mc( 0/ 4): - cum. max stack depth: 4
pnml2lts-mc( 0/ 4):
pnml2lts-mc( 0/ 4): Explored 4 states 4 transitions, fanout: 1.000
pnml2lts-mc( 0/ 4): Total exploration time 0.010 sec (0.010 sec minimum, 0.010 sec on average)
pnml2lts-mc( 0/ 4): States per second: 400, Transitions per second: 400
pnml2lts-mc( 0/ 4):
pnml2lts-mc( 0/ 4): Queue width: 12B, total height: 0, memory: 0.00MB
pnml2lts-mc( 0/ 4): Tree memory: 0.0MB, 912.0 B/state, compr.: 23.6%
pnml2lts-mc( 0/ 4): Tree fill ratio (roots/leafs): 0.0%/0.0%
pnml2lts-mc( 0/ 4): Stored 5469 string chucks using 0MB
pnml2lts-mc( 0/ 4): Total memory used for chunk indexing: 0MB
pnml2lts-mc( 0/ 4): Est. total memory use: 0.0MB (~8192.0MB paged-in)
ltl formula name PolyORBLF-PT-S04J06T10-LTLCardinality-15
ltl formula formula --ltl=/tmp/ltl_15_
pnml2lts-mc( 0/ 4): Loading model from model.pnml
pnml2lts-mc( 0/ 4): Edge label is id
pnml2lts-mc( 0/ 4): Petri net has 966 places, 5354 transitions and 36134 arcs
pnml2lts-mc( 0/ 4): Petri net PolyORBLF-PT-S04J06T10 analyzed
pnml2lts-mc( 0/ 4): There are no safe places
pnml2lts-mc( 0/ 4): Loading Petri net took 0.610 real 0.920 user 0.560 sys
pnml2lts-mc( 2/ 4): LTL layer: formula: /tmp/ltl_15_
pnml2lts-mc( 0/ 4): There are 986 state labels and 1 edge labels
pnml2lts-mc( 0/ 4): State length is 967, there are 5358 groups
pnml2lts-mc( 0/ 4): Running ufscc using 4 cores
pnml2lts-mc( 0/ 4): Using a tree table with 2^30 elements
pnml2lts-mc( 0/ 4): Successor permutation: dynamic
pnml2lts-mc( 0/ 4): Global bits: 0, count bits: 0, local bits: 0
pnml2lts-mc( 2/ 4): ~2484 levels ~10000 states ~23900 transitions
pnml2lts-mc( 2/ 4): ~4673 levels ~20000 states ~43536 transitions
pnml2lts-mc( 3/ 4):
pnml2lts-mc( 3/ 4): Accepting cycle FOUND at depth ~4807!
pnml2lts-mc( 3/ 4):
pnml2lts-mc( 0/ 4):
pnml2lts-mc( 0/ 4): total scc count: 83
pnml2lts-mc( 0/ 4): unique states count: 19799
pnml2lts-mc( 0/ 4): unique transitions count: 46962
pnml2lts-mc( 0/ 4): - self-loop count: 5
pnml2lts-mc( 0/ 4): - claim dead count: 11
pnml2lts-mc( 0/ 4): - claim found count: 736
pnml2lts-mc( 0/ 4): - claim success count: 19809
pnml2lts-mc( 0/ 4): - cum. max stack depth: 19209
pnml2lts-mc( 0/ 4):
pnml2lts-mc( 0/ 4): Explored 19809 states 46994 transitions, fanout: 2.372
pnml2lts-mc( 0/ 4): Total exploration time 4.410 sec (4.410 sec minimum, 4.410 sec on average)
pnml2lts-mc( 0/ 4): States per second: 4492, Transitions per second: 10656
pnml2lts-mc( 0/ 4):
pnml2lts-mc( 0/ 4): Queue width: 12B, total height: 0, memory: 0.00MB
pnml2lts-mc( 0/ 4): Tree memory: 1.5MB, 35.9 B/state, compr.: 0.9%
pnml2lts-mc( 0/ 4): Tree fill ratio (roots/leafs): 0.0%/0.0%
pnml2lts-mc( 0/ 4): Stored 5469 string chucks using 0MB
pnml2lts-mc( 0/ 4): Total memory used for chunk indexing: 0MB
pnml2lts-mc( 0/ 4): Est. total memory use: 1.5MB (~8192.0MB paged-in)
Sequence of Actions to be Executed by the VM
This is useful if one wants to reexecute the tool in the VM from the submitted image disk.
set -x
# this is for BenchKit: configuration of major elements for the test
export BK_INPUT="PolyORBLF-PT-S04J06T10"
export BK_EXAMINATION="LTLCardinality"
export BK_TOOL="ltsmin"
export BK_RESULT_DIR="/tmp/BK_RESULTS/OUTPUTS"
export BK_TIME_CONFINEMENT="3600"
export BK_MEMORY_CONFINEMENT="16384"
# this is specific to your benchmark or test
export BIN_DIR="$HOME/BenchKit/bin"
# remove the execution directoty if it exists (to avoid increse of .vmdk images)
if [ -d execution ] ; then
rm -rf execution
fi
tar xzf /home/mcc/BenchKit/INPUTS/PolyORBLF-PT-S04J06T10.tgz
mv PolyORBLF-PT-S04J06T10 execution
cd execution
pwd
ls -lh
# this is for BenchKit: explicit launching of the test
echo "====================================================================="
echo " Generated by BenchKit 2-3637"
echo " Executing tool ltsmin"
echo " Input is PolyORBLF-PT-S04J06T10, examination is LTLCardinality"
echo " Time confinement is $BK_TIME_CONFINEMENT seconds"
echo " Memory confinement is 16384 MBytes"
echo " Number of cores is 4"
echo " Run identifier is r209-smll-152732259200411"
echo "====================================================================="
echo
echo "--------------------"
echo "content from stdout:"
echo
echo "=== Data for post analysis generated by BenchKit (invocation template)"
echo
if [ "LTLCardinality" = "UpperBounds" ] ; then
echo "The expected result is a vector of positive values"
echo NUM_VECTOR
elif [ "LTLCardinality" != "StateSpace" ] ; then
echo "The expected result is a vector of booleans"
echo BOOL_VECTOR
else
echo "no data necessary for post analysis"
fi
echo
if [ -f "LTLCardinality.txt" ] ; then
echo "here is the order used to build the result vector(from text file)"
for x in $(grep Property LTLCardinality.txt | cut -d ' ' -f 2 | sort -u) ; do
echo "FORMULA_NAME $x"
done
elif [ -f "LTLCardinality.xml" ] ; then # for cunf (txt files deleted;-)
echo echo "here is the order used to build the result vector(from xml file)"
for x in $(grep '
echo "FORMULA_NAME $x"
done
fi
echo
echo "=== Now, execution of the tool begins"
echo
echo -n "BK_START "
date -u +%s%3N
echo
timeout -s 9 $BK_TIME_CONFINEMENT bash -c "/home/mcc/BenchKit/BenchKit_head.sh 2> STDERR ; echo ; echo -n \"BK_STOP \" ; date -u +%s%3N"
if [ $? -eq 137 ] ; then
echo
echo "BK_TIME_CONFINEMENT_REACHED"
fi
echo
echo "--------------------"
echo "content from stderr:"
echo
cat STDERR ;