

About the Execution of LTSMin for PolyORBLF-PT-S04J04T10
| Execution Summary | |||||
| Max Memory Used (MB) |
Time wait (ms) | CPU Usage (ms) | I/O Wait (ms) | Computed Result | Execution Status |
| 1488.480 | 1143249.00 | 1204698.00 | 2186.20 | ??F?F??FFFFFFFFF | normal |
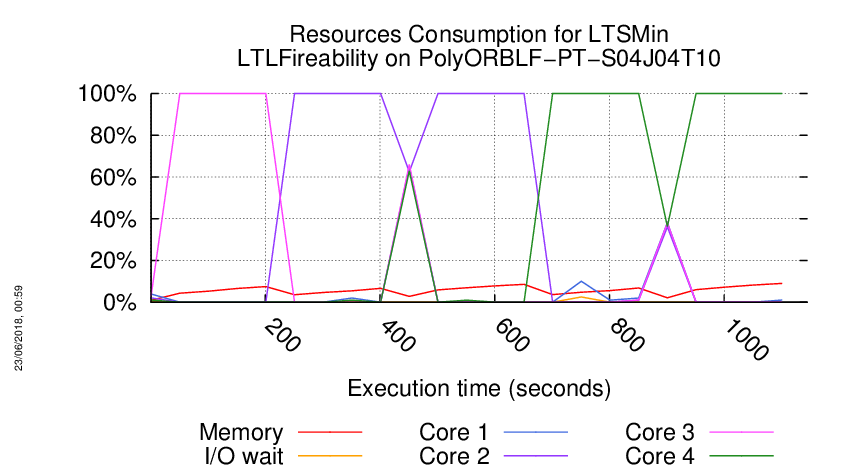
Execution Chart
We display below the execution chart for this examination (boot time has been removed).
Trace from the execution
Waiting for the VM to be ready (probing ssh)
......................
/home/mcc/execution
total 6.4M
-rw-r--r-- 1 mcc users 8.8K May 15 18:54 CTLCardinality.txt
-rw-r--r-- 1 mcc users 30K May 15 18:54 CTLCardinality.xml
-rw-r--r-- 1 mcc users 9.9K May 15 18:54 CTLFireability.txt
-rw-r--r-- 1 mcc users 41K May 15 18:54 CTLFireability.xml
-rw-r--r-- 1 mcc users 4.0K May 15 18:50 GenericPropertiesDefinition.xml
-rw-r--r-- 1 mcc users 5.9K May 15 18:50 GenericPropertiesVerdict.xml
-rw-r--r-- 1 mcc users 5.3K May 26 09:27 LTLCardinality.txt
-rw-r--r-- 1 mcc users 18K May 26 09:27 LTLCardinality.xml
-rw-r--r-- 1 mcc users 6.2K May 26 09:27 LTLFireability.txt
-rw-r--r-- 1 mcc users 23K May 26 09:27 LTLFireability.xml
-rw-r--r-- 1 mcc users 8.3K May 15 18:54 ReachabilityCardinality.txt
-rw-r--r-- 1 mcc users 27K May 15 18:54 ReachabilityCardinality.xml
-rw-r--r-- 1 mcc users 113 May 15 18:54 ReachabilityDeadlock.txt
-rw-r--r-- 1 mcc users 351 May 15 18:54 ReachabilityDeadlock.xml
-rw-r--r-- 1 mcc users 29K May 15 18:54 ReachabilityFireability.txt
-rw-r--r-- 1 mcc users 102K May 15 18:54 ReachabilityFireability.xml
-rw-r--r-- 1 mcc users 3.7K May 15 18:54 UpperBounds.txt
-rw-r--r-- 1 mcc users 7.4K May 15 18:54 UpperBounds.xml
-rw-r--r-- 1 mcc users 5 May 15 18:50 equiv_col
-rw-r--r-- 1 mcc users 10 May 15 18:50 instance
-rw-r--r-- 1 mcc users 6 May 15 18:50 iscolored
-rw-r--r-- 1 mcc users 6.0M May 15 18:50 model.pnml
=====================================================================
Generated by BenchKit 2-3637
Executing tool ltsmin
Input is PolyORBLF-PT-S04J04T10, examination is LTLFireability
Time confinement is 3600 seconds
Memory confinement is 16384 MBytes
Number of cores is 4
Run identifier is r209-smll-152732259200406
=====================================================================
--------------------
content from stdout:
=== Data for post analysis generated by BenchKit (invocation template)
The expected result is a vector of booleans
BOOL_VECTOR
here is the order used to build the result vector(from text file)
FORMULA_NAME PolyORBLF-PT-S04J04T10-LTLFireability-00
FORMULA_NAME PolyORBLF-PT-S04J04T10-LTLFireability-01
FORMULA_NAME PolyORBLF-PT-S04J04T10-LTLFireability-02
FORMULA_NAME PolyORBLF-PT-S04J04T10-LTLFireability-03
FORMULA_NAME PolyORBLF-PT-S04J04T10-LTLFireability-04
FORMULA_NAME PolyORBLF-PT-S04J04T10-LTLFireability-05
FORMULA_NAME PolyORBLF-PT-S04J04T10-LTLFireability-06
FORMULA_NAME PolyORBLF-PT-S04J04T10-LTLFireability-07
FORMULA_NAME PolyORBLF-PT-S04J04T10-LTLFireability-08
FORMULA_NAME PolyORBLF-PT-S04J04T10-LTLFireability-09
FORMULA_NAME PolyORBLF-PT-S04J04T10-LTLFireability-10
FORMULA_NAME PolyORBLF-PT-S04J04T10-LTLFireability-11
FORMULA_NAME PolyORBLF-PT-S04J04T10-LTLFireability-12
FORMULA_NAME PolyORBLF-PT-S04J04T10-LTLFireability-13
FORMULA_NAME PolyORBLF-PT-S04J04T10-LTLFireability-14
FORMULA_NAME PolyORBLF-PT-S04J04T10-LTLFireability-15
=== Now, execution of the tool begins
BK_START 1527400167979
FORMULA PolyORBLF-PT-S04J04T10-LTLFireability-00 CANNOT_COMPUTE
FORMULA PolyORBLF-PT-S04J04T10-LTLFireability-01 CANNOT_COMPUTE
FORMULA PolyORBLF-PT-S04J04T10-LTLFireability-02 FALSE TECHNIQUES EXPLICIT PARALLEL_PROCESSING USE_NUPN
FORMULA PolyORBLF-PT-S04J04T10-LTLFireability-03 CANNOT_COMPUTE
FORMULA PolyORBLF-PT-S04J04T10-LTLFireability-04 FALSE TECHNIQUES EXPLICIT PARALLEL_PROCESSING USE_NUPN
FORMULA PolyORBLF-PT-S04J04T10-LTLFireability-05 CANNOT_COMPUTE
FORMULA PolyORBLF-PT-S04J04T10-LTLFireability-06 CANNOT_COMPUTE
FORMULA PolyORBLF-PT-S04J04T10-LTLFireability-07 FALSE TECHNIQUES EXPLICIT PARALLEL_PROCESSING USE_NUPN
FORMULA PolyORBLF-PT-S04J04T10-LTLFireability-08 FALSE TECHNIQUES EXPLICIT PARALLEL_PROCESSING USE_NUPN
FORMULA PolyORBLF-PT-S04J04T10-LTLFireability-09 FALSE TECHNIQUES EXPLICIT PARALLEL_PROCESSING USE_NUPN
FORMULA PolyORBLF-PT-S04J04T10-LTLFireability-10 FALSE TECHNIQUES EXPLICIT PARALLEL_PROCESSING USE_NUPN
FORMULA PolyORBLF-PT-S04J04T10-LTLFireability-11 FALSE TECHNIQUES EXPLICIT PARALLEL_PROCESSING USE_NUPN
FORMULA PolyORBLF-PT-S04J04T10-LTLFireability-12 FALSE TECHNIQUES EXPLICIT PARALLEL_PROCESSING USE_NUPN
FORMULA PolyORBLF-PT-S04J04T10-LTLFireability-13 FALSE TECHNIQUES EXPLICIT PARALLEL_PROCESSING USE_NUPN
FORMULA PolyORBLF-PT-S04J04T10-LTLFireability-14 FALSE TECHNIQUES EXPLICIT PARALLEL_PROCESSING USE_NUPN
FORMULA PolyORBLF-PT-S04J04T10-LTLFireability-15 FALSE TECHNIQUES EXPLICIT PARALLEL_PROCESSING USE_NUPN
BK_STOP 1527401311228
--------------------
content from stderr:
mcc2018
ltl formula name PolyORBLF-PT-S04J04T10-LTLFireability-00
ltl formula formula --ltl=/tmp/ltl_0_
pnml2lts-mc( 0/ 4): Loading model from model.pnml
pnml2lts-mc( 0/ 4): Edge label is id
pnml2lts-mc( 0/ 4): Petri net has 870 places, 5034 transitions and 34774 arcs
pnml2lts-mc( 0/ 4): Petri net PolyORBLF-PT-S04J04T10 analyzed
pnml2lts-mc( 0/ 4): There are no safe places
pnml2lts-mc( 0/ 4): Loading Petri net took 0.610 real 0.740 user 0.560 sys
pnml2lts-mc( 1/ 4): LTL layer: formula: /tmp/ltl_0_
ltl formula name PolyORBLF-PT-S04J04T10-LTLFireability-01
ltl formula formula --ltl=/tmp/ltl_1_
pnml2lts-mc( 0/ 4): Loading model from model.pnml
pnml2lts-mc( 0/ 4): Edge label is id
pnml2lts-mc( 0/ 4): Petri net has 870 places, 5034 transitions and 34774 arcs
pnml2lts-mc( 0/ 4): Petri net PolyORBLF-PT-S04J04T10 analyzed
pnml2lts-mc( 0/ 4): There are no safe places
pnml2lts-mc( 0/ 4): Loading Petri net took 0.640 real 1.060 user 0.530 sys
pnml2lts-mc( 0/ 4): LTL layer: formula: /tmp/ltl_1_
ltl formula name PolyORBLF-PT-S04J04T10-LTLFireability-02
ltl formula formula --ltl=/tmp/ltl_2_
pnml2lts-mc( 0/ 4): Loading model from model.pnml
pnml2lts-mc( 0/ 4): Edge label is id
pnml2lts-mc( 0/ 4): Petri net has 870 places, 5034 transitions and 34774 arcs
pnml2lts-mc( 0/ 4): Petri net PolyORBLF-PT-S04J04T10 analyzed
pnml2lts-mc( 0/ 4): There are no safe places
pnml2lts-mc( 0/ 4): Loading Petri net took 0.670 real 0.910 user 0.480 sys
pnml2lts-mc( 1/ 4): LTL layer: formula: /tmp/ltl_2_
pnml2lts-mc( 0/ 4): Weak Buchi automaton detected, adding non-accepting as progress label.
pnml2lts-mc( 0/ 4): There are 891 state labels and 1 edge labels
pnml2lts-mc( 0/ 4): State length is 871, there are 5036 groups
pnml2lts-mc( 0/ 4): Running ufscc using 4 cores
pnml2lts-mc( 0/ 4): Using a tree table with 2^30 elements
pnml2lts-mc( 0/ 4): Successor permutation: dynamic
pnml2lts-mc( 0/ 4): Global bits: 0, count bits: 0, local bits: 0
pnml2lts-mc( 2/ 4):
pnml2lts-mc( 2/ 4): Accepting cycle FOUND at depth ~711!
pnml2lts-mc( 2/ 4):
pnml2lts-mc( 0/ 4):
pnml2lts-mc( 0/ 4): total scc count: 0
pnml2lts-mc( 0/ 4): unique states count: 2429
pnml2lts-mc( 0/ 4): unique transitions count: 5863
pnml2lts-mc( 0/ 4): - self-loop count: 0
pnml2lts-mc( 0/ 4): - claim dead count: 0
pnml2lts-mc( 0/ 4): - claim found count: 1
pnml2lts-mc( 0/ 4): - claim success count: 2434
pnml2lts-mc( 0/ 4): - cum. max stack depth: 2434
pnml2lts-mc( 0/ 4):
pnml2lts-mc( 0/ 4): Explored 2434 states 5887 transitions, fanout: 2.419
pnml2lts-mc( 0/ 4): Total exploration time 0.620 sec (0.620 sec minimum, 0.620 sec on average)
pnml2lts-mc( 0/ 4): States per second: 3926, Transitions per second: 9495
pnml2lts-mc( 0/ 4):
pnml2lts-mc( 0/ 4): Queue width: 12B, total height: 0, memory: 0.00MB
pnml2lts-mc( 0/ 4): Tree memory: 0.3MB, 51.4 B/state, compr.: 1.5%
pnml2lts-mc( 0/ 4): Tree fill ratio (roots/leafs): 0.0%/0.0%
pnml2lts-mc( 0/ 4): Stored 5151 string chucks using 0MB
pnml2lts-mc( 0/ 4): Total memory used for chunk indexing: 0MB
pnml2lts-mc( 0/ 4): Est. total memory use: 0.3MB (~8192.0MB paged-in)
ltl formula name PolyORBLF-PT-S04J04T10-LTLFireability-03
ltl formula formula --ltl=/tmp/ltl_3_
pnml2lts-mc( 0/ 4): Loading model from model.pnml
pnml2lts-mc( 0/ 4): Edge label is id
pnml2lts-mc( 0/ 4): Petri net has 870 places, 5034 transitions and 34774 arcs
pnml2lts-mc( 0/ 4): Petri net PolyORBLF-PT-S04J04T10 analyzed
pnml2lts-mc( 0/ 4): There are no safe places
pnml2lts-mc( 0/ 4): Loading Petri net took 0.650 real 0.920 user 0.630 sys
pnml2lts-mc( 1/ 4): LTL layer: formula: /tmp/ltl_3_
ltl formula name PolyORBLF-PT-S04J04T10-LTLFireability-04
ltl formula formula --ltl=/tmp/ltl_4_
pnml2lts-mc( 0/ 4): Loading model from model.pnml
pnml2lts-mc( 0/ 4): Edge label is id
pnml2lts-mc( 0/ 4): Petri net has 870 places, 5034 transitions and 34774 arcs
pnml2lts-mc( 0/ 4): Petri net PolyORBLF-PT-S04J04T10 analyzed
pnml2lts-mc( 0/ 4): There are no safe places
pnml2lts-mc( 0/ 4): Loading Petri net took 1.340 real 0.930 user 0.970 sys
pnml2lts-mc( 0/ 4): LTL layer: formula: /tmp/ltl_4_
pnml2lts-mc( 0/ 4): buchi has 2 states
pnml2lts-mc( 0/ 4): There are 890 state labels and 1 edge labels
pnml2lts-mc( 0/ 4): State length is 871, there are 5056 groups
pnml2lts-mc( 0/ 4): Running ufscc using 4 cores
pnml2lts-mc( 0/ 4): Using a tree table with 2^30 elements
pnml2lts-mc( 0/ 4): Successor permutation: dynamic
pnml2lts-mc( 0/ 4): Global bits: 0, count bits: 0, local bits: 0
pnml2lts-mc( 1/ 4):
pnml2lts-mc( 1/ 4): Accepting cycle FOUND at depth ~465!
pnml2lts-mc( 1/ 4):
pnml2lts-mc( 0/ 4):
pnml2lts-mc( 0/ 4): total scc count: 0
pnml2lts-mc( 0/ 4): unique states count: 1840
pnml2lts-mc( 0/ 4): unique transitions count: 6095
pnml2lts-mc( 0/ 4): - self-loop count: 0
pnml2lts-mc( 0/ 4): - claim dead count: 0
pnml2lts-mc( 0/ 4): - claim found count: 1
pnml2lts-mc( 0/ 4): - claim success count: 1845
pnml2lts-mc( 0/ 4): - cum. max stack depth: 1845
pnml2lts-mc( 0/ 4):
pnml2lts-mc( 0/ 4): Explored 1845 states 6119 transitions, fanout: 3.317
pnml2lts-mc( 0/ 4): Total exploration time 0.430 sec (0.430 sec minimum, 0.430 sec on average)
pnml2lts-mc( 0/ 4): States per second: 4291, Transitions per second: 14230
pnml2lts-mc( 0/ 4):
pnml2lts-mc( 0/ 4): Queue width: 12B, total height: 0, memory: 0.00MB
pnml2lts-mc( 0/ 4): Tree memory: 0.2MB, 52.9 B/state, compr.: 1.5%
pnml2lts-mc( 0/ 4): Tree fill ratio (roots/leafs): 0.0%/0.0%
pnml2lts-mc( 0/ 4): Stored 5151 string chucks using 0MB
pnml2lts-mc( 0/ 4): Total memory used for chunk indexing: 0MB
pnml2lts-mc( 0/ 4): Est. total memory use: 0.2MB (~8192.0MB paged-in)
ltl formula name PolyORBLF-PT-S04J04T10-LTLFireability-05
ltl formula formula --ltl=/tmp/ltl_5_
pnml2lts-mc( 0/ 4): Loading model from model.pnml
pnml2lts-mc( 0/ 4): Edge label is id
pnml2lts-mc( 0/ 4): Petri net has 870 places, 5034 transitions and 34774 arcs
pnml2lts-mc( 0/ 4): Petri net PolyORBLF-PT-S04J04T10 analyzed
pnml2lts-mc( 0/ 4): There are no safe places
pnml2lts-mc( 0/ 4): Loading Petri net took 0.540 real 0.760 user 0.560 sys
pnml2lts-mc( 3/ 4): LTL layer: formula: /tmp/ltl_5_
ltl formula name PolyORBLF-PT-S04J04T10-LTLFireability-06
ltl formula formula --ltl=/tmp/ltl_6_
pnml2lts-mc( 0/ 4): Loading model from model.pnml
pnml2lts-mc( 0/ 4): Edge label is id
pnml2lts-mc( 0/ 4): Petri net has 870 places, 5034 transitions and 34774 arcs
pnml2lts-mc( 0/ 4): Petri net PolyORBLF-PT-S04J04T10 analyzed
pnml2lts-mc( 0/ 4): There are no safe places
pnml2lts-mc( 0/ 4): Loading Petri net took 0.610 real 0.820 user 0.510 sys
pnml2lts-mc( 1/ 4): LTL layer: formula: /tmp/ltl_6_
ltl formula name PolyORBLF-PT-S04J04T10-LTLFireability-07
ltl formula formula --ltl=/tmp/ltl_7_
pnml2lts-mc( 0/ 4): Loading model from model.pnml
pnml2lts-mc( 0/ 4): Edge label is id
pnml2lts-mc( 0/ 4): Petri net has 870 places, 5034 transitions and 34774 arcs
pnml2lts-mc( 0/ 4): Petri net PolyORBLF-PT-S04J04T10 analyzed
pnml2lts-mc( 0/ 4): There are no safe places
pnml2lts-mc( 0/ 4): Loading Petri net took 0.510 real 0.780 user 0.470 sys
pnml2lts-mc( 1/ 4): LTL layer: formula: /tmp/ltl_7_
pnml2lts-mc( 0/ 4): Weak Buchi automaton detected, adding non-accepting as progress label.
pnml2lts-mc( 0/ 4): There are 891 state labels and 1 edge labels
pnml2lts-mc( 0/ 4): State length is 871, there are 5037 groups
pnml2lts-mc( 0/ 4): Running ufscc using 4 cores
pnml2lts-mc( 0/ 4): Using a tree table with 2^30 elements
pnml2lts-mc( 0/ 4): Successor permutation: dynamic
pnml2lts-mc( 0/ 4): Global bits: 0, count bits: 0, local bits: 0
pnml2lts-mc( 2/ 4):
pnml2lts-mc( 2/ 4): Accepting cycle FOUND at depth ~1037!
pnml2lts-mc( 2/ 4):
pnml2lts-mc( 0/ 4):
pnml2lts-mc( 0/ 4): total scc count: 0
pnml2lts-mc( 0/ 4): unique states count: 3827
pnml2lts-mc( 0/ 4): unique transitions count: 9038
pnml2lts-mc( 0/ 4): - self-loop count: 0
pnml2lts-mc( 0/ 4): - claim dead count: 0
pnml2lts-mc( 0/ 4): - claim found count: 1
pnml2lts-mc( 0/ 4): - claim success count: 3831
pnml2lts-mc( 0/ 4): - cum. max stack depth: 3831
pnml2lts-mc( 0/ 4):
pnml2lts-mc( 0/ 4): Explored 3831 states 9058 transitions, fanout: 2.364
pnml2lts-mc( 0/ 4): Total exploration time 0.870 sec (0.870 sec minimum, 0.870 sec on average)
pnml2lts-mc( 0/ 4): States per second: 4403, Transitions per second: 10411
pnml2lts-mc( 0/ 4):
pnml2lts-mc( 0/ 4): Queue width: 12B, total height: 0, memory: 0.00MB
pnml2lts-mc( 0/ 4): Tree memory: 0.4MB, 48.4 B/state, compr.: 1.4%
pnml2lts-mc( 0/ 4): Tree fill ratio (roots/leafs): 0.0%/0.0%
pnml2lts-mc( 0/ 4): Stored 5151 string chucks using 0MB
pnml2lts-mc( 0/ 4): Total memory used for chunk indexing: 0MB
pnml2lts-mc( 0/ 4): Est. total memory use: 0.4MB (~8192.0MB paged-in)
ltl formula name PolyORBLF-PT-S04J04T10-LTLFireability-08
ltl formula formula --ltl=/tmp/ltl_8_
pnml2lts-mc( 0/ 4): Loading model from model.pnml
pnml2lts-mc( 0/ 4): Edge label is id
pnml2lts-mc( 0/ 4): Petri net has 870 places, 5034 transitions and 34774 arcs
pnml2lts-mc( 0/ 4): Petri net PolyORBLF-PT-S04J04T10 analyzed
pnml2lts-mc( 0/ 4): There are no safe places
pnml2lts-mc( 0/ 4): Loading Petri net took 0.550 real 0.820 user 0.490 sys
pnml2lts-mc( 0/ 4): LTL layer: formula: /tmp/ltl_8_
pnml2lts-mc( 0/ 4): buchi has 2 states
pnml2lts-mc( 0/ 4): Weak Buchi automaton detected, adding non-accepting as progress label.
pnml2lts-mc( 0/ 4): There are 891 state labels and 1 edge labels
pnml2lts-mc( 0/ 4): State length is 871, there are 5036 groups
pnml2lts-mc( 0/ 4): Running ufscc using 4 cores
pnml2lts-mc( 0/ 4): Using a tree table with 2^30 elements
pnml2lts-mc( 0/ 4): Successor permutation: dynamic
pnml2lts-mc( 0/ 4): Global bits: 0, count bits: 0, local bits: 0
pnml2lts-mc( 2/ 4):
pnml2lts-mc( 2/ 4): Accepting cycle FOUND at depth ~391!
pnml2lts-mc( 2/ 4):
pnml2lts-mc( 0/ 4):
pnml2lts-mc( 0/ 4): total scc count: 0
pnml2lts-mc( 0/ 4): unique states count: 1535
pnml2lts-mc( 0/ 4): unique transitions count: 3485
pnml2lts-mc( 0/ 4): - self-loop count: 0
pnml2lts-mc( 0/ 4): - claim dead count: 0
pnml2lts-mc( 0/ 4): - claim found count: 1
pnml2lts-mc( 0/ 4): - claim success count: 1544
pnml2lts-mc( 0/ 4): - cum. max stack depth: 1544
pnml2lts-mc( 0/ 4):
pnml2lts-mc( 0/ 4): Explored 1544 states 3526 transitions, fanout: 2.284
pnml2lts-mc( 0/ 4): Total exploration time 0.340 sec (0.340 sec minimum, 0.340 sec on average)
pnml2lts-mc( 0/ 4): States per second: 4541, Transitions per second: 10371
pnml2lts-mc( 0/ 4):
pnml2lts-mc( 0/ 4): Queue width: 12B, total height: 0, memory: 0.00MB
pnml2lts-mc( 0/ 4): Tree memory: 0.2MB, 52.7 B/state, compr.: 1.5%
pnml2lts-mc( 0/ 4): Tree fill ratio (roots/leafs): 0.0%/0.0%
pnml2lts-mc( 0/ 4): Stored 5151 string chucks using 0MB
pnml2lts-mc( 0/ 4): Total memory used for chunk indexing: 0MB
pnml2lts-mc( 0/ 4): Est. total memory use: 0.2MB (~8192.0MB paged-in)
ltl formula name PolyORBLF-PT-S04J04T10-LTLFireability-09
ltl formula formula --ltl=/tmp/ltl_9_
pnml2lts-mc( 0/ 4): Loading model from model.pnml
pnml2lts-mc( 0/ 4): Edge label is id
pnml2lts-mc( 0/ 4): Petri net has 870 places, 5034 transitions and 34774 arcs
pnml2lts-mc( 0/ 4): Petri net PolyORBLF-PT-S04J04T10 analyzed
pnml2lts-mc( 0/ 4): There are no safe places
pnml2lts-mc( 0/ 4): Loading Petri net took 0.520 real 0.750 user 0.510 sys
pnml2lts-mc( 1/ 4): LTL layer: formula: /tmp/ltl_9_
pnml2lts-mc( 0/ 4): Weak Buchi automaton detected, adding non-accepting as progress label.
pnml2lts-mc( 0/ 4): There are 891 state labels and 1 edge labels
pnml2lts-mc( 0/ 4): State length is 871, there are 5036 groups
pnml2lts-mc( 0/ 4): Running ufscc using 4 cores
pnml2lts-mc( 0/ 4): Using a tree table with 2^30 elements
pnml2lts-mc( 0/ 4): Successor permutation: dynamic
pnml2lts-mc( 0/ 4): Global bits: 0, count bits: 0, local bits: 0
pnml2lts-mc( 3/ 4):
pnml2lts-mc( 3/ 4): Accepting cycle FOUND at depth ~696!
pnml2lts-mc( 3/ 4):
pnml2lts-mc( 0/ 4):
pnml2lts-mc( 0/ 4): total scc count: 0
pnml2lts-mc( 0/ 4): unique states count: 2866
pnml2lts-mc( 0/ 4): unique transitions count: 7007
pnml2lts-mc( 0/ 4): - self-loop count: 0
pnml2lts-mc( 0/ 4): - claim dead count: 0
pnml2lts-mc( 0/ 4): - claim found count: 1
pnml2lts-mc( 0/ 4): - claim success count: 2870
pnml2lts-mc( 0/ 4): - cum. max stack depth: 2870
pnml2lts-mc( 0/ 4):
pnml2lts-mc( 0/ 4): Explored 2870 states 7027 transitions, fanout: 2.448
pnml2lts-mc( 0/ 4): Total exploration time 0.630 sec (0.630 sec minimum, 0.630 sec on average)
pnml2lts-mc( 0/ 4): States per second: 4556, Transitions per second: 11154
pnml2lts-mc( 0/ 4):
pnml2lts-mc( 0/ 4): Queue width: 12B, total height: 0, memory: 0.00MB
pnml2lts-mc( 0/ 4): Tree memory: 0.3MB, 49.5 B/state, compr.: 1.4%
pnml2lts-mc( 0/ 4): Tree fill ratio (roots/leafs): 0.0%/0.0%
pnml2lts-mc( 0/ 4): Stored 5151 string chucks using 0MB
pnml2lts-mc( 0/ 4): Total memory used for chunk indexing: 0MB
pnml2lts-mc( 0/ 4): Est. total memory use: 0.3MB (~8192.0MB paged-in)
ltl formula name PolyORBLF-PT-S04J04T10-LTLFireability-10
ltl formula formula --ltl=/tmp/ltl_10_
pnml2lts-mc( 0/ 4): Loading model from model.pnml
pnml2lts-mc( 0/ 4): Edge label is id
pnml2lts-mc( 0/ 4): Petri net has 870 places, 5034 transitions and 34774 arcs
pnml2lts-mc( 0/ 4): Petri net PolyORBLF-PT-S04J04T10 analyzed
pnml2lts-mc( 0/ 4): There are no safe places
pnml2lts-mc( 0/ 4): Loading Petri net took 0.560 real 0.850 user 0.480 sys
pnml2lts-mc( 1/ 4): LTL layer: formula: /tmp/ltl_10_
pnml2lts-mc( 0/ 4): Weak Buchi automaton detected, adding non-accepting as progress label.
pnml2lts-mc( 0/ 4): There are 891 state labels and 1 edge labels
pnml2lts-mc( 0/ 4): State length is 871, there are 5035 groups
pnml2lts-mc( 0/ 4): Running ufscc using 4 cores
pnml2lts-mc( 0/ 4): Using a tree table with 2^30 elements
pnml2lts-mc( 0/ 4): Successor permutation: dynamic
pnml2lts-mc( 0/ 4): Global bits: 0, count bits: 0, local bits: 0
pnml2lts-mc( 0/ 4):
pnml2lts-mc( 0/ 4): Accepting cycle FOUND at depth ~353!
pnml2lts-mc( 0/ 4):
pnml2lts-mc( 0/ 4):
pnml2lts-mc( 0/ 4): total scc count: 0
pnml2lts-mc( 0/ 4): unique states count: 1443
pnml2lts-mc( 0/ 4): unique transitions count: 3967
pnml2lts-mc( 0/ 4): - self-loop count: 0
pnml2lts-mc( 0/ 4): - claim dead count: 0
pnml2lts-mc( 0/ 4): - claim found count: 1
pnml2lts-mc( 0/ 4): - claim success count: 1450
pnml2lts-mc( 0/ 4): - cum. max stack depth: 1450
pnml2lts-mc( 0/ 4):
pnml2lts-mc( 0/ 4): Explored 1450 states 3994 transitions, fanout: 2.754
pnml2lts-mc( 0/ 4): Total exploration time 0.340 sec (0.330 sec minimum, 0.335 sec on average)
pnml2lts-mc( 0/ 4): States per second: 4265, Transitions per second: 11747
pnml2lts-mc( 0/ 4):
pnml2lts-mc( 0/ 4): Queue width: 12B, total height: 0, memory: 0.00MB
pnml2lts-mc( 0/ 4): Tree memory: 0.2MB, 49.7 B/state, compr.: 1.4%
pnml2lts-mc( 0/ 4): Tree fill ratio (roots/leafs): 0.0%/0.0%
pnml2lts-mc( 0/ 4): Stored 5151 string chucks using 0MB
pnml2lts-mc( 0/ 4): Total memory used for chunk indexing: 0MB
pnml2lts-mc( 0/ 4): Est. total memory use: 0.2MB (~8192.0MB paged-in)
ltl formula name PolyORBLF-PT-S04J04T10-LTLFireability-11
ltl formula formula --ltl=/tmp/ltl_11_
pnml2lts-mc( 0/ 4): Loading model from model.pnml
pnml2lts-mc( 0/ 4): Edge label is id
pnml2lts-mc( 0/ 4): Petri net has 870 places, 5034 transitions and 34774 arcs
pnml2lts-mc( 0/ 4): Petri net PolyORBLF-PT-S04J04T10 analyzed
pnml2lts-mc( 0/ 4): There are no safe places
pnml2lts-mc( 0/ 4): Loading Petri net took 0.540 real 0.820 user 0.480 sys
pnml2lts-mc( 1/ 4): LTL layer: formula: /tmp/ltl_11_
pnml2lts-mc( 0/ 4): There are 890 state labels and 1 edge labels
pnml2lts-mc( 0/ 4): State length is 871, there are 5038 groups
pnml2lts-mc( 0/ 4): Running ufscc using 4 cores
pnml2lts-mc( 0/ 4): Using a tree table with 2^30 elements
pnml2lts-mc( 0/ 4): Successor permutation: dynamic
pnml2lts-mc( 0/ 4): Global bits: 0, count bits: 0, local bits: 0
pnml2lts-mc( 1/ 4):
pnml2lts-mc( 1/ 4): Accepting cycle FOUND at depth ~474!
pnml2lts-mc( 1/ 4):
pnml2lts-mc( 0/ 4):
pnml2lts-mc( 0/ 4): total scc count: 0
pnml2lts-mc( 0/ 4): unique states count: 1882
pnml2lts-mc( 0/ 4): unique transitions count: 5316
pnml2lts-mc( 0/ 4): - self-loop count: 0
pnml2lts-mc( 0/ 4): - claim dead count: 0
pnml2lts-mc( 0/ 4): - claim found count: 1
pnml2lts-mc( 0/ 4): - claim success count: 1889
pnml2lts-mc( 0/ 4): - cum. max stack depth: 1889
pnml2lts-mc( 0/ 4):
pnml2lts-mc( 0/ 4): Explored 1889 states 5343 transitions, fanout: 2.828
pnml2lts-mc( 0/ 4): Total exploration time 0.440 sec (0.440 sec minimum, 0.440 sec on average)
pnml2lts-mc( 0/ 4): States per second: 4293, Transitions per second: 12143
pnml2lts-mc( 0/ 4):
pnml2lts-mc( 0/ 4): Queue width: 12B, total height: 0, memory: 0.00MB
pnml2lts-mc( 0/ 4): Tree memory: 0.2MB, 49.1 B/state, compr.: 1.4%
pnml2lts-mc( 0/ 4): Tree fill ratio (roots/leafs): 0.0%/0.0%
pnml2lts-mc( 0/ 4): Stored 5151 string chucks using 0MB
pnml2lts-mc( 0/ 4): Total memory used for chunk indexing: 0MB
pnml2lts-mc( 0/ 4): Est. total memory use: 0.2MB (~8192.0MB paged-in)
ltl formula name PolyORBLF-PT-S04J04T10-LTLFireability-12
ltl formula formula --ltl=/tmp/ltl_12_
pnml2lts-mc( 0/ 4): Loading model from model.pnml
pnml2lts-mc( 0/ 4): Edge label is id
pnml2lts-mc( 0/ 4): Petri net has 870 places, 5034 transitions and 34774 arcs
pnml2lts-mc( 0/ 4): Petri net PolyORBLF-PT-S04J04T10 analyzed
pnml2lts-mc( 0/ 4): There are no safe places
pnml2lts-mc( 0/ 4): Loading Petri net took 0.510 real 0.740 user 0.400 sys
pnml2lts-mc( 3/ 4): LTL layer: formula: /tmp/ltl_12_
pnml2lts-mc( 0/ 4): Weak Buchi automaton detected, adding non-accepting as progress label.
pnml2lts-mc( 0/ 4): There are 891 state labels and 1 edge labels
pnml2lts-mc( 0/ 4): State length is 871, there are 5035 groups
pnml2lts-mc( 0/ 4): Running ufscc using 4 cores
pnml2lts-mc( 0/ 4): Using a tree table with 2^30 elements
pnml2lts-mc( 0/ 4): Successor permutation: dynamic
pnml2lts-mc( 0/ 4): Global bits: 0, count bits: 0, local bits: 0
pnml2lts-mc( 3/ 4):
pnml2lts-mc( 3/ 4): Accepting cycle FOUND at depth ~435!
pnml2lts-mc( 3/ 4):
pnml2lts-mc( 0/ 4):
pnml2lts-mc( 0/ 4): total scc count: 0
pnml2lts-mc( 0/ 4): unique states count: 1785
pnml2lts-mc( 0/ 4): unique transitions count: 4270
pnml2lts-mc( 0/ 4): - self-loop count: 0
pnml2lts-mc( 0/ 4): - claim dead count: 0
pnml2lts-mc( 0/ 4): - claim found count: 1
pnml2lts-mc( 0/ 4): - claim success count: 1792
pnml2lts-mc( 0/ 4): - cum. max stack depth: 1792
pnml2lts-mc( 0/ 4):
pnml2lts-mc( 0/ 4): Explored 1792 states 4297 transitions, fanout: 2.398
pnml2lts-mc( 0/ 4): Total exploration time 0.400 sec (0.400 sec minimum, 0.400 sec on average)
pnml2lts-mc( 0/ 4): States per second: 4480, Transitions per second: 10742
pnml2lts-mc( 0/ 4):
pnml2lts-mc( 0/ 4): Queue width: 12B, total height: 0, memory: 0.00MB
pnml2lts-mc( 0/ 4): Tree memory: 0.2MB, 52.8 B/state, compr.: 1.5%
pnml2lts-mc( 0/ 4): Tree fill ratio (roots/leafs): 0.0%/0.0%
pnml2lts-mc( 0/ 4): Stored 5151 string chucks using 0MB
pnml2lts-mc( 0/ 4): Total memory used for chunk indexing: 0MB
pnml2lts-mc( 0/ 4): Est. total memory use: 0.2MB (~8192.0MB paged-in)
ltl formula name PolyORBLF-PT-S04J04T10-LTLFireability-13
ltl formula formula --ltl=/tmp/ltl_13_
pnml2lts-mc( 0/ 4): Loading model from model.pnml
pnml2lts-mc( 0/ 4): Edge label is id
pnml2lts-mc( 0/ 4): Petri net has 870 places, 5034 transitions and 34774 arcs
pnml2lts-mc( 0/ 4): Petri net PolyORBLF-PT-S04J04T10 analyzed
pnml2lts-mc( 0/ 4): There are no safe places
pnml2lts-mc( 0/ 4): Loading Petri net took 0.690 real 1.060 user 0.610 sys
pnml2lts-mc( 1/ 4): LTL layer: formula: /tmp/ltl_13_
pnml2lts-mc( 0/ 4): Weak Buchi automaton detected, adding non-accepting as progress label.
pnml2lts-mc( 0/ 4): There are 891 state labels and 1 edge labels
pnml2lts-mc( 0/ 4): State length is 871, there are 5036 groups
pnml2lts-mc( 0/ 4): Running ufscc using 4 cores
pnml2lts-mc( 0/ 4): Using a tree table with 2^30 elements
pnml2lts-mc( 0/ 4): Successor permutation: dynamic
pnml2lts-mc( 0/ 4): Global bits: 0, count bits: 0, local bits: 0
pnml2lts-mc( 1/ 4):
pnml2lts-mc( 1/ 4): Accepting cycle FOUND at depth ~624!
pnml2lts-mc( 1/ 4):
pnml2lts-mc( 0/ 4):
pnml2lts-mc( 0/ 4): total scc count: 0
pnml2lts-mc( 0/ 4): unique states count: 2804
pnml2lts-mc( 0/ 4): unique transitions count: 7230
pnml2lts-mc( 0/ 4): - self-loop count: 1
pnml2lts-mc( 0/ 4): - claim dead count: 0
pnml2lts-mc( 0/ 4): - claim found count: 0
pnml2lts-mc( 0/ 4): - claim success count: 2812
pnml2lts-mc( 0/ 4): - cum. max stack depth: 2812
pnml2lts-mc( 0/ 4):
pnml2lts-mc( 0/ 4): Explored 2812 states 7261 transitions, fanout: 2.582
pnml2lts-mc( 0/ 4): Total exploration time 0.840 sec (0.840 sec minimum, 0.840 sec on average)
pnml2lts-mc( 0/ 4): States per second: 3348, Transitions per second: 8644
pnml2lts-mc( 0/ 4):
pnml2lts-mc( 0/ 4): Queue width: 12B, total height: 0, memory: 0.00MB
pnml2lts-mc( 0/ 4): Tree memory: 0.3MB, 49.6 B/state, compr.: 1.4%
pnml2lts-mc( 0/ 4): Tree fill ratio (roots/leafs): 0.0%/0.0%
pnml2lts-mc( 0/ 4): Stored 5151 string chucks using 0MB
pnml2lts-mc( 0/ 4): Total memory used for chunk indexing: 0MB
pnml2lts-mc( 0/ 4): Est. total memory use: 0.3MB (~8192.0MB paged-in)
ltl formula name PolyORBLF-PT-S04J04T10-LTLFireability-14
ltl formula formula --ltl=/tmp/ltl_14_
pnml2lts-mc( 0/ 4): Loading model from model.pnml
pnml2lts-mc( 0/ 4): Edge label is id
pnml2lts-mc( 0/ 4): Petri net has 870 places, 5034 transitions and 34774 arcs
pnml2lts-mc( 0/ 4): Petri net PolyORBLF-PT-S04J04T10 analyzed
pnml2lts-mc( 0/ 4): There are no safe places
pnml2lts-mc( 0/ 4): Loading Petri net took 0.660 real 1.000 user 0.610 sys
pnml2lts-mc( 0/ 4): LTL layer: formula: /tmp/ltl_14_
pnml2lts-mc( 0/ 4): buchi has 3 states
pnml2lts-mc( 0/ 4): Weak Buchi automaton detected, adding non-accepting as progress label.
pnml2lts-mc( 0/ 4): There are 891 state labels and 1 edge labels
pnml2lts-mc( 0/ 4): State length is 871, there are 5038 groups
pnml2lts-mc( 0/ 4): Running ufscc using 4 cores
pnml2lts-mc( 0/ 4): Using a tree table with 2^30 elements
pnml2lts-mc( 0/ 4): Successor permutation: dynamic
pnml2lts-mc( 0/ 4): Global bits: 0, count bits: 0, local bits: 0
pnml2lts-mc( 2/ 4):
pnml2lts-mc( 2/ 4): Accepting cycle FOUND at depth ~645!
pnml2lts-mc( 2/ 4):
pnml2lts-mc( 0/ 4):
pnml2lts-mc( 0/ 4): total scc count: 0
pnml2lts-mc( 0/ 4): unique states count: 2796
pnml2lts-mc( 0/ 4): unique transitions count: 7200
pnml2lts-mc( 0/ 4): - self-loop count: 0
pnml2lts-mc( 0/ 4): - claim dead count: 0
pnml2lts-mc( 0/ 4): - claim found count: 1
pnml2lts-mc( 0/ 4): - claim success count: 2801
pnml2lts-mc( 0/ 4): - cum. max stack depth: 2801
pnml2lts-mc( 0/ 4):
pnml2lts-mc( 0/ 4): Explored 2801 states 7224 transitions, fanout: 2.579
pnml2lts-mc( 0/ 4): Total exploration time 0.780 sec (0.780 sec minimum, 0.780 sec on average)
pnml2lts-mc( 0/ 4): States per second: 3591, Transitions per second: 9262
pnml2lts-mc( 0/ 4):
pnml2lts-mc( 0/ 4): Queue width: 12B, total height: 0, memory: 0.00MB
pnml2lts-mc( 0/ 4): Tree memory: 0.3MB, 49.8 B/state, compr.: 1.4%
pnml2lts-mc( 0/ 4): Tree fill ratio (roots/leafs): 0.0%/0.0%
pnml2lts-mc( 0/ 4): Stored 5151 string chucks using 0MB
pnml2lts-mc( 0/ 4): Total memory used for chunk indexing: 0MB
pnml2lts-mc( 0/ 4): Est. total memory use: 0.3MB (~8192.0MB paged-in)
ltl formula name PolyORBLF-PT-S04J04T10-LTLFireability-15
ltl formula formula --ltl=/tmp/ltl_15_
pnml2lts-mc( 0/ 4): Loading model from model.pnml
pnml2lts-mc( 0/ 4): Edge label is id
pnml2lts-mc( 0/ 4): Petri net has 870 places, 5034 transitions and 34774 arcs
pnml2lts-mc( 0/ 4): Petri net PolyORBLF-PT-S04J04T10 analyzed
pnml2lts-mc( 0/ 4): There are no safe places
pnml2lts-mc( 0/ 4): Loading Petri net took 0.710 real 1.040 user 0.640 sys
pnml2lts-mc( 3/ 4): LTL layer: formula: /tmp/ltl_15_
pnml2lts-mc( 0/ 4): Weak Buchi automaton detected, adding non-accepting as progress label.
pnml2lts-mc( 0/ 4): There are 891 state labels and 1 edge labels
pnml2lts-mc( 0/ 4): State length is 871, there are 5035 groups
pnml2lts-mc( 0/ 4): Running ufscc using 4 cores
pnml2lts-mc( 0/ 4): Using a tree table with 2^30 elements
pnml2lts-mc( 0/ 4): Successor permutation: dynamic
pnml2lts-mc( 0/ 4): Global bits: 0, count bits: 0, local bits: 0
pnml2lts-mc( 2/ 4):
pnml2lts-mc( 2/ 4): Accepting cycle FOUND at depth ~925!
pnml2lts-mc( 2/ 4):
pnml2lts-mc( 0/ 4):
pnml2lts-mc( 0/ 4): total scc count: 0
pnml2lts-mc( 0/ 4): unique states count: 3816
pnml2lts-mc( 0/ 4): unique transitions count: 10337
pnml2lts-mc( 0/ 4): - self-loop count: 0
pnml2lts-mc( 0/ 4): - claim dead count: 0
pnml2lts-mc( 0/ 4): - claim found count: 1
pnml2lts-mc( 0/ 4): - claim success count: 3820
pnml2lts-mc( 0/ 4): - cum. max stack depth: 3820
pnml2lts-mc( 0/ 4):
pnml2lts-mc( 0/ 4): Explored 3820 states 10357 transitions, fanout: 2.711
pnml2lts-mc( 0/ 4): Total exploration time 1.010 sec (1.010 sec minimum, 1.010 sec on average)
pnml2lts-mc( 0/ 4): States per second: 3782, Transitions per second: 10254
pnml2lts-mc( 0/ 4):
pnml2lts-mc( 0/ 4): Queue width: 12B, total height: 0, memory: 0.00MB
pnml2lts-mc( 0/ 4): Tree memory: 0.4MB, 46.1 B/state, compr.: 1.3%
pnml2lts-mc( 0/ 4): Tree fill ratio (roots/leafs): 0.0%/0.0%
pnml2lts-mc( 0/ 4): Stored 5151 string chucks using 0MB
pnml2lts-mc( 0/ 4): Total memory used for chunk indexing: 0MB
pnml2lts-mc( 0/ 4): Est. total memory use: 0.4MB (~8192.0MB paged-in)
Sequence of Actions to be Executed by the VM
This is useful if one wants to reexecute the tool in the VM from the submitted image disk.
set -x
# this is for BenchKit: configuration of major elements for the test
export BK_INPUT="PolyORBLF-PT-S04J04T10"
export BK_EXAMINATION="LTLFireability"
export BK_TOOL="ltsmin"
export BK_RESULT_DIR="/tmp/BK_RESULTS/OUTPUTS"
export BK_TIME_CONFINEMENT="3600"
export BK_MEMORY_CONFINEMENT="16384"
# this is specific to your benchmark or test
export BIN_DIR="$HOME/BenchKit/bin"
# remove the execution directoty if it exists (to avoid increse of .vmdk images)
if [ -d execution ] ; then
rm -rf execution
fi
tar xzf /home/mcc/BenchKit/INPUTS/PolyORBLF-PT-S04J04T10.tgz
mv PolyORBLF-PT-S04J04T10 execution
cd execution
pwd
ls -lh
# this is for BenchKit: explicit launching of the test
echo "====================================================================="
echo " Generated by BenchKit 2-3637"
echo " Executing tool ltsmin"
echo " Input is PolyORBLF-PT-S04J04T10, examination is LTLFireability"
echo " Time confinement is $BK_TIME_CONFINEMENT seconds"
echo " Memory confinement is 16384 MBytes"
echo " Number of cores is 4"
echo " Run identifier is r209-smll-152732259200406"
echo "====================================================================="
echo
echo "--------------------"
echo "content from stdout:"
echo
echo "=== Data for post analysis generated by BenchKit (invocation template)"
echo
if [ "LTLFireability" = "UpperBounds" ] ; then
echo "The expected result is a vector of positive values"
echo NUM_VECTOR
elif [ "LTLFireability" != "StateSpace" ] ; then
echo "The expected result is a vector of booleans"
echo BOOL_VECTOR
else
echo "no data necessary for post analysis"
fi
echo
if [ -f "LTLFireability.txt" ] ; then
echo "here is the order used to build the result vector(from text file)"
for x in $(grep Property LTLFireability.txt | cut -d ' ' -f 2 | sort -u) ; do
echo "FORMULA_NAME $x"
done
elif [ -f "LTLFireability.xml" ] ; then # for cunf (txt files deleted;-)
echo echo "here is the order used to build the result vector(from xml file)"
for x in $(grep '
echo "FORMULA_NAME $x"
done
fi
echo
echo "=== Now, execution of the tool begins"
echo
echo -n "BK_START "
date -u +%s%3N
echo
timeout -s 9 $BK_TIME_CONFINEMENT bash -c "/home/mcc/BenchKit/BenchKit_head.sh 2> STDERR ; echo ; echo -n \"BK_STOP \" ; date -u +%s%3N"
if [ $? -eq 137 ] ; then
echo
echo "BK_TIME_CONFINEMENT_REACHED"
fi
echo
echo "--------------------"
echo "content from stderr:"
echo
cat STDERR ;