

About the Execution of LTSMin for PolyORBLF-PT-S02J06T10
| Execution Summary | |||||
| Max Memory Used (MB) |
Time wait (ms) | CPU Usage (ms) | I/O Wait (ms) | Computed Result | Execution Status |
| 15912.000 | 935659.00 | 3563732.00 | 6414.20 | FF?FTFFTFT?TTF?? | normal |
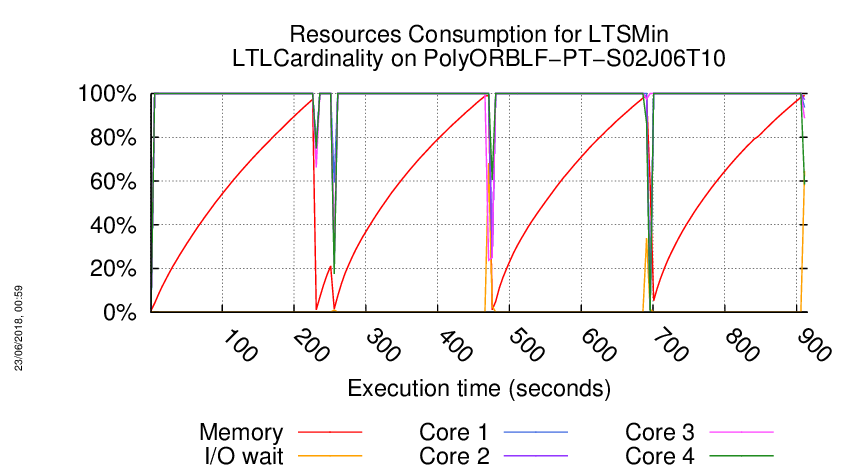
Execution Chart
We display below the execution chart for this examination (boot time has been removed).
Trace from the execution
Waiting for the VM to be ready (probing ssh)
......................
/home/mcc/execution
total 2.1M
-rw-r--r-- 1 mcc users 17K May 15 18:54 CTLCardinality.txt
-rw-r--r-- 1 mcc users 52K May 15 18:54 CTLCardinality.xml
-rw-r--r-- 1 mcc users 18K May 15 18:54 CTLFireability.txt
-rw-r--r-- 1 mcc users 69K May 15 18:54 CTLFireability.xml
-rw-r--r-- 1 mcc users 4.0K May 15 18:50 GenericPropertiesDefinition.xml
-rw-r--r-- 1 mcc users 5.9K May 15 18:50 GenericPropertiesVerdict.xml
-rw-r--r-- 1 mcc users 7.6K May 26 09:27 LTLCardinality.txt
-rw-r--r-- 1 mcc users 23K May 26 09:27 LTLCardinality.xml
-rw-r--r-- 1 mcc users 4.4K May 26 09:27 LTLFireability.txt
-rw-r--r-- 1 mcc users 17K May 26 09:27 LTLFireability.xml
-rw-r--r-- 1 mcc users 11K May 15 18:54 ReachabilityCardinality.txt
-rw-r--r-- 1 mcc users 37K May 15 18:54 ReachabilityCardinality.xml
-rw-r--r-- 1 mcc users 113 May 15 18:54 ReachabilityDeadlock.txt
-rw-r--r-- 1 mcc users 351 May 15 18:54 ReachabilityDeadlock.xml
-rw-r--r-- 1 mcc users 15K May 15 18:54 ReachabilityFireability.txt
-rw-r--r-- 1 mcc users 56K May 15 18:54 ReachabilityFireability.xml
-rw-r--r-- 1 mcc users 2.7K May 15 18:54 UpperBounds.txt
-rw-r--r-- 1 mcc users 5.7K May 15 18:54 UpperBounds.xml
-rw-r--r-- 1 mcc users 5 May 15 18:50 equiv_col
-rw-r--r-- 1 mcc users 10 May 15 18:50 instance
-rw-r--r-- 1 mcc users 6 May 15 18:50 iscolored
-rw-r--r-- 1 mcc users 1.7M May 15 18:50 model.pnml
=====================================================================
Generated by BenchKit 2-3637
Executing tool ltsmin
Input is PolyORBLF-PT-S02J06T10, examination is LTLCardinality
Time confinement is 3600 seconds
Memory confinement is 16384 MBytes
Number of cores is 4
Run identifier is r209-smll-152732259100399
=====================================================================
--------------------
content from stdout:
=== Data for post analysis generated by BenchKit (invocation template)
The expected result is a vector of booleans
BOOL_VECTOR
here is the order used to build the result vector(from text file)
FORMULA_NAME PolyORBLF-PT-S02J06T10-LTLCardinality-00
FORMULA_NAME PolyORBLF-PT-S02J06T10-LTLCardinality-01
FORMULA_NAME PolyORBLF-PT-S02J06T10-LTLCardinality-02
FORMULA_NAME PolyORBLF-PT-S02J06T10-LTLCardinality-03
FORMULA_NAME PolyORBLF-PT-S02J06T10-LTLCardinality-04
FORMULA_NAME PolyORBLF-PT-S02J06T10-LTLCardinality-05
FORMULA_NAME PolyORBLF-PT-S02J06T10-LTLCardinality-06
FORMULA_NAME PolyORBLF-PT-S02J06T10-LTLCardinality-07
FORMULA_NAME PolyORBLF-PT-S02J06T10-LTLCardinality-08
FORMULA_NAME PolyORBLF-PT-S02J06T10-LTLCardinality-09
FORMULA_NAME PolyORBLF-PT-S02J06T10-LTLCardinality-10
FORMULA_NAME PolyORBLF-PT-S02J06T10-LTLCardinality-11
FORMULA_NAME PolyORBLF-PT-S02J06T10-LTLCardinality-12
FORMULA_NAME PolyORBLF-PT-S02J06T10-LTLCardinality-13
FORMULA_NAME PolyORBLF-PT-S02J06T10-LTLCardinality-14
FORMULA_NAME PolyORBLF-PT-S02J06T10-LTLCardinality-15
=== Now, execution of the tool begins
BK_START 1527397733026
FORMULA PolyORBLF-PT-S02J06T10-LTLCardinality-00 FALSE TECHNIQUES EXPLICIT PARALLEL_PROCESSING USE_NUPN
FORMULA PolyORBLF-PT-S02J06T10-LTLCardinality-01 FALSE TECHNIQUES EXPLICIT PARALLEL_PROCESSING USE_NUPN
FORMULA PolyORBLF-PT-S02J06T10-LTLCardinality-02 CANNOT_COMPUTE
FORMULA PolyORBLF-PT-S02J06T10-LTLCardinality-03 FALSE TECHNIQUES EXPLICIT PARALLEL_PROCESSING USE_NUPN
FORMULA PolyORBLF-PT-S02J06T10-LTLCardinality-04 TRUE TECHNIQUES EXPLICIT PARALLEL_PROCESSING USE_NUPN
FORMULA PolyORBLF-PT-S02J06T10-LTLCardinality-05 FALSE TECHNIQUES EXPLICIT PARALLEL_PROCESSING USE_NUPN
FORMULA PolyORBLF-PT-S02J06T10-LTLCardinality-06 FALSE TECHNIQUES EXPLICIT PARALLEL_PROCESSING USE_NUPN
FORMULA PolyORBLF-PT-S02J06T10-LTLCardinality-07 TRUE TECHNIQUES EXPLICIT PARALLEL_PROCESSING USE_NUPN
FORMULA PolyORBLF-PT-S02J06T10-LTLCardinality-08 FALSE TECHNIQUES EXPLICIT PARALLEL_PROCESSING USE_NUPN
FORMULA PolyORBLF-PT-S02J06T10-LTLCardinality-09 TRUE TECHNIQUES EXPLICIT PARALLEL_PROCESSING USE_NUPN
FORMULA PolyORBLF-PT-S02J06T10-LTLCardinality-10 CANNOT_COMPUTE
FORMULA PolyORBLF-PT-S02J06T10-LTLCardinality-11 TRUE TECHNIQUES EXPLICIT PARALLEL_PROCESSING USE_NUPN
FORMULA PolyORBLF-PT-S02J06T10-LTLCardinality-12 TRUE TECHNIQUES EXPLICIT PARALLEL_PROCESSING USE_NUPN
FORMULA PolyORBLF-PT-S02J06T10-LTLCardinality-13 FALSE TECHNIQUES EXPLICIT PARALLEL_PROCESSING USE_NUPN
FORMULA PolyORBLF-PT-S02J06T10-LTLCardinality-14 CANNOT_COMPUTE
FORMULA PolyORBLF-PT-S02J06T10-LTLCardinality-15 CANNOT_COMPUTE
BK_STOP 1527398668685
--------------------
content from stderr:
mcc2018
ltl formula name PolyORBLF-PT-S02J06T10-LTLCardinality-00
ltl formula formula --ltl=/tmp/ltl_0_
pnml2lts-mc( 0/ 4): Loading model from model.pnml
pnml2lts-mc( 0/ 4): Edge label is id
pnml2lts-mc( 0/ 4): Petri net has 844 places, 1812 transitions and 8302 arcs
pnml2lts-mc( 0/ 4): Petri net PolyORBLF-PT-S02J06T10 analyzed
pnml2lts-mc( 0/ 4): There are no safe places
pnml2lts-mc( 0/ 4): Loading Petri net took 0.250 real 0.280 user 0.190 sys
pnml2lts-mc( 1/ 4): LTL layer: formula: /tmp/ltl_0_
pnml2lts-mc( 0/ 4): There are 858 state labels and 1 edge labels
pnml2lts-mc( 0/ 4): State length is 845, there are 1822 groups
pnml2lts-mc( 0/ 4): Running ufscc using 4 cores
pnml2lts-mc( 0/ 4): Using a tree table with 2^30 elements
pnml2lts-mc( 0/ 4): Successor permutation: dynamic
pnml2lts-mc( 0/ 4): Global bits: 0, count bits: 0, local bits: 0
pnml2lts-mc( 3/ 4):
pnml2lts-mc( 3/ 4): Accepting cycle FOUND at depth ~420!
pnml2lts-mc( 3/ 4):
pnml2lts-mc( 0/ 4):
pnml2lts-mc( 0/ 4): total scc count: 0
pnml2lts-mc( 0/ 4): unique states count: 1544
pnml2lts-mc( 0/ 4): unique transitions count: 3081
pnml2lts-mc( 0/ 4): - self-loop count: 0
pnml2lts-mc( 0/ 4): - claim dead count: 0
pnml2lts-mc( 0/ 4): - claim found count: 1
pnml2lts-mc( 0/ 4): - claim success count: 1558
pnml2lts-mc( 0/ 4): - cum. max stack depth: 1558
pnml2lts-mc( 0/ 4):
pnml2lts-mc( 0/ 4): Explored 1558 states 3140 transitions, fanout: 2.015
pnml2lts-mc( 0/ 4): Total exploration time 0.270 sec (0.270 sec minimum, 0.270 sec on average)
pnml2lts-mc( 0/ 4): States per second: 5770, Transitions per second: 11630
pnml2lts-mc( 0/ 4):
pnml2lts-mc( 0/ 4): Queue width: 12B, total height: 0, memory: 0.00MB
pnml2lts-mc( 0/ 4): Tree memory: 0.1MB, 49.3 B/state, compr.: 1.5%
pnml2lts-mc( 0/ 4): Tree fill ratio (roots/leafs): 0.0%/0.0%
pnml2lts-mc( 0/ 4): Stored 1842 string chucks using 0MB
pnml2lts-mc( 0/ 4): Total memory used for chunk indexing: 0MB
pnml2lts-mc( 0/ 4): Est. total memory use: 0.1MB (~8192.0MB paged-in)
ltl formula name PolyORBLF-PT-S02J06T10-LTLCardinality-01
ltl formula formula --ltl=/tmp/ltl_1_
pnml2lts-mc( 0/ 4): Loading model from model.pnml
pnml2lts-mc( 0/ 4): Edge label is id
pnml2lts-mc( 0/ 4): Petri net has 844 places, 1812 transitions and 8302 arcs
pnml2lts-mc( 0/ 4): Petri net PolyORBLF-PT-S02J06T10 analyzed
pnml2lts-mc( 0/ 4): There are no safe places
pnml2lts-mc( 0/ 4): Loading Petri net took 0.190 real 0.190 user 0.180 sys
pnml2lts-mc( 3/ 4): LTL layer: formula: /tmp/ltl_1_
pnml2lts-mc( 0/ 4): Weak Buchi automaton detected, adding non-accepting as progress label.
pnml2lts-mc( 0/ 4): There are 859 state labels and 1 edge labels
pnml2lts-mc( 0/ 4): State length is 845, there are 1815 groups
pnml2lts-mc( 0/ 4): Running ufscc using 4 cores
pnml2lts-mc( 0/ 4): Using a tree table with 2^30 elements
pnml2lts-mc( 0/ 4): Successor permutation: dynamic
pnml2lts-mc( 0/ 4): Global bits: 0, count bits: 0, local bits: 0
pnml2lts-mc( 2/ 4):
pnml2lts-mc( 2/ 4): Accepting cycle FOUND at depth ~307!
pnml2lts-mc( 2/ 4):
pnml2lts-mc( 0/ 4):
pnml2lts-mc( 0/ 4): total scc count: 0
pnml2lts-mc( 0/ 4): unique states count: 1079
pnml2lts-mc( 0/ 4): unique transitions count: 2052
pnml2lts-mc( 0/ 4): - self-loop count: 0
pnml2lts-mc( 0/ 4): - claim dead count: 0
pnml2lts-mc( 0/ 4): - claim found count: 1
pnml2lts-mc( 0/ 4): - claim success count: 1088
pnml2lts-mc( 0/ 4): - cum. max stack depth: 1088
pnml2lts-mc( 0/ 4):
pnml2lts-mc( 0/ 4): Explored 1088 states 2085 transitions, fanout: 1.916
pnml2lts-mc( 0/ 4): Total exploration time 0.180 sec (0.170 sec minimum, 0.173 sec on average)
pnml2lts-mc( 0/ 4): States per second: 6044, Transitions per second: 11583
pnml2lts-mc( 0/ 4):
pnml2lts-mc( 0/ 4): Queue width: 12B, total height: 0, memory: 0.00MB
pnml2lts-mc( 0/ 4): Tree memory: 0.1MB, 52.6 B/state, compr.: 1.6%
pnml2lts-mc( 0/ 4): Tree fill ratio (roots/leafs): 0.0%/0.0%
pnml2lts-mc( 0/ 4): Stored 1842 string chucks using 0MB
pnml2lts-mc( 0/ 4): Total memory used for chunk indexing: 0MB
pnml2lts-mc( 0/ 4): Est. total memory use: 0.1MB (~8192.0MB paged-in)
ltl formula name PolyORBLF-PT-S02J06T10-LTLCardinality-02
ltl formula formula --ltl=/tmp/ltl_2_
pnml2lts-mc( 0/ 4): Loading model from model.pnml
pnml2lts-mc( 0/ 4): Edge label is id
pnml2lts-mc( 0/ 4): Petri net has 844 places, 1812 transitions and 8302 arcs
pnml2lts-mc( 0/ 4): Petri net PolyORBLF-PT-S02J06T10 analyzed
pnml2lts-mc( 0/ 4): There are no safe places
pnml2lts-mc( 0/ 4): Loading Petri net took 0.190 real 0.250 user 0.160 sys
pnml2lts-mc( 2/ 4): LTL layer: formula: /tmp/ltl_2_
pnml2lts-mc( 0/ 4): Weak Buchi automaton detected, adding non-accepting as progress label.
pnml2lts-mc( 0/ 4): There are 859 state labels and 1 edge labels
pnml2lts-mc( 0/ 4): State length is 845, there are 1813 groups
pnml2lts-mc( 0/ 4): Running ufscc using 4 cores
pnml2lts-mc( 0/ 4): Using a tree table with 2^30 elements
pnml2lts-mc( 0/ 4): Successor permutation: dynamic
pnml2lts-mc( 0/ 4): Global bits: 0, count bits: 0, local bits: 0
pnml2lts-mc( 2/ 4): ~110 levels ~10000 states ~18788 transitions
pnml2lts-mc( 0/ 4): ~22 levels ~20000 states ~37316 transitions
pnml2lts-mc( 0/ 4): ~22 levels ~40000 states ~76336 transitions
pnml2lts-mc( 0/ 4): ~103 levels ~80000 states ~165348 transitions
pnml2lts-mc( 1/ 4): ~114 levels ~160000 states ~305564 transitions
pnml2lts-mc( 1/ 4): ~114 levels ~320000 states ~621240 transitions
pnml2lts-mc( 1/ 4): ~121 levels ~640000 states ~1254328 transitions
pnml2lts-mc( 1/ 4): ~121 levels ~1280000 states ~2545176 transitions
ltl formula name PolyORBLF-PT-S02J06T10-LTLCardinality-03
ltl formula formula --ltl=/tmp/ltl_3_
pnml2lts-mc( 0/ 4): Loading model from model.pnml
pnml2lts-mc( 0/ 4): Edge label is id
pnml2lts-mc( 0/ 4): Petri net has 844 places, 1812 transitions and 8302 arcs
pnml2lts-mc( 0/ 4): Petri net PolyORBLF-PT-S02J06T10 analyzed
pnml2lts-mc( 0/ 4): There are no safe places
pnml2lts-mc( 0/ 4): Loading Petri net took 0.170 real 0.240 user 0.140 sys
pnml2lts-mc( 1/ 4): LTL layer: formula: /tmp/ltl_3_
pnml2lts-mc( 0/ 4): There are 858 state labels and 1 edge labels
pnml2lts-mc( 0/ 4): State length is 845, there are 1827 groups
pnml2lts-mc( 0/ 4): Running ufscc using 4 cores
pnml2lts-mc( 0/ 4): Using a tree table with 2^30 elements
pnml2lts-mc( 0/ 4): Successor permutation: dynamic
pnml2lts-mc( 0/ 4): Global bits: 0, count bits: 0, local bits: 0
pnml2lts-mc( 0/ 4):
pnml2lts-mc( 0/ 4): Accepting cycle FOUND at depth ~467!
pnml2lts-mc( 0/ 4):
pnml2lts-mc( 0/ 4):
pnml2lts-mc( 0/ 4): total scc count: 0
pnml2lts-mc( 0/ 4): unique states count: 2196
pnml2lts-mc( 0/ 4): unique transitions count: 4623
pnml2lts-mc( 0/ 4): - self-loop count: 0
pnml2lts-mc( 0/ 4): - claim dead count: 0
pnml2lts-mc( 0/ 4): - claim found count: 2
pnml2lts-mc( 0/ 4): - claim success count: 2209
pnml2lts-mc( 0/ 4): - cum. max stack depth: 2209
pnml2lts-mc( 0/ 4):
pnml2lts-mc( 0/ 4): Explored 2209 states 4686 transitions, fanout: 2.121
pnml2lts-mc( 0/ 4): Total exploration time 0.450 sec (0.440 sec minimum, 0.442 sec on average)
pnml2lts-mc( 0/ 4): States per second: 4909, Transitions per second: 10413
pnml2lts-mc( 0/ 4):
pnml2lts-mc( 0/ 4): Queue width: 12B, total height: 0, memory: 0.00MB
pnml2lts-mc( 0/ 4): Tree memory: 0.2MB, 48.5 B/state, compr.: 1.4%
pnml2lts-mc( 0/ 4): Tree fill ratio (roots/leafs): 0.0%/0.0%
pnml2lts-mc( 0/ 4): Stored 1842 string chucks using 0MB
pnml2lts-mc( 0/ 4): Total memory used for chunk indexing: 0MB
pnml2lts-mc( 0/ 4): Est. total memory use: 0.2MB (~8192.0MB paged-in)
ltl formula name PolyORBLF-PT-S02J06T10-LTLCardinality-04
ltl formula formula --ltl=/tmp/ltl_4_
pnml2lts-mc( 0/ 4): Loading model from model.pnml
pnml2lts-mc( 0/ 4): Edge label is id
pnml2lts-mc( 0/ 4): Petri net has 844 places, 1812 transitions and 8302 arcs
pnml2lts-mc( 0/ 4): Petri net PolyORBLF-PT-S02J06T10 analyzed
pnml2lts-mc( 0/ 4): There are no safe places
pnml2lts-mc( 0/ 4): Loading Petri net took 0.180 real 0.240 user 0.160 sys
pnml2lts-mc( 1/ 4): LTL layer: formula: /tmp/ltl_4_
pnml2lts-mc( 0/ 4): Weak Buchi automaton detected, adding non-accepting as progress label.
pnml2lts-mc( 0/ 4): There are 859 state labels and 1 edge labels
pnml2lts-mc( 0/ 4): State length is 845, there are 1814 groups
pnml2lts-mc( 0/ 4): Running ufscc using 4 cores
pnml2lts-mc( 0/ 4): Using a tree table with 2^30 elements
pnml2lts-mc( 0/ 4): Successor permutation: dynamic
pnml2lts-mc( 0/ 4): Global bits: 0, count bits: 0, local bits: 0
pnml2lts-mc( 0/ 4):
pnml2lts-mc( 0/ 4): total scc count: 3
pnml2lts-mc( 0/ 4): unique states count: 3
pnml2lts-mc( 0/ 4): unique transitions count: 2
pnml2lts-mc( 0/ 4): - self-loop count: 0
pnml2lts-mc( 0/ 4): - claim dead count: 0
pnml2lts-mc( 0/ 4): - claim found count: 0
pnml2lts-mc( 0/ 4): - claim success count: 11
pnml2lts-mc( 0/ 4): - cum. max stack depth: 8
pnml2lts-mc( 0/ 4):
pnml2lts-mc( 0/ 4): Explored 11 states 12 transitions, fanout: 1.091
pnml2lts-mc( 0/ 4): Total exploration time 0.010 sec (0.010 sec minimum, 0.010 sec on average)
pnml2lts-mc( 0/ 4): States per second: 1100, Transitions per second: 1200
pnml2lts-mc( 0/ 4):
pnml2lts-mc( 0/ 4): Queue width: 12B, total height: 0, memory: 0.00MB
pnml2lts-mc( 0/ 4): Tree memory: 0.0MB, 384.0 B/state, compr.: 11.4%
pnml2lts-mc( 0/ 4): Tree fill ratio (roots/leafs): 0.0%/0.0%
pnml2lts-mc( 0/ 4): Stored 1842 string chucks using 0MB
pnml2lts-mc( 0/ 4): Total memory used for chunk indexing: 0MB
pnml2lts-mc( 0/ 4): Est. total memory use: 0.0MB (~8192.0MB paged-in)
ltl formula name PolyORBLF-PT-S02J06T10-LTLCardinality-05
ltl formula formula --ltl=/tmp/ltl_5_
pnml2lts-mc( 0/ 4): Loading model from model.pnml
pnml2lts-mc( 0/ 4): Edge label is id
pnml2lts-mc( 0/ 4): Petri net has 844 places, 1812 transitions and 8302 arcs
pnml2lts-mc( 0/ 4): Petri net PolyORBLF-PT-S02J06T10 analyzed
pnml2lts-mc( 0/ 4): There are no safe places
pnml2lts-mc( 0/ 4): Loading Petri net took 0.180 real 0.210 user 0.190 sys
pnml2lts-mc( 3/ 4): LTL layer: formula: /tmp/ltl_5_
pnml2lts-mc( 0/ 4): Weak Buchi automaton detected, adding non-accepting as progress label.
pnml2lts-mc( 0/ 4): There are 859 state labels and 1 edge labels
pnml2lts-mc( 0/ 4): State length is 845, there are 1814 groups
pnml2lts-mc( 0/ 4): Running ufscc using 4 cores
pnml2lts-mc( 0/ 4): Using a tree table with 2^30 elements
pnml2lts-mc( 0/ 4): Successor permutation: dynamic
pnml2lts-mc( 0/ 4): Global bits: 0, count bits: 0, local bits: 0
pnml2lts-mc( 3/ 4):
pnml2lts-mc( 3/ 4): Accepting cycle FOUND at depth ~455!
pnml2lts-mc( 3/ 4):
pnml2lts-mc( 0/ 4):
pnml2lts-mc( 0/ 4): total scc count: 0
pnml2lts-mc( 0/ 4): unique states count: 1364
pnml2lts-mc( 0/ 4): unique transitions count: 2895
pnml2lts-mc( 0/ 4): - self-loop count: 0
pnml2lts-mc( 0/ 4): - claim dead count: 0
pnml2lts-mc( 0/ 4): - claim found count: 2
pnml2lts-mc( 0/ 4): - claim success count: 1379
pnml2lts-mc( 0/ 4): - cum. max stack depth: 1379
pnml2lts-mc( 0/ 4):
pnml2lts-mc( 0/ 4): Explored 1379 states 2939 transitions, fanout: 2.131
pnml2lts-mc( 0/ 4): Total exploration time 0.270 sec (0.260 sec minimum, 0.262 sec on average)
pnml2lts-mc( 0/ 4): States per second: 5107, Transitions per second: 10885
pnml2lts-mc( 0/ 4):
pnml2lts-mc( 0/ 4): Queue width: 12B, total height: 0, memory: 0.00MB
pnml2lts-mc( 0/ 4): Tree memory: 0.1MB, 49.6 B/state, compr.: 1.5%
pnml2lts-mc( 0/ 4): Tree fill ratio (roots/leafs): 0.0%/0.0%
pnml2lts-mc( 0/ 4): Stored 1842 string chucks using 0MB
pnml2lts-mc( 0/ 4): Total memory used for chunk indexing: 0MB
pnml2lts-mc( 0/ 4): Est. total memory use: 0.1MB (~8192.0MB paged-in)
ltl formula name PolyORBLF-PT-S02J06T10-LTLCardinality-06
ltl formula formula --ltl=/tmp/ltl_6_
pnml2lts-mc( 0/ 4): Loading model from model.pnml
pnml2lts-mc( 0/ 4): Edge label is id
pnml2lts-mc( 0/ 4): Petri net has 844 places, 1812 transitions and 8302 arcs
pnml2lts-mc( 0/ 4): Petri net PolyORBLF-PT-S02J06T10 analyzed
pnml2lts-mc( 0/ 4): There are no safe places
pnml2lts-mc( 0/ 4): Loading Petri net took 0.170 real 0.180 user 0.200 sys
pnml2lts-mc( 1/ 4): LTL layer: formula: /tmp/ltl_6_
pnml2lts-mc( 0/ 4): There are 858 state labels and 1 edge labels
pnml2lts-mc( 0/ 4): State length is 845, there are 1816 groups
pnml2lts-mc( 0/ 4): Running ufscc using 4 cores
pnml2lts-mc( 0/ 4): Using a tree table with 2^30 elements
pnml2lts-mc( 0/ 4): Successor permutation: dynamic
pnml2lts-mc( 0/ 4): Global bits: 0, count bits: 0, local bits: 0
pnml2lts-mc( 1/ 4):
pnml2lts-mc( 1/ 4): Accepting cycle FOUND at depth ~548!
pnml2lts-mc( 1/ 4):
pnml2lts-mc( 0/ 4):
pnml2lts-mc( 0/ 4): total scc count: 0
pnml2lts-mc( 0/ 4): unique states count: 1619
pnml2lts-mc( 0/ 4): unique transitions count: 3308
pnml2lts-mc( 0/ 4): - self-loop count: 0
pnml2lts-mc( 0/ 4): - claim dead count: 0
pnml2lts-mc( 0/ 4): - claim found count: 2
pnml2lts-mc( 0/ 4): - claim success count: 1628
pnml2lts-mc( 0/ 4): - cum. max stack depth: 1628
pnml2lts-mc( 0/ 4):
pnml2lts-mc( 0/ 4): Explored 1628 states 3341 transitions, fanout: 2.052
pnml2lts-mc( 0/ 4): Total exploration time 0.310 sec (0.310 sec minimum, 0.310 sec on average)
pnml2lts-mc( 0/ 4): States per second: 5252, Transitions per second: 10777
pnml2lts-mc( 0/ 4):
pnml2lts-mc( 0/ 4): Queue width: 12B, total height: 0, memory: 0.00MB
pnml2lts-mc( 0/ 4): Tree memory: 0.2MB, 49.9 B/state, compr.: 1.5%
pnml2lts-mc( 0/ 4): Tree fill ratio (roots/leafs): 0.0%/0.0%
pnml2lts-mc( 0/ 4): Stored 1842 string chucks using 0MB
pnml2lts-mc( 0/ 4): Total memory used for chunk indexing: 0MB
pnml2lts-mc( 0/ 4): Est. total memory use: 0.2MB (~8192.0MB paged-in)
ltl formula name PolyORBLF-PT-S02J06T10-LTLCardinality-07
ltl formula formula --ltl=/tmp/ltl_7_
pnml2lts-mc( 0/ 4): Loading model from model.pnml
pnml2lts-mc( 0/ 4): Edge label is id
pnml2lts-mc( 0/ 4): Petri net has 844 places, 1812 transitions and 8302 arcs
pnml2lts-mc( 0/ 4): Petri net PolyORBLF-PT-S02J06T10 analyzed
pnml2lts-mc( 0/ 4): There are no safe places
pnml2lts-mc( 0/ 4): Loading Petri net took 0.170 real 0.220 user 0.170 sys
pnml2lts-mc( 3/ 4): LTL layer: formula: /tmp/ltl_7_
pnml2lts-mc( 0/ 4): Weak Buchi automaton detected, adding non-accepting as progress label.
pnml2lts-mc( 0/ 4): There are 859 state labels and 1 edge labels
pnml2lts-mc( 0/ 4): State length is 845, there are 1813 groups
pnml2lts-mc( 0/ 4): Running ufscc using 4 cores
pnml2lts-mc( 0/ 4): Using a tree table with 2^30 elements
pnml2lts-mc( 0/ 4): Successor permutation: dynamic
pnml2lts-mc( 0/ 4): Global bits: 0, count bits: 0, local bits: 0
pnml2lts-mc( 0/ 4):
pnml2lts-mc( 0/ 4): total scc count: 1
pnml2lts-mc( 0/ 4): unique states count: 1
pnml2lts-mc( 0/ 4): unique transitions count: 0
pnml2lts-mc( 0/ 4): - self-loop count: 0
pnml2lts-mc( 0/ 4): - claim dead count: 0
pnml2lts-mc( 0/ 4): - claim found count: 0
pnml2lts-mc( 0/ 4): - claim success count: 4
pnml2lts-mc( 0/ 4): - cum. max stack depth: 4
pnml2lts-mc( 0/ 4):
pnml2lts-mc( 0/ 4): Explored 4 states 4 transitions, fanout: 1.000
pnml2lts-mc( 0/ 4): Total exploration time 0.000 sec (0.000 sec minimum, 0.000 sec on average)
pnml2lts-mc( 0/ 4): States per second: inf, Transitions per second: inf
pnml2lts-mc( 0/ 4):
pnml2lts-mc( 0/ 4): Queue width: 12B, total height: 0, memory: 0.00MB
pnml2lts-mc( 0/ 4): Tree memory: 0.0MB, 800.0 B/state, compr.: 23.7%
pnml2lts-mc( 0/ 4): Tree fill ratio (roots/leafs): 0.0%/0.0%
pnml2lts-mc( 0/ 4): Stored 1842 string chucks using 0MB
pnml2lts-mc( 0/ 4): Total memory used for chunk indexing: 0MB
pnml2lts-mc( 0/ 4): Est. total memory use: 0.0MB (~8192.0MB paged-in)
ltl formula name PolyORBLF-PT-S02J06T10-LTLCardinality-08
ltl formula formula --ltl=/tmp/ltl_8_
pnml2lts-mc( 0/ 4): Loading model from model.pnml
pnml2lts-mc( 0/ 4): Edge label is id
pnml2lts-mc( 0/ 4): Petri net has 844 places, 1812 transitions and 8302 arcs
pnml2lts-mc( 0/ 4): Petri net PolyORBLF-PT-S02J06T10 analyzed
pnml2lts-mc( 0/ 4): There are no safe places
pnml2lts-mc( 0/ 4): Loading Petri net took 0.200 real 0.280 user 0.170 sys
pnml2lts-mc( 0/ 4): LTL layer: formula: /tmp/ltl_8_
pnml2lts-mc( 0/ 4): buchi has 2 states
pnml2lts-mc( 0/ 4): Weak Buchi automaton detected, adding non-accepting as progress label.
pnml2lts-mc( 0/ 4): There are 859 state labels and 1 edge labels
pnml2lts-mc( 0/ 4): State length is 845, there are 1815 groups
pnml2lts-mc( 0/ 4): Running ufscc using 4 cores
pnml2lts-mc( 0/ 4): Using a tree table with 2^30 elements
pnml2lts-mc( 0/ 4): Successor permutation: dynamic
pnml2lts-mc( 0/ 4): Global bits: 0, count bits: 0, local bits: 0
pnml2lts-mc( 0/ 4): ~2458 levels ~10000 states ~21876 transitions
pnml2lts-mc( 0/ 4): ~4828 levels ~20000 states ~42316 transitions
pnml2lts-mc( 1/ 4): ~8183 levels ~40000 states ~65080 transitions
pnml2lts-mc( 1/ 4): ~16055 levels ~80000 states ~132028 transitions
pnml2lts-mc( 1/ 4): ~31428 levels ~160000 states ~262800 transitions
pnml2lts-mc( 3/ 4):
pnml2lts-mc( 3/ 4): Accepting cycle FOUND at depth ~39699!
pnml2lts-mc( 3/ 4):
pnml2lts-mc( 0/ 4):
pnml2lts-mc( 0/ 4): total scc count: 504
pnml2lts-mc( 0/ 4): unique states count: 192869
pnml2lts-mc( 0/ 4): unique transitions count: 368376
pnml2lts-mc( 0/ 4): - self-loop count: 42
pnml2lts-mc( 0/ 4): - claim dead count: 0
pnml2lts-mc( 0/ 4): - claim found count: 15351
pnml2lts-mc( 0/ 4): - claim success count: 192893
pnml2lts-mc( 0/ 4): - cum. max stack depth: 164347
pnml2lts-mc( 0/ 4):
pnml2lts-mc( 0/ 4): Explored 192894 states 368451 transitions, fanout: 1.910
pnml2lts-mc( 0/ 4): Total exploration time 21.910 sec (21.910 sec minimum, 21.910 sec on average)
pnml2lts-mc( 0/ 4): States per second: 8804, Transitions per second: 16817
pnml2lts-mc( 0/ 4):
pnml2lts-mc( 0/ 4): Queue width: 12B, total height: 0, memory: 0.00MB
pnml2lts-mc( 0/ 4): Tree memory: 7.8MB, 24.0 B/state, compr.: 0.7%
pnml2lts-mc( 0/ 4): Tree fill ratio (roots/leafs): 0.0%/0.0%
pnml2lts-mc( 0/ 4): Stored 1842 string chucks using 0MB
pnml2lts-mc( 0/ 4): Total memory used for chunk indexing: 0MB
pnml2lts-mc( 0/ 4): Est. total memory use: 7.8MB (~8192.0MB paged-in)
ltl formula name PolyORBLF-PT-S02J06T10-LTLCardinality-09
ltl formula formula --ltl=/tmp/ltl_9_
pnml2lts-mc( 0/ 4): Loading model from model.pnml
pnml2lts-mc( 0/ 4): Edge label is id
pnml2lts-mc( 0/ 4): Petri net has 844 places, 1812 transitions and 8302 arcs
pnml2lts-mc( 0/ 4): Petri net PolyORBLF-PT-S02J06T10 analyzed
pnml2lts-mc( 0/ 4): There are no safe places
pnml2lts-mc( 0/ 4): Loading Petri net took 0.410 real 0.300 user 0.350 sys
pnml2lts-mc( 0/ 4): LTL layer: formula: /tmp/ltl_9_
pnml2lts-mc( 0/ 4): buchi has 3 states
pnml2lts-mc( 0/ 4): Weak Buchi automaton detected, adding non-accepting as progress label.
pnml2lts-mc( 0/ 4): There are 859 state labels and 1 edge labels
pnml2lts-mc( 0/ 4): State length is 845, there are 1815 groups
pnml2lts-mc( 0/ 4): Running ufscc using 4 cores
pnml2lts-mc( 0/ 4): Using a tree table with 2^30 elements
pnml2lts-mc( 0/ 4): Successor permutation: dynamic
pnml2lts-mc( 0/ 4): Global bits: 0, count bits: 0, local bits: 0
pnml2lts-mc( 0/ 4):
pnml2lts-mc( 0/ 4): total scc count: 3
pnml2lts-mc( 0/ 4): unique states count: 3
pnml2lts-mc( 0/ 4): unique transitions count: 2
pnml2lts-mc( 0/ 4): - self-loop count: 0
pnml2lts-mc( 0/ 4): - claim dead count: 1
pnml2lts-mc( 0/ 4): - claim found count: 0
pnml2lts-mc( 0/ 4): - claim success count: 8
pnml2lts-mc( 0/ 4): - cum. max stack depth: 8
pnml2lts-mc( 0/ 4):
pnml2lts-mc( 0/ 4): Explored 8 states 12 transitions, fanout: 1.500
pnml2lts-mc( 0/ 4): Total exploration time 0.000 sec (0.000 sec minimum, 0.000 sec on average)
pnml2lts-mc( 0/ 4): States per second: inf, Transitions per second: inf
pnml2lts-mc( 0/ 4):
pnml2lts-mc( 0/ 4): Queue width: 12B, total height: 0, memory: 0.00MB
pnml2lts-mc( 0/ 4): Tree memory: 0.0MB, 384.0 B/state, compr.: 11.4%
pnml2lts-mc( 0/ 4): Tree fill ratio (roots/leafs): 0.0%/0.0%
pnml2lts-mc( 0/ 4): Stored 1842 string chucks using 0MB
pnml2lts-mc( 0/ 4): Total memory used for chunk indexing: 0MB
pnml2lts-mc( 0/ 4): Est. total memory use: 0.0MB (~8192.0MB paged-in)
ltl formula name PolyORBLF-PT-S02J06T10-LTLCardinality-10
ltl formula formula --ltl=/tmp/ltl_10_
pnml2lts-mc( 0/ 4): Loading model from model.pnml
pnml2lts-mc( 0/ 4): Edge label is id
pnml2lts-mc( 0/ 4): Petri net has 844 places, 1812 transitions and 8302 arcs
pnml2lts-mc( 0/ 4): Petri net PolyORBLF-PT-S02J06T10 analyzed
pnml2lts-mc( 0/ 4): There are no safe places
pnml2lts-mc( 0/ 4): Loading Petri net took 0.220 real 0.260 user 0.180 sys
pnml2lts-mc( 1/ 4): LTL layer: formula: /tmp/ltl_10_
pnml2lts-mc( 0/ 4): Weak Buchi automaton detected, adding non-accepting as progress label.
pnml2lts-mc( 0/ 4): There are 859 state labels and 1 edge labels
pnml2lts-mc( 0/ 4): State length is 845, there are 1820 groups
pnml2lts-mc( 0/ 4): Running ufscc using 4 cores
pnml2lts-mc( 0/ 4): Using a tree table with 2^30 elements
pnml2lts-mc( 0/ 4): Successor permutation: dynamic
pnml2lts-mc( 0/ 4): Global bits: 0, count bits: 0, local bits: 0
pnml2lts-mc( 2/ 4): ~2403 levels ~10000 states ~43420 transitions
pnml2lts-mc( 2/ 4): ~4417 levels ~20000 states ~75832 transitions
pnml2lts-mc( 2/ 4): ~8323 levels ~40000 states ~148972 transitions
pnml2lts-mc( 2/ 4): ~17782 levels ~80000 states ~312560 transitions
pnml2lts-mc( 2/ 4): ~34279 levels ~160000 states ~599224 transitions
pnml2lts-mc( 2/ 4): ~60444 levels ~320000 states ~1135796 transitions
pnml2lts-mc( 2/ 4): ~111150 levels ~640000 states ~2216200 transitions
pnml2lts-mc( 3/ 4): ~249345 levels ~1280000 states ~4984572 transitions
ltl formula name PolyORBLF-PT-S02J06T10-LTLCardinality-11
ltl formula formula --ltl=/tmp/ltl_11_
pnml2lts-mc( 0/ 4): Loading model from model.pnml
pnml2lts-mc( 0/ 4): Edge label is id
pnml2lts-mc( 0/ 4): Petri net has 844 places, 1812 transitions and 8302 arcs
pnml2lts-mc( 0/ 4): Petri net PolyORBLF-PT-S02J06T10 analyzed
pnml2lts-mc( 0/ 4): There are no safe places
pnml2lts-mc( 0/ 4): Loading Petri net took 0.400 real 0.330 user 0.280 sys
pnml2lts-mc( 2/ 4): LTL layer: formula: /tmp/ltl_11_
pnml2lts-mc( 0/ 4): There are 858 state labels and 1 edge labels
pnml2lts-mc( 0/ 4): State length is 845, there are 1821 groups
pnml2lts-mc( 0/ 4): Running ufscc using 4 cores
pnml2lts-mc( 0/ 4): Using a tree table with 2^30 elements
pnml2lts-mc( 0/ 4): Successor permutation: dynamic
pnml2lts-mc( 0/ 4): Global bits: 0, count bits: 0, local bits: 0
pnml2lts-mc( 0/ 4):
pnml2lts-mc( 0/ 4): total scc count: 5
pnml2lts-mc( 0/ 4): unique states count: 5
pnml2lts-mc( 0/ 4): unique transitions count: 4
pnml2lts-mc( 0/ 4): - self-loop count: 0
pnml2lts-mc( 0/ 4): - claim dead count: 3
pnml2lts-mc( 0/ 4): - claim found count: 0
pnml2lts-mc( 0/ 4): - claim success count: 15
pnml2lts-mc( 0/ 4): - cum. max stack depth: 8
pnml2lts-mc( 0/ 4):
pnml2lts-mc( 0/ 4): Explored 15 states 20 transitions, fanout: 1.333
pnml2lts-mc( 0/ 4): Total exploration time 0.000 sec (0.000 sec minimum, 0.000 sec on average)
pnml2lts-mc( 0/ 4): States per second: inf, Transitions per second: inf
pnml2lts-mc( 0/ 4):
pnml2lts-mc( 0/ 4): Queue width: 12B, total height: 0, memory: 0.00MB
pnml2lts-mc( 0/ 4): Tree memory: 0.0MB, 248.0 B/state, compr.: 7.3%
pnml2lts-mc( 0/ 4): Tree fill ratio (roots/leafs): 0.0%/0.0%
pnml2lts-mc( 0/ 4): Stored 1842 string chucks using 0MB
pnml2lts-mc( 0/ 4): Total memory used for chunk indexing: 0MB
pnml2lts-mc( 0/ 4): Est. total memory use: 0.0MB (~8192.0MB paged-in)
ltl formula name PolyORBLF-PT-S02J06T10-LTLCardinality-12
ltl formula formula --ltl=/tmp/ltl_12_
pnml2lts-mc( 0/ 4): Loading model from model.pnml
pnml2lts-mc( 0/ 4): Edge label is id
pnml2lts-mc( 0/ 4): Petri net has 844 places, 1812 transitions and 8302 arcs
pnml2lts-mc( 0/ 4): Petri net PolyORBLF-PT-S02J06T10 analyzed
pnml2lts-mc( 0/ 4): There are no safe places
pnml2lts-mc( 0/ 4): Loading Petri net took 0.260 real 0.320 user 0.220 sys
pnml2lts-mc( 0/ 4): LTL layer: formula: /tmp/ltl_12_
pnml2lts-mc( 0/ 4): buchi has 2 states
pnml2lts-mc( 0/ 4): Weak Buchi automaton detected, adding non-accepting as progress label.
pnml2lts-mc( 0/ 4): There are 859 state labels and 1 edge labels
pnml2lts-mc( 0/ 4): State length is 845, there are 1814 groups
pnml2lts-mc( 0/ 4): Running ufscc using 4 cores
pnml2lts-mc( 0/ 4): Using a tree table with 2^30 elements
pnml2lts-mc( 0/ 4): Successor permutation: dynamic
pnml2lts-mc( 0/ 4): Global bits: 0, count bits: 0, local bits: 0
pnml2lts-mc( 0/ 4):
pnml2lts-mc( 0/ 4): total scc count: 1
pnml2lts-mc( 0/ 4): unique states count: 1
pnml2lts-mc( 0/ 4): unique transitions count: 0
pnml2lts-mc( 0/ 4): - self-loop count: 0
pnml2lts-mc( 0/ 4): - claim dead count: 0
pnml2lts-mc( 0/ 4): - claim found count: 0
pnml2lts-mc( 0/ 4): - claim success count: 4
pnml2lts-mc( 0/ 4): - cum. max stack depth: 4
pnml2lts-mc( 0/ 4):
pnml2lts-mc( 0/ 4): Explored 4 states 4 transitions, fanout: 1.000
pnml2lts-mc( 0/ 4): Total exploration time 0.000 sec (0.000 sec minimum, 0.000 sec on average)
pnml2lts-mc( 0/ 4): States per second: inf, Transitions per second: inf
pnml2lts-mc( 0/ 4):
pnml2lts-mc( 0/ 4): Queue width: 12B, total height: 0, memory: 0.00MB
pnml2lts-mc( 0/ 4): Tree memory: 0.0MB, 800.0 B/state, compr.: 23.7%
pnml2lts-mc( 0/ 4): Tree fill ratio (roots/leafs): 0.0%/0.0%
pnml2lts-mc( 0/ 4): Stored 1842 string chucks using 0MB
pnml2lts-mc( 0/ 4): Total memory used for chunk indexing: 0MB
pnml2lts-mc( 0/ 4): Est. total memory use: 0.0MB (~8192.0MB paged-in)
ltl formula name PolyORBLF-PT-S02J06T10-LTLCardinality-13
ltl formula formula --ltl=/tmp/ltl_13_
pnml2lts-mc( 0/ 4): Loading model from model.pnml
pnml2lts-mc( 0/ 4): Edge label is id
pnml2lts-mc( 0/ 4): Petri net has 844 places, 1812 transitions and 8302 arcs
pnml2lts-mc( 0/ 4): Petri net PolyORBLF-PT-S02J06T10 analyzed
pnml2lts-mc( 0/ 4): There are no safe places
pnml2lts-mc( 0/ 4): Loading Petri net took 0.300 real 0.260 user 0.230 sys
pnml2lts-mc( 3/ 4): LTL layer: formula: /tmp/ltl_13_
pnml2lts-mc( 0/ 4): Weak Buchi automaton detected, adding non-accepting as progress label.
pnml2lts-mc( 0/ 4): There are 859 state labels and 1 edge labels
pnml2lts-mc( 0/ 4): State length is 845, there are 1816 groups
pnml2lts-mc( 0/ 4): Running ufscc using 4 cores
pnml2lts-mc( 0/ 4): Using a tree table with 2^30 elements
pnml2lts-mc( 0/ 4): Successor permutation: dynamic
pnml2lts-mc( 0/ 4): Global bits: 0, count bits: 0, local bits: 0
pnml2lts-mc( 0/ 4):
pnml2lts-mc( 0/ 4): Accepting cycle FOUND at depth ~498!
pnml2lts-mc( 0/ 4):
pnml2lts-mc( 0/ 4):
pnml2lts-mc( 0/ 4): total scc count: 0
pnml2lts-mc( 0/ 4): unique states count: 1438
pnml2lts-mc( 0/ 4): unique transitions count: 3140
pnml2lts-mc( 0/ 4): - self-loop count: 0
pnml2lts-mc( 0/ 4): - claim dead count: 0
pnml2lts-mc( 0/ 4): - claim found count: 4
pnml2lts-mc( 0/ 4): - claim success count: 1446
pnml2lts-mc( 0/ 4): - cum. max stack depth: 1446
pnml2lts-mc( 0/ 4):
pnml2lts-mc( 0/ 4): Explored 1446 states 3163 transitions, fanout: 2.187
pnml2lts-mc( 0/ 4): Total exploration time 0.300 sec (0.300 sec minimum, 0.300 sec on average)
pnml2lts-mc( 0/ 4): States per second: 4820, Transitions per second: 10543
pnml2lts-mc( 0/ 4):
pnml2lts-mc( 0/ 4): Queue width: 12B, total height: 0, memory: 0.00MB
pnml2lts-mc( 0/ 4): Tree memory: 0.1MB, 48.9 B/state, compr.: 1.4%
pnml2lts-mc( 0/ 4): Tree fill ratio (roots/leafs): 0.0%/0.0%
pnml2lts-mc( 0/ 4): Stored 1842 string chucks using 0MB
pnml2lts-mc( 0/ 4): Total memory used for chunk indexing: 0MB
pnml2lts-mc( 0/ 4): Est. total memory use: 0.1MB (~8192.0MB paged-in)
ltl formula name PolyORBLF-PT-S02J06T10-LTLCardinality-14
ltl formula formula --ltl=/tmp/ltl_14_
pnml2lts-mc( 0/ 4): Loading model from model.pnml
pnml2lts-mc( 0/ 4): Edge label is id
pnml2lts-mc( 0/ 4): Petri net has 844 places, 1812 transitions and 8302 arcs
pnml2lts-mc( 0/ 4): Petri net PolyORBLF-PT-S02J06T10 analyzed
pnml2lts-mc( 0/ 4): There are no safe places
pnml2lts-mc( 0/ 4): Loading Petri net took 0.200 real 0.260 user 0.190 sys
pnml2lts-mc( 2/ 4): LTL layer: formula: /tmp/ltl_14_
pnml2lts-mc( 0/ 4): Weak Buchi automaton detected, adding non-accepting as progress label.
pnml2lts-mc( 0/ 4): There are 859 state labels and 1 edge labels
pnml2lts-mc( 0/ 4): State length is 845, there are 1815 groups
pnml2lts-mc( 0/ 4): Running ufscc using 4 cores
pnml2lts-mc( 0/ 4): Using a tree table with 2^30 elements
pnml2lts-mc( 0/ 4): Successor permutation: dynamic
pnml2lts-mc( 0/ 4): Global bits: 0, count bits: 0, local bits: 0
pnml2lts-mc( 2/ 4): ~2424 levels ~10000 states ~20076 transitions
pnml2lts-mc( 2/ 4): ~4471 levels ~20000 states ~35140 transitions
pnml2lts-mc( 2/ 4): ~7834 levels ~40000 states ~65544 transitions
pnml2lts-mc( 2/ 4): ~17135 levels ~80000 states ~144968 transitions
pnml2lts-mc( 2/ 4): ~32429 levels ~160000 states ~275340 transitions
pnml2lts-mc( 2/ 4): ~60641 levels ~320000 states ~536876 transitions
pnml2lts-mc( 2/ 4): ~110121 levels ~640000 states ~1064944 transitions
pnml2lts-mc( 2/ 4): ~225391 levels ~1280000 states ~2252000 transitions
ltl formula name PolyORBLF-PT-S02J06T10-LTLCardinality-15
ltl formula formula --ltl=/tmp/ltl_15_
pnml2lts-mc( 0/ 4): Loading model from model.pnml
pnml2lts-mc( 0/ 4): Edge label is id
pnml2lts-mc( 0/ 4): Petri net has 844 places, 1812 transitions and 8302 arcs
pnml2lts-mc( 0/ 4): Petri net PolyORBLF-PT-S02J06T10 analyzed
pnml2lts-mc( 1/ 4): LTL layer: formula: /tmp/ltl_15_
pnml2lts-mc( 0/ 4): There are no safe places
pnml2lts-mc( 0/ 4): Loading Petri net took 0.390 real 0.250 user 0.330 sys
pnml2lts-mc( 0/ 4): Weak Buchi automaton detected, adding non-accepting as progress label.
pnml2lts-mc( 0/ 4): There are 859 state labels and 1 edge labels
pnml2lts-mc( 0/ 4): State length is 845, there are 1815 groups
pnml2lts-mc( 0/ 4): Running ufscc using 4 cores
pnml2lts-mc( 0/ 4): Using a tree table with 2^30 elements
pnml2lts-mc( 0/ 4): Successor permutation: dynamic
pnml2lts-mc( 0/ 4): Global bits: 0, count bits: 0, local bits: 0
pnml2lts-mc( 2/ 4): ~2449 levels ~10000 states ~19400 transitions
pnml2lts-mc( 2/ 4): ~4741 levels ~20000 states ~35516 transitions
pnml2lts-mc( 2/ 4): ~9013 levels ~40000 states ~67172 transitions
pnml2lts-mc( 2/ 4): ~16897 levels ~80000 states ~129916 transitions
pnml2lts-mc( 2/ 4): ~34170 levels ~160000 states ~272612 transitions
pnml2lts-mc( 2/ 4): ~67422 levels ~320000 states ~565900 transitions
pnml2lts-mc( 2/ 4): ~130730 levels ~640000 states ~1129880 transitions
pnml2lts-mc( 2/ 4): ~252748 levels ~1280000 states ~2289296 transitions
Sequence of Actions to be Executed by the VM
This is useful if one wants to reexecute the tool in the VM from the submitted image disk.
set -x
# this is for BenchKit: configuration of major elements for the test
export BK_INPUT="PolyORBLF-PT-S02J06T10"
export BK_EXAMINATION="LTLCardinality"
export BK_TOOL="ltsmin"
export BK_RESULT_DIR="/tmp/BK_RESULTS/OUTPUTS"
export BK_TIME_CONFINEMENT="3600"
export BK_MEMORY_CONFINEMENT="16384"
# this is specific to your benchmark or test
export BIN_DIR="$HOME/BenchKit/bin"
# remove the execution directoty if it exists (to avoid increse of .vmdk images)
if [ -d execution ] ; then
rm -rf execution
fi
tar xzf /home/mcc/BenchKit/INPUTS/PolyORBLF-PT-S02J06T10.tgz
mv PolyORBLF-PT-S02J06T10 execution
cd execution
pwd
ls -lh
# this is for BenchKit: explicit launching of the test
echo "====================================================================="
echo " Generated by BenchKit 2-3637"
echo " Executing tool ltsmin"
echo " Input is PolyORBLF-PT-S02J06T10, examination is LTLCardinality"
echo " Time confinement is $BK_TIME_CONFINEMENT seconds"
echo " Memory confinement is 16384 MBytes"
echo " Number of cores is 4"
echo " Run identifier is r209-smll-152732259100399"
echo "====================================================================="
echo
echo "--------------------"
echo "content from stdout:"
echo
echo "=== Data for post analysis generated by BenchKit (invocation template)"
echo
if [ "LTLCardinality" = "UpperBounds" ] ; then
echo "The expected result is a vector of positive values"
echo NUM_VECTOR
elif [ "LTLCardinality" != "StateSpace" ] ; then
echo "The expected result is a vector of booleans"
echo BOOL_VECTOR
else
echo "no data necessary for post analysis"
fi
echo
if [ -f "LTLCardinality.txt" ] ; then
echo "here is the order used to build the result vector(from text file)"
for x in $(grep Property LTLCardinality.txt | cut -d ' ' -f 2 | sort -u) ; do
echo "FORMULA_NAME $x"
done
elif [ -f "LTLCardinality.xml" ] ; then # for cunf (txt files deleted;-)
echo echo "here is the order used to build the result vector(from xml file)"
for x in $(grep '
echo "FORMULA_NAME $x"
done
fi
echo
echo "=== Now, execution of the tool begins"
echo
echo -n "BK_START "
date -u +%s%3N
echo
timeout -s 9 $BK_TIME_CONFINEMENT bash -c "/home/mcc/BenchKit/BenchKit_head.sh 2> STDERR ; echo ; echo -n \"BK_STOP \" ; date -u +%s%3N"
if [ $? -eq 137 ] ; then
echo
echo "BK_TIME_CONFINEMENT_REACHED"
fi
echo
echo "--------------------"
echo "content from stderr:"
echo
cat STDERR ;