

About the Execution of LTSMin for JoinFreeModules-PT-0500
| Execution Summary | |||||
| Max Memory Used (MB) |
Time wait (ms) | CPU Usage (ms) | I/O Wait (ms) | Computed Result | Execution Status |
| 13319.750 | 1065578.00 | 4150692.00 | 76.60 | F?F?FFTTFFFTF?FF | normal |
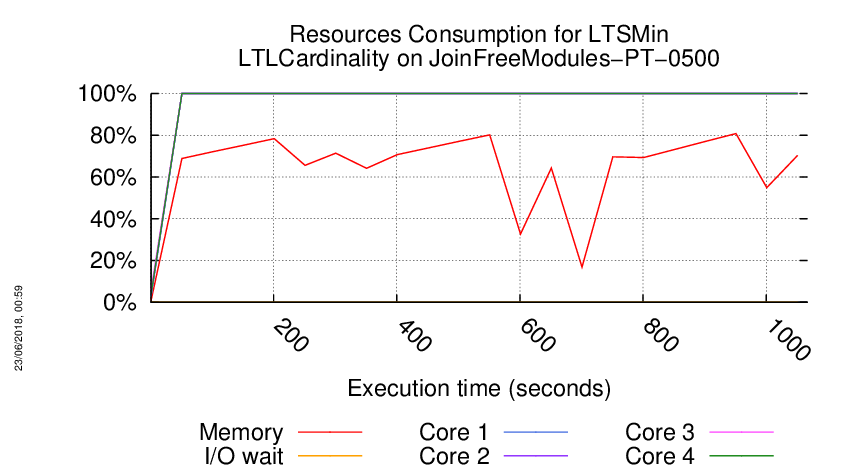
Execution Chart
We display below the execution chart for this examination (boot time has been removed).
Trace from the execution
Waiting for the VM to be ready (probing ssh)
..................
/home/mcc/execution
total 3.0M
-rw-r--r-- 1 mcc users 4.1K May 15 18:54 CTLCardinality.txt
-rw-r--r-- 1 mcc users 23K May 15 18:54 CTLCardinality.xml
-rw-r--r-- 1 mcc users 2.5K May 15 18:54 CTLFireability.txt
-rw-r--r-- 1 mcc users 15K May 15 18:54 CTLFireability.xml
-rw-r--r-- 1 mcc users 4.0K May 15 18:50 GenericPropertiesDefinition.xml
-rw-r--r-- 1 mcc users 5.7K May 15 18:50 GenericPropertiesVerdict.xml
-rw-r--r-- 1 mcc users 2.6K May 26 09:26 LTLCardinality.txt
-rw-r--r-- 1 mcc users 13K May 26 09:26 LTLCardinality.xml
-rw-r--r-- 1 mcc users 2.0K May 26 09:26 LTLFireability.txt
-rw-r--r-- 1 mcc users 9.2K May 26 09:26 LTLFireability.xml
-rw-r--r-- 1 mcc users 2.9K May 15 18:54 ReachabilityCardinality.txt
-rw-r--r-- 1 mcc users 12K May 15 18:54 ReachabilityCardinality.xml
-rw-r--r-- 1 mcc users 114 May 15 18:54 ReachabilityDeadlock.txt
-rw-r--r-- 1 mcc users 352 May 15 18:54 ReachabilityDeadlock.xml
-rw-r--r-- 1 mcc users 3.2K May 15 18:54 ReachabilityFireability.txt
-rw-r--r-- 1 mcc users 20K May 15 18:54 ReachabilityFireability.xml
-rw-r--r-- 1 mcc users 1.7K May 15 18:54 UpperBounds.txt
-rw-r--r-- 1 mcc users 3.8K May 15 18:54 UpperBounds.xml
-rw-r--r-- 1 mcc users 6 May 15 18:50 equiv_col
-rw-r--r-- 1 mcc users 5 May 15 18:50 instance
-rw-r--r-- 1 mcc users 6 May 15 18:50 iscolored
-rw-r--r-- 1 mcc users 2.9M May 15 18:50 model.pnml
=====================================================================
Generated by BenchKit 2-3637
Executing tool ltsmin
Input is JoinFreeModules-PT-0500, examination is LTLCardinality
Time confinement is 3600 seconds
Memory confinement is 16384 MBytes
Number of cores is 4
Run identifier is r209-smll-152732259100343
=====================================================================
--------------------
content from stdout:
=== Data for post analysis generated by BenchKit (invocation template)
The expected result is a vector of booleans
BOOL_VECTOR
here is the order used to build the result vector(from text file)
FORMULA_NAME JoinFreeModules-PT-0500-LTLCardinality-00
FORMULA_NAME JoinFreeModules-PT-0500-LTLCardinality-01
FORMULA_NAME JoinFreeModules-PT-0500-LTLCardinality-02
FORMULA_NAME JoinFreeModules-PT-0500-LTLCardinality-03
FORMULA_NAME JoinFreeModules-PT-0500-LTLCardinality-04
FORMULA_NAME JoinFreeModules-PT-0500-LTLCardinality-05
FORMULA_NAME JoinFreeModules-PT-0500-LTLCardinality-06
FORMULA_NAME JoinFreeModules-PT-0500-LTLCardinality-07
FORMULA_NAME JoinFreeModules-PT-0500-LTLCardinality-08
FORMULA_NAME JoinFreeModules-PT-0500-LTLCardinality-09
FORMULA_NAME JoinFreeModules-PT-0500-LTLCardinality-10
FORMULA_NAME JoinFreeModules-PT-0500-LTLCardinality-11
FORMULA_NAME JoinFreeModules-PT-0500-LTLCardinality-12
FORMULA_NAME JoinFreeModules-PT-0500-LTLCardinality-13
FORMULA_NAME JoinFreeModules-PT-0500-LTLCardinality-14
FORMULA_NAME JoinFreeModules-PT-0500-LTLCardinality-15
=== Now, execution of the tool begins
BK_START 1527387933623
FORMULA JoinFreeModules-PT-0500-LTLCardinality-00 FALSE TECHNIQUES EXPLICIT PARALLEL_PROCESSING USE_NUPN
FORMULA JoinFreeModules-PT-0500-LTLCardinality-01 CANNOT_COMPUTE
FORMULA JoinFreeModules-PT-0500-LTLCardinality-02 FALSE TECHNIQUES EXPLICIT PARALLEL_PROCESSING USE_NUPN
FORMULA JoinFreeModules-PT-0500-LTLCardinality-03 CANNOT_COMPUTE
FORMULA JoinFreeModules-PT-0500-LTLCardinality-04 FALSE TECHNIQUES EXPLICIT PARALLEL_PROCESSING USE_NUPN
FORMULA JoinFreeModules-PT-0500-LTLCardinality-05 FALSE TECHNIQUES EXPLICIT PARALLEL_PROCESSING USE_NUPN
FORMULA JoinFreeModules-PT-0500-LTLCardinality-06 TRUE TECHNIQUES EXPLICIT PARALLEL_PROCESSING USE_NUPN
FORMULA JoinFreeModules-PT-0500-LTLCardinality-07 TRUE TECHNIQUES EXPLICIT PARALLEL_PROCESSING USE_NUPN
FORMULA JoinFreeModules-PT-0500-LTLCardinality-08 FALSE TECHNIQUES EXPLICIT PARALLEL_PROCESSING USE_NUPN
FORMULA JoinFreeModules-PT-0500-LTLCardinality-09 FALSE TECHNIQUES EXPLICIT PARALLEL_PROCESSING USE_NUPN
FORMULA JoinFreeModules-PT-0500-LTLCardinality-10 FALSE TECHNIQUES EXPLICIT PARALLEL_PROCESSING USE_NUPN
FORMULA JoinFreeModules-PT-0500-LTLCardinality-11 TRUE TECHNIQUES EXPLICIT PARALLEL_PROCESSING USE_NUPN
FORMULA JoinFreeModules-PT-0500-LTLCardinality-12 FALSE TECHNIQUES EXPLICIT PARALLEL_PROCESSING USE_NUPN
FORMULA JoinFreeModules-PT-0500-LTLCardinality-13 CANNOT_COMPUTE
FORMULA JoinFreeModules-PT-0500-LTLCardinality-14 FALSE TECHNIQUES EXPLICIT PARALLEL_PROCESSING USE_NUPN
FORMULA JoinFreeModules-PT-0500-LTLCardinality-15 FALSE TECHNIQUES EXPLICIT PARALLEL_PROCESSING USE_NUPN
BK_STOP 1527388999201
--------------------
content from stderr:
mcc2018
ltl formula name JoinFreeModules-PT-0500-LTLCardinality-00
ltl formula formula --ltl=/tmp/ltl_0_
pnml2lts-mc( 0/ 4): Loading model from model.pnml
pnml2lts-mc( 0/ 4): Edge label is id
pnml2lts-mc( 0/ 4): Petri net has 2501 places, 4001 transitions and 11502 arcs
pnml2lts-mc( 0/ 4): Petri net JoinFreeModules-PT-0500 analyzed
pnml2lts-mc( 0/ 4): There are no safe places
pnml2lts-mc( 3/ 4): LTL layer: formula: /tmp/ltl_0_
pnml2lts-mc( 0/ 4): Loading Petri net took 1.290 real 0.530 user 1.870 sys
pnml2lts-mc( 0/ 4): Weak Buchi automaton detected, adding non-accepting as progress label.
pnml2lts-mc( 0/ 4): There are 4503 state labels and 1 edge labels
pnml2lts-mc( 0/ 4): State length is 2502, there are 4002 groups
pnml2lts-mc( 0/ 4): Running ufscc using 4 cores
pnml2lts-mc( 0/ 4): Using a tree table with 2^30 elements
pnml2lts-mc( 0/ 4): Successor permutation: dynamic
pnml2lts-mc( 0/ 4): Global bits: 0, count bits: 0, local bits: 0
pnml2lts-mc( 2/ 4):
pnml2lts-mc( 2/ 4): Accepting cycle FOUND at depth ~1!
pnml2lts-mc( 2/ 4):
pnml2lts-mc( 0/ 4):
pnml2lts-mc( 0/ 4): total scc count: 0
pnml2lts-mc( 0/ 4): unique states count: 1
pnml2lts-mc( 0/ 4): unique transitions count: 1001
pnml2lts-mc( 0/ 4): - self-loop count: 4
pnml2lts-mc( 0/ 4): - claim dead count: 0
pnml2lts-mc( 0/ 4): - claim found count: 0
pnml2lts-mc( 0/ 4): - claim success count: 4
pnml2lts-mc( 0/ 4): - cum. max stack depth: 4
pnml2lts-mc( 0/ 4):
pnml2lts-mc( 0/ 4): Explored 4 states 4008 transitions, fanout: 1002.000
pnml2lts-mc( 0/ 4): Total exploration time 0.180 sec (0.170 sec minimum, 0.175 sec on average)
pnml2lts-mc( 0/ 4): States per second: 22, Transitions per second: 22267
pnml2lts-mc( 0/ 4):
pnml2lts-mc( 0/ 4): Queue width: 12B, total height: 0, memory: 0.00MB
pnml2lts-mc( 0/ 4): Tree memory: 0.0MB, 37.0 B/state, compr.: 0.4%
pnml2lts-mc( 0/ 4): Tree fill ratio (roots/leafs): 0.0%/0.0%
pnml2lts-mc( 0/ 4): Stored 4121 string chucks using 0MB
pnml2lts-mc( 0/ 4): Total memory used for chunk indexing: 0MB
pnml2lts-mc( 0/ 4): Est. total memory use: 0.0MB (~8192.0MB paged-in)
ltl formula name JoinFreeModules-PT-0500-LTLCardinality-01
ltl formula formula --ltl=/tmp/ltl_1_
pnml2lts-mc( 0/ 4): Loading model from model.pnml
pnml2lts-mc( 0/ 4): Edge label is id
pnml2lts-mc( 0/ 4): Petri net has 2501 places, 4001 transitions and 11502 arcs
pnml2lts-mc( 0/ 4): Petri net JoinFreeModules-PT-0500 analyzed
pnml2lts-mc( 0/ 4): There are no safe places
pnml2lts-mc( 0/ 4): Loading Petri net took 1.240 real 0.520 user 2.150 sys
pnml2lts-mc( 0/ 4): LTL layer: formula: /tmp/ltl_1_
pnml2lts-mc( 0/ 4): buchi has 2 states
pnml2lts-mc( 0/ 4): Weak Buchi automaton detected, adding non-accepting as progress label.
pnml2lts-mc( 0/ 4): There are 4503 state labels and 1 edge labels
pnml2lts-mc( 0/ 4): State length is 2502, there are 4004 groups
pnml2lts-mc( 0/ 4): Running ufscc using 4 cores
pnml2lts-mc( 0/ 4): Using a tree table with 2^30 elements
pnml2lts-mc( 0/ 4): Successor permutation: dynamic
pnml2lts-mc( 0/ 4): Global bits: 0, count bits: 0, local bits: 0
pnml2lts-mc( 0/ 4): ~2500 levels ~10000 states ~10034704 transitions
pnml2lts-mc( 0/ 4): ~5000 levels ~20000 states ~20096532 transitions
pnml2lts-mc( 0/ 4): ~10000 levels ~40000 states ~40293260 transitions
pnml2lts-mc( 0/ 4): ~20000 levels ~80000 states ~80788552 transitions
ltl formula name JoinFreeModules-PT-0500-LTLCardinality-02
ltl formula formula --ltl=/tmp/ltl_2_
pnml2lts-mc( 0/ 4): Loading model from model.pnml
pnml2lts-mc( 0/ 4): Edge label is id
pnml2lts-mc( 0/ 4): Petri net has 2501 places, 4001 transitions and 11502 arcs
pnml2lts-mc( 0/ 4): Petri net JoinFreeModules-PT-0500 analyzed
pnml2lts-mc( 0/ 4): There are no safe places
pnml2lts-mc( 0/ 4): Loading Petri net took 1.200 real 0.890 user 1.390 sys
pnml2lts-mc( 1/ 4): LTL layer: formula: /tmp/ltl_2_
pnml2lts-mc( 0/ 4): Weak Buchi automaton detected, adding non-accepting as progress label.
pnml2lts-mc( 0/ 4): There are 4503 state labels and 1 edge labels
pnml2lts-mc( 0/ 4): State length is 2502, there are 4004 groups
pnml2lts-mc( 0/ 4): Running ufscc using 4 cores
pnml2lts-mc( 0/ 4): Using a tree table with 2^30 elements
pnml2lts-mc( 0/ 4): Successor permutation: dynamic
pnml2lts-mc( 0/ 4): Global bits: 0, count bits: 0, local bits: 0
pnml2lts-mc( 2/ 4): ~2500 levels ~10000 states ~20029580 transitions
pnml2lts-mc( 2/ 4): ~5000 levels ~20000 states ~40059412 transitions
pnml2lts-mc( 1/ 4):
pnml2lts-mc( 1/ 4): Accepting cycle FOUND at depth ~9757!
pnml2lts-mc( 1/ 4):
pnml2lts-mc( 0/ 4):
pnml2lts-mc( 0/ 4): total scc count: 0
pnml2lts-mc( 0/ 4): unique states count: 38611
pnml2lts-mc( 0/ 4): unique transitions count: 77294369
pnml2lts-mc( 0/ 4): - self-loop count: 4
pnml2lts-mc( 0/ 4): - claim dead count: 0
pnml2lts-mc( 0/ 4): - claim found count: 1081
pnml2lts-mc( 0/ 4): - claim success count: 38614
pnml2lts-mc( 0/ 4): - cum. max stack depth: 38614
pnml2lts-mc( 0/ 4):
pnml2lts-mc( 0/ 4): Explored 38614 states 77300379 transitions, fanout: 2001.874
pnml2lts-mc( 0/ 4): Total exploration time 94.810 sec (94.800 sec minimum, 94.805 sec on average)
pnml2lts-mc( 0/ 4): States per second: 407, Transitions per second: 815319
pnml2lts-mc( 0/ 4):
pnml2lts-mc( 0/ 4): Queue width: 12B, total height: 0, memory: 0.00MB
pnml2lts-mc( 0/ 4): Tree memory: 1067.6MB, 14.5 B/state, compr.: 0.1%
pnml2lts-mc( 0/ 4): Tree fill ratio (roots/leafs): 7.0%/23.0%
pnml2lts-mc( 0/ 4): Stored 4121 string chucks using 0MB
pnml2lts-mc( 0/ 4): Total memory used for chunk indexing: 0MB
pnml2lts-mc( 0/ 4): Est. total memory use: 1067.6MB (~8192.0MB paged-in)
ltl formula name JoinFreeModules-PT-0500-LTLCardinality-03
ltl formula formula --ltl=/tmp/ltl_3_
pnml2lts-mc( 0/ 4): Loading model from model.pnml
pnml2lts-mc( 0/ 4): Edge label is id
pnml2lts-mc( 0/ 4): Petri net has 2501 places, 4001 transitions and 11502 arcs
pnml2lts-mc( 0/ 4): Petri net JoinFreeModules-PT-0500 analyzed
pnml2lts-mc( 0/ 4): There are no safe places
pnml2lts-mc( 0/ 4): Loading Petri net took 1.010 real 0.590 user 1.090 sys
pnml2lts-mc( 0/ 4): LTL layer: formula: /tmp/ltl_3_
pnml2lts-mc( 0/ 4): buchi has 2 states
pnml2lts-mc( 0/ 4): There are 4502 state labels and 1 edge labels
pnml2lts-mc( 0/ 4): State length is 2502, there are 4005 groups
pnml2lts-mc( 0/ 4): Running ufscc using 4 cores
pnml2lts-mc( 0/ 4): Using a tree table with 2^30 elements
pnml2lts-mc( 0/ 4): Successor permutation: dynamic
pnml2lts-mc( 0/ 4): Global bits: 0, count bits: 0, local bits: 0
pnml2lts-mc( 0/ 4): ~2500 levels ~10000 states ~9992924 transitions
pnml2lts-mc( 1/ 4): ~5000 levels ~20000 states ~19940840 transitions
pnml2lts-mc( 1/ 4): ~10000 levels ~40000 states ~39890392 transitions
pnml2lts-mc( 1/ 4): ~20000 levels ~80000 states ~79842052 transitions
ltl formula name JoinFreeModules-PT-0500-LTLCardinality-04
ltl formula formula --ltl=/tmp/ltl_4_
pnml2lts-mc( 0/ 4): Loading model from model.pnml
pnml2lts-mc( 0/ 4): Edge label is id
pnml2lts-mc( 0/ 4): Petri net has 2501 places, 4001 transitions and 11502 arcs
pnml2lts-mc( 0/ 4): Petri net JoinFreeModules-PT-0500 analyzed
pnml2lts-mc( 0/ 4): There are no safe places
pnml2lts-mc( 3/ 4): LTL layer: formula: /tmp/ltl_4_
pnml2lts-mc( 0/ 4): Loading Petri net took 1.650 real 0.520 user 2.610 sys
pnml2lts-mc( 0/ 4): There are 4502 state labels and 1 edge labels
pnml2lts-mc( 0/ 4): State length is 2502, there are 4012 groups
pnml2lts-mc( 0/ 4): Running ufscc using 4 cores
pnml2lts-mc( 0/ 4): Using a tree table with 2^30 elements
pnml2lts-mc( 0/ 4): Successor permutation: dynamic
pnml2lts-mc( 0/ 4): Global bits: 0, count bits: 0, local bits: 0
pnml2lts-mc( 2/ 4): ~2500 levels ~10000 states ~10015880 transitions
pnml2lts-mc( 0/ 4):
pnml2lts-mc( 0/ 4): Accepting cycle FOUND at depth ~2506!
pnml2lts-mc( 0/ 4):
pnml2lts-mc( 0/ 4):
pnml2lts-mc( 0/ 4): total scc count: 0
pnml2lts-mc( 0/ 4): unique states count: 10293
pnml2lts-mc( 0/ 4): unique transitions count: 10314821
pnml2lts-mc( 0/ 4): - self-loop count: 0
pnml2lts-mc( 0/ 4): - claim dead count: 0
pnml2lts-mc( 0/ 4): - claim found count: 1
pnml2lts-mc( 0/ 4): - claim success count: 10296
pnml2lts-mc( 0/ 4): - cum. max stack depth: 10296
pnml2lts-mc( 0/ 4):
pnml2lts-mc( 0/ 4): Explored 10296 states 10317828 transitions, fanout: 1002.120
pnml2lts-mc( 0/ 4): Total exploration time 27.720 sec (27.710 sec minimum, 27.715 sec on average)
pnml2lts-mc( 0/ 4): States per second: 371, Transitions per second: 372216
pnml2lts-mc( 0/ 4):
pnml2lts-mc( 0/ 4): Queue width: 12B, total height: 0, memory: 0.00MB
pnml2lts-mc( 0/ 4): Tree memory: 170.0MB, 17.3 B/state, compr.: 0.2%
pnml2lts-mc( 0/ 4): Tree fill ratio (roots/leafs): 0.0%/4.0%
pnml2lts-mc( 0/ 4): Stored 4121 string chucks using 0MB
pnml2lts-mc( 0/ 4): Total memory used for chunk indexing: 0MB
pnml2lts-mc( 0/ 4): Est. total memory use: 170.0MB (~8192.0MB paged-in)
ltl formula name JoinFreeModules-PT-0500-LTLCardinality-05
ltl formula formula --ltl=/tmp/ltl_5_
pnml2lts-mc( 0/ 4): Loading model from model.pnml
pnml2lts-mc( 0/ 4): Edge label is id
pnml2lts-mc( 0/ 4): Petri net has 2501 places, 4001 transitions and 11502 arcs
pnml2lts-mc( 0/ 4): Petri net JoinFreeModules-PT-0500 analyzed
pnml2lts-mc( 0/ 4): There are no safe places
pnml2lts-mc( 0/ 4): Loading Petri net took 1.410 real 0.560 user 2.110 sys
pnml2lts-mc( 2/ 4): LTL layer: formula: /tmp/ltl_5_
pnml2lts-mc( 0/ 4): There are 4502 state labels and 1 edge labels
pnml2lts-mc( 0/ 4): State length is 2502, there are 4014 groups
pnml2lts-mc( 0/ 4): Running ufscc using 4 cores
pnml2lts-mc( 0/ 4): Using a tree table with 2^30 elements
pnml2lts-mc( 0/ 4): Successor permutation: dynamic
pnml2lts-mc( 0/ 4): Global bits: 0, count bits: 0, local bits: 0
pnml2lts-mc( 3/ 4):
pnml2lts-mc( 3/ 4): Accepting cycle FOUND at depth ~1!
pnml2lts-mc( 3/ 4):
pnml2lts-mc( 0/ 4):
pnml2lts-mc( 0/ 4): total scc count: 0
pnml2lts-mc( 0/ 4): unique states count: 1
pnml2lts-mc( 0/ 4): unique transitions count: 2002
pnml2lts-mc( 0/ 4): - self-loop count: 4
pnml2lts-mc( 0/ 4): - claim dead count: 0
pnml2lts-mc( 0/ 4): - claim found count: 0
pnml2lts-mc( 0/ 4): - claim success count: 4
pnml2lts-mc( 0/ 4): - cum. max stack depth: 4
pnml2lts-mc( 0/ 4):
pnml2lts-mc( 0/ 4): Explored 4 states 8012 transitions, fanout: 2003.000
pnml2lts-mc( 0/ 4): Total exploration time 0.080 sec (0.080 sec minimum, 0.080 sec on average)
pnml2lts-mc( 0/ 4): States per second: 50, Transitions per second: 100150
pnml2lts-mc( 0/ 4):
pnml2lts-mc( 0/ 4): Queue width: 12B, total height: 0, memory: 0.00MB
pnml2lts-mc( 0/ 4): Tree memory: 0.1MB, 27.7 B/state, compr.: 0.3%
pnml2lts-mc( 0/ 4): Tree fill ratio (roots/leafs): 0.0%/0.0%
pnml2lts-mc( 0/ 4): Stored 4121 string chucks using 0MB
pnml2lts-mc( 0/ 4): Total memory used for chunk indexing: 0MB
pnml2lts-mc( 0/ 4): Est. total memory use: 0.1MB (~8192.0MB paged-in)
ltl formula name JoinFreeModules-PT-0500-LTLCardinality-06
ltl formula formula --ltl=/tmp/ltl_6_
pnml2lts-mc( 0/ 4): Loading model from model.pnml
pnml2lts-mc( 0/ 4): Edge label is id
pnml2lts-mc( 0/ 4): Petri net has 2501 places, 4001 transitions and 11502 arcs
pnml2lts-mc( 0/ 4): Petri net JoinFreeModules-PT-0500 analyzed
pnml2lts-mc( 0/ 4): There are no safe places
pnml2lts-mc( 0/ 4): Loading Petri net took 0.830 real 0.570 user 1.040 sys
pnml2lts-mc( 2/ 4): LTL layer: formula: /tmp/ltl_6_
pnml2lts-mc( 0/ 4): Weak Buchi automaton detected, adding non-accepting as progress label.
pnml2lts-mc( 0/ 4): There are 4503 state labels and 1 edge labels
pnml2lts-mc( 0/ 4): State length is 2502, there are 4007 groups
pnml2lts-mc( 0/ 4): Running ufscc using 4 cores
pnml2lts-mc( 0/ 4): Using a tree table with 2^30 elements
pnml2lts-mc( 0/ 4): Successor permutation: dynamic
pnml2lts-mc( 0/ 4): Global bits: 0, count bits: 0, local bits: 0
pnml2lts-mc( 0/ 4):
pnml2lts-mc( 0/ 4): total scc count: 1
pnml2lts-mc( 0/ 4): unique states count: 1
pnml2lts-mc( 0/ 4): unique transitions count: 0
pnml2lts-mc( 0/ 4): - self-loop count: 0
pnml2lts-mc( 0/ 4): - claim dead count: 0
pnml2lts-mc( 0/ 4): - claim found count: 0
pnml2lts-mc( 0/ 4): - claim success count: 4
pnml2lts-mc( 0/ 4): - cum. max stack depth: 4
pnml2lts-mc( 0/ 4):
pnml2lts-mc( 0/ 4): Explored 4 states 4 transitions, fanout: 1.000
pnml2lts-mc( 0/ 4): Total exploration time 0.010 sec (0.010 sec minimum, 0.010 sec on average)
pnml2lts-mc( 0/ 4): States per second: 400, Transitions per second: 400
pnml2lts-mc( 0/ 4):
pnml2lts-mc( 0/ 4): Queue width: 12B, total height: 0, memory: 0.00MB
pnml2lts-mc( 0/ 4): Tree memory: 0.0MB, 448.0 B/state, compr.: 4.5%
pnml2lts-mc( 0/ 4): Tree fill ratio (roots/leafs): 0.0%/0.0%
pnml2lts-mc( 0/ 4): Stored 4121 string chucks using 0MB
pnml2lts-mc( 0/ 4): Total memory used for chunk indexing: 0MB
pnml2lts-mc( 0/ 4): Est. total memory use: 0.0MB (~8192.0MB paged-in)
ltl formula name JoinFreeModules-PT-0500-LTLCardinality-07
ltl formula formula --ltl=/tmp/ltl_7_
pnml2lts-mc( 0/ 4): Loading model from model.pnml
pnml2lts-mc( 0/ 4): Edge label is id
pnml2lts-mc( 0/ 4): Petri net has 2501 places, 4001 transitions and 11502 arcs
pnml2lts-mc( 0/ 4): Petri net JoinFreeModules-PT-0500 analyzed
pnml2lts-mc( 0/ 4): There are no safe places
pnml2lts-mc( 0/ 4): Loading Petri net took 0.680 real 0.570 user 0.650 sys
pnml2lts-mc( 2/ 4): LTL layer: formula: /tmp/ltl_7_
pnml2lts-mc( 0/ 4): Weak Buchi automaton detected, adding non-accepting as progress label.
pnml2lts-mc( 0/ 4): There are 4503 state labels and 1 edge labels
pnml2lts-mc( 0/ 4): State length is 2502, there are 4002 groups
pnml2lts-mc( 0/ 4): Running ufscc using 4 cores
pnml2lts-mc( 0/ 4): Using a tree table with 2^30 elements
pnml2lts-mc( 0/ 4): Successor permutation: dynamic
pnml2lts-mc( 0/ 4): Global bits: 0, count bits: 0, local bits: 0
pnml2lts-mc( 0/ 4):
pnml2lts-mc( 0/ 4): total scc count: 1
pnml2lts-mc( 0/ 4): unique states count: 1
pnml2lts-mc( 0/ 4): unique transitions count: 0
pnml2lts-mc( 0/ 4): - self-loop count: 0
pnml2lts-mc( 0/ 4): - claim dead count: 0
pnml2lts-mc( 0/ 4): - claim found count: 0
pnml2lts-mc( 0/ 4): - claim success count: 4
pnml2lts-mc( 0/ 4): - cum. max stack depth: 4
pnml2lts-mc( 0/ 4):
pnml2lts-mc( 0/ 4): Explored 4 states 4 transitions, fanout: 1.000
pnml2lts-mc( 0/ 4): Total exploration time 0.000 sec (0.000 sec minimum, 0.000 sec on average)
pnml2lts-mc( 0/ 4): States per second: inf, Transitions per second: inf
pnml2lts-mc( 0/ 4):
pnml2lts-mc( 0/ 4): Queue width: 12B, total height: 0, memory: 0.00MB
pnml2lts-mc( 0/ 4): Tree memory: 0.0MB, 448.0 B/state, compr.: 4.5%
pnml2lts-mc( 0/ 4): Tree fill ratio (roots/leafs): 0.0%/0.0%
pnml2lts-mc( 0/ 4): Stored 4121 string chucks using 0MB
pnml2lts-mc( 0/ 4): Total memory used for chunk indexing: 0MB
pnml2lts-mc( 0/ 4): Est. total memory use: 0.0MB (~8192.0MB paged-in)
ltl formula name JoinFreeModules-PT-0500-LTLCardinality-08
ltl formula formula --ltl=/tmp/ltl_8_
pnml2lts-mc( 0/ 4): Loading model from model.pnml
pnml2lts-mc( 0/ 4): Edge label is id
pnml2lts-mc( 0/ 4): Petri net has 2501 places, 4001 transitions and 11502 arcs
pnml2lts-mc( 0/ 4): Petri net JoinFreeModules-PT-0500 analyzed
pnml2lts-mc( 0/ 4): There are no safe places
pnml2lts-mc( 0/ 4): Loading Petri net took 0.410 real 0.470 user 0.470 sys
pnml2lts-mc( 1/ 4): LTL layer: formula: /tmp/ltl_8_
pnml2lts-mc( 0/ 4): Weak Buchi automaton detected, adding non-accepting as progress label.
pnml2lts-mc( 0/ 4): There are 4503 state labels and 1 edge labels
pnml2lts-mc( 0/ 4): State length is 2502, there are 4006 groups
pnml2lts-mc( 0/ 4): Running ufscc using 4 cores
pnml2lts-mc( 0/ 4): Using a tree table with 2^30 elements
pnml2lts-mc( 0/ 4): Successor permutation: dynamic
pnml2lts-mc( 0/ 4): Global bits: 0, count bits: 0, local bits: 0
pnml2lts-mc( 0/ 4): ~2500 levels ~10000 states ~10026792 transitions
pnml2lts-mc( 3/ 4):
pnml2lts-mc( 3/ 4): Accepting cycle FOUND at depth ~3502!
pnml2lts-mc( 3/ 4):
pnml2lts-mc( 0/ 4):
pnml2lts-mc( 0/ 4): total scc count: 0
pnml2lts-mc( 0/ 4): unique states count: 14212
pnml2lts-mc( 0/ 4): unique transitions count: 14266918
pnml2lts-mc( 0/ 4): - self-loop count: 0
pnml2lts-mc( 0/ 4): - claim dead count: 0
pnml2lts-mc( 0/ 4): - claim found count: 1
pnml2lts-mc( 0/ 4): - claim success count: 14215
pnml2lts-mc( 0/ 4): - cum. max stack depth: 14215
pnml2lts-mc( 0/ 4):
pnml2lts-mc( 0/ 4): Explored 14215 states 14269925 transitions, fanout: 1003.864
pnml2lts-mc( 0/ 4): Total exploration time 33.320 sec (33.310 sec minimum, 33.312 sec on average)
pnml2lts-mc( 0/ 4): States per second: 427, Transitions per second: 428269
pnml2lts-mc( 0/ 4):
pnml2lts-mc( 0/ 4): Queue width: 12B, total height: 0, memory: 0.00MB
pnml2lts-mc( 0/ 4): Tree memory: 220.7MB, 16.2 B/state, compr.: 0.2%
pnml2lts-mc( 0/ 4): Tree fill ratio (roots/leafs): 1.0%/5.0%
pnml2lts-mc( 0/ 4): Stored 4121 string chucks using 0MB
pnml2lts-mc( 0/ 4): Total memory used for chunk indexing: 0MB
pnml2lts-mc( 0/ 4): Est. total memory use: 220.7MB (~8192.0MB paged-in)
ltl formula name JoinFreeModules-PT-0500-LTLCardinality-09
ltl formula formula --ltl=/tmp/ltl_9_
pnml2lts-mc( 0/ 4): Loading model from model.pnml
pnml2lts-mc( 0/ 4): Edge label is id
pnml2lts-mc( 0/ 4): Petri net has 2501 places, 4001 transitions and 11502 arcs
pnml2lts-mc( 0/ 4): Petri net JoinFreeModules-PT-0500 analyzed
pnml2lts-mc( 0/ 4): There are no safe places
pnml2lts-mc( 0/ 4): Loading Petri net took 0.390 real 0.480 user 0.430 sys
pnml2lts-mc( 3/ 4): LTL layer: formula: /tmp/ltl_9_
pnml2lts-mc( 0/ 4): Weak Buchi automaton detected, adding non-accepting as progress label.
pnml2lts-mc( 0/ 4): There are 4503 state labels and 1 edge labels
pnml2lts-mc( 0/ 4): State length is 2502, there are 4003 groups
pnml2lts-mc( 0/ 4): Running ufscc using 4 cores
pnml2lts-mc( 0/ 4): Using a tree table with 2^30 elements
pnml2lts-mc( 0/ 4): Successor permutation: dynamic
pnml2lts-mc( 0/ 4): Global bits: 0, count bits: 0, local bits: 0
pnml2lts-mc( 1/ 4): ~2500 levels ~10000 states ~10012880 transitions
pnml2lts-mc( 1/ 4): ~5000 levels ~20000 states ~20031716 transitions
pnml2lts-mc( 3/ 4):
pnml2lts-mc( 3/ 4): Accepting cycle FOUND at depth ~8002!
pnml2lts-mc( 3/ 4):
pnml2lts-mc( 0/ 4):
pnml2lts-mc( 0/ 4): total scc count: 0
pnml2lts-mc( 0/ 4): unique states count: 31437
pnml2lts-mc( 0/ 4): unique transitions count: 31454127
pnml2lts-mc( 0/ 4): - self-loop count: 0
pnml2lts-mc( 0/ 4): - claim dead count: 0
pnml2lts-mc( 0/ 4): - claim found count: 1
pnml2lts-mc( 0/ 4): - claim success count: 31440
pnml2lts-mc( 0/ 4): - cum. max stack depth: 31440
pnml2lts-mc( 0/ 4):
pnml2lts-mc( 0/ 4): Explored 31440 states 31457134 transitions, fanout: 1000.545
pnml2lts-mc( 0/ 4): Total exploration time 59.290 sec (59.290 sec minimum, 59.290 sec on average)
pnml2lts-mc( 0/ 4): States per second: 530, Transitions per second: 530564
pnml2lts-mc( 0/ 4):
pnml2lts-mc( 0/ 4): Queue width: 12B, total height: 0, memory: 0.00MB
pnml2lts-mc( 0/ 4): Tree memory: 496.3MB, 16.5 B/state, compr.: 0.2%
pnml2lts-mc( 0/ 4): Tree fill ratio (roots/leafs): 2.0%/12.0%
pnml2lts-mc( 0/ 4): Stored 4121 string chucks using 0MB
pnml2lts-mc( 0/ 4): Total memory used for chunk indexing: 0MB
pnml2lts-mc( 0/ 4): Est. total memory use: 496.3MB (~8192.0MB paged-in)
ltl formula name JoinFreeModules-PT-0500-LTLCardinality-10
ltl formula formula --ltl=/tmp/ltl_10_
pnml2lts-mc( 0/ 4): Loading model from model.pnml
pnml2lts-mc( 0/ 4): Edge label is id
pnml2lts-mc( 0/ 4): Petri net has 2501 places, 4001 transitions and 11502 arcs
pnml2lts-mc( 0/ 4): Petri net JoinFreeModules-PT-0500 analyzed
pnml2lts-mc( 0/ 4): There are no safe places
pnml2lts-mc( 1/ 4): LTL layer: formula: /tmp/ltl_10_
pnml2lts-mc( 0/ 4): Loading Petri net took 1.190 real 0.510 user 1.510 sys
pnml2lts-mc( 0/ 4): Weak Buchi automaton detected, adding non-accepting as progress label.
pnml2lts-mc( 0/ 4): There are 4503 state labels and 1 edge labels
pnml2lts-mc( 0/ 4): State length is 2502, there are 4008 groups
pnml2lts-mc( 0/ 4): Running ufscc using 4 cores
pnml2lts-mc( 0/ 4): Using a tree table with 2^30 elements
pnml2lts-mc( 0/ 4): Successor permutation: dynamic
pnml2lts-mc( 0/ 4): Global bits: 0, count bits: 0, local bits: 0
pnml2lts-mc( 3/ 4):
pnml2lts-mc( 3/ 4): Accepting cycle FOUND at depth ~1!
pnml2lts-mc( 3/ 4):
pnml2lts-mc( 0/ 4):
pnml2lts-mc( 0/ 4): total scc count: 0
pnml2lts-mc( 0/ 4): unique states count: 1
pnml2lts-mc( 0/ 4): unique transitions count: 1001
pnml2lts-mc( 0/ 4): - self-loop count: 4
pnml2lts-mc( 0/ 4): - claim dead count: 0
pnml2lts-mc( 0/ 4): - claim found count: 0
pnml2lts-mc( 0/ 4): - claim success count: 4
pnml2lts-mc( 0/ 4): - cum. max stack depth: 4
pnml2lts-mc( 0/ 4):
pnml2lts-mc( 0/ 4): Explored 4 states 4008 transitions, fanout: 1002.000
pnml2lts-mc( 0/ 4): Total exploration time 0.060 sec (0.060 sec minimum, 0.060 sec on average)
pnml2lts-mc( 0/ 4): States per second: 67, Transitions per second: 66800
pnml2lts-mc( 0/ 4):
pnml2lts-mc( 0/ 4): Queue width: 12B, total height: 0, memory: 0.00MB
pnml2lts-mc( 0/ 4): Tree memory: 0.0MB, 37.0 B/state, compr.: 0.4%
pnml2lts-mc( 0/ 4): Tree fill ratio (roots/leafs): 0.0%/0.0%
pnml2lts-mc( 0/ 4): Stored 4121 string chucks using 0MB
pnml2lts-mc( 0/ 4): Total memory used for chunk indexing: 0MB
pnml2lts-mc( 0/ 4): Est. total memory use: 0.0MB (~8192.0MB paged-in)
ltl formula name JoinFreeModules-PT-0500-LTLCardinality-11
ltl formula formula --ltl=/tmp/ltl_11_
pnml2lts-mc( 0/ 4): Loading model from model.pnml
pnml2lts-mc( 0/ 4): Edge label is id
pnml2lts-mc( 0/ 4): Petri net has 2501 places, 4001 transitions and 11502 arcs
pnml2lts-mc( 0/ 4): Petri net JoinFreeModules-PT-0500 analyzed
pnml2lts-mc( 0/ 4): There are no safe places
pnml2lts-mc( 0/ 4): Loading Petri net took 0.400 real 0.480 user 0.460 sys
pnml2lts-mc( 2/ 4): LTL layer: formula: /tmp/ltl_11_
pnml2lts-mc( 0/ 4): Weak Buchi automaton detected, adding non-accepting as progress label.
pnml2lts-mc( 0/ 4): There are 4503 state labels and 1 edge labels
pnml2lts-mc( 0/ 4): State length is 2502, there are 4004 groups
pnml2lts-mc( 0/ 4): Running ufscc using 4 cores
pnml2lts-mc( 0/ 4): Using a tree table with 2^30 elements
pnml2lts-mc( 0/ 4): Successor permutation: dynamic
pnml2lts-mc( 0/ 4): Global bits: 0, count bits: 0, local bits: 0
pnml2lts-mc( 0/ 4):
pnml2lts-mc( 0/ 4): total scc count: 1002
pnml2lts-mc( 0/ 4): unique states count: 1002
pnml2lts-mc( 0/ 4): unique transitions count: 1001
pnml2lts-mc( 0/ 4): - self-loop count: 0
pnml2lts-mc( 0/ 4): - claim dead count: 2606
pnml2lts-mc( 0/ 4): - claim found count: 0
pnml2lts-mc( 0/ 4): - claim success count: 1033
pnml2lts-mc( 0/ 4): - cum. max stack depth: 8
pnml2lts-mc( 0/ 4):
pnml2lts-mc( 0/ 4): Explored 1033 states 4008 transitions, fanout: 3.880
pnml2lts-mc( 0/ 4): Total exploration time 0.740 sec (0.740 sec minimum, 0.740 sec on average)
pnml2lts-mc( 0/ 4): States per second: 1396, Transitions per second: 5416
pnml2lts-mc( 0/ 4):
pnml2lts-mc( 0/ 4): Queue width: 12B, total height: 0, memory: 0.00MB
pnml2lts-mc( 0/ 4): Tree memory: 0.0MB, 37.0 B/state, compr.: 0.4%
pnml2lts-mc( 0/ 4): Tree fill ratio (roots/leafs): 0.0%/0.0%
pnml2lts-mc( 0/ 4): Stored 4121 string chucks using 0MB
pnml2lts-mc( 0/ 4): Total memory used for chunk indexing: 0MB
pnml2lts-mc( 0/ 4): Est. total memory use: 0.0MB (~8192.0MB paged-in)
ltl formula name JoinFreeModules-PT-0500-LTLCardinality-12
ltl formula formula --ltl=/tmp/ltl_12_
pnml2lts-mc( 0/ 4): Loading model from model.pnml
pnml2lts-mc( 0/ 4): Edge label is id
pnml2lts-mc( 0/ 4): Petri net has 2501 places, 4001 transitions and 11502 arcs
pnml2lts-mc( 0/ 4): Petri net JoinFreeModules-PT-0500 analyzed
pnml2lts-mc( 0/ 4): There are no safe places
pnml2lts-mc( 0/ 4): Loading Petri net took 0.400 real 0.430 user 0.500 sys
pnml2lts-mc( 0/ 4): LTL layer: formula: /tmp/ltl_12_
pnml2lts-mc( 0/ 4): buchi has 2 states
pnml2lts-mc( 0/ 4): Weak Buchi automaton detected, adding non-accepting as progress label.
pnml2lts-mc( 0/ 4): There are 4503 state labels and 1 edge labels
pnml2lts-mc( 0/ 4): State length is 2502, there are 4003 groups
pnml2lts-mc( 0/ 4): Running ufscc using 4 cores
pnml2lts-mc( 0/ 4): Using a tree table with 2^30 elements
pnml2lts-mc( 0/ 4): Successor permutation: dynamic
pnml2lts-mc( 0/ 4): Global bits: 0, count bits: 0, local bits: 0
pnml2lts-mc( 3/ 4): ~2500 levels ~10000 states ~10003880 transitions
pnml2lts-mc( 3/ 4): ~5000 levels ~20000 states ~19981752 transitions
pnml2lts-mc( 1/ 4):
pnml2lts-mc( 1/ 4): Accepting cycle FOUND at depth ~7502!
pnml2lts-mc( 1/ 4):
pnml2lts-mc( 0/ 4):
pnml2lts-mc( 0/ 4): total scc count: 0
pnml2lts-mc( 0/ 4): unique states count: 30665
pnml2lts-mc( 0/ 4): unique transitions count: 30657995
pnml2lts-mc( 0/ 4): - self-loop count: 0
pnml2lts-mc( 0/ 4): - claim dead count: 0
pnml2lts-mc( 0/ 4): - claim found count: 1
pnml2lts-mc( 0/ 4): - claim success count: 30668
pnml2lts-mc( 0/ 4): - cum. max stack depth: 30668
pnml2lts-mc( 0/ 4):
pnml2lts-mc( 0/ 4): Explored 30668 states 30661002 transitions, fanout: 999.772
pnml2lts-mc( 0/ 4): Total exploration time 57.650 sec (57.650 sec minimum, 57.650 sec on average)
pnml2lts-mc( 0/ 4): States per second: 532, Transitions per second: 531847
pnml2lts-mc( 0/ 4):
pnml2lts-mc( 0/ 4): Queue width: 12B, total height: 0, memory: 0.00MB
pnml2lts-mc( 0/ 4): Tree memory: 489.0MB, 16.7 B/state, compr.: 0.2%
pnml2lts-mc( 0/ 4): Tree fill ratio (roots/leafs): 2.0%/12.0%
pnml2lts-mc( 0/ 4): Stored 4121 string chucks using 0MB
pnml2lts-mc( 0/ 4): Total memory used for chunk indexing: 0MB
pnml2lts-mc( 0/ 4): Est. total memory use: 489.0MB (~8192.0MB paged-in)
ltl formula name JoinFreeModules-PT-0500-LTLCardinality-13
ltl formula formula --ltl=/tmp/ltl_13_
pnml2lts-mc( 0/ 4): Loading model from model.pnml
pnml2lts-mc( 0/ 4): Edge label is id
pnml2lts-mc( 0/ 4): Petri net has 2501 places, 4001 transitions and 11502 arcs
pnml2lts-mc( 0/ 4): Petri net JoinFreeModules-PT-0500 analyzed
pnml2lts-mc( 0/ 4): There are no safe places
pnml2lts-mc( 0/ 4): Loading Petri net took 0.520 real 0.470 user 0.520 sys
pnml2lts-mc( 1/ 4): LTL layer: formula: /tmp/ltl_13_
pnml2lts-mc( 0/ 4): There are 4502 state labels and 1 edge labels
pnml2lts-mc( 0/ 4): State length is 2502, there are 4014 groups
pnml2lts-mc( 0/ 4): Running ufscc using 4 cores
pnml2lts-mc( 0/ 4): Using a tree table with 2^30 elements
pnml2lts-mc( 0/ 4): Successor permutation: dynamic
pnml2lts-mc( 0/ 4): Global bits: 0, count bits: 0, local bits: 0
pnml2lts-mc( 1/ 4): ~2500 levels ~10000 states ~19991844 transitions
pnml2lts-mc( 2/ 4): ~5000 levels ~20000 states ~40039324 transitions
pnml2lts-mc( 3/ 4): ~8373 levels ~40000 states ~67301676 transitions
pnml2lts-mc( 3/ 4): ~15553 levels ~80000 states ~125024492 transitions
ltl formula name JoinFreeModules-PT-0500-LTLCardinality-14
ltl formula formula --ltl=/tmp/ltl_14_
pnml2lts-mc( 0/ 4): Loading model from model.pnml
pnml2lts-mc( 0/ 4): Edge label is id
pnml2lts-mc( 0/ 4): Petri net has 2501 places, 4001 transitions and 11502 arcs
pnml2lts-mc( 0/ 4): Petri net JoinFreeModules-PT-0500 analyzed
pnml2lts-mc( 0/ 4): There are no safe places
pnml2lts-mc( 1/ 4): LTL layer: formula: /tmp/ltl_14_
pnml2lts-mc( 0/ 4): Loading Petri net took 1.470 real 0.460 user 2.290 sys
pnml2lts-mc( 0/ 4): There are 4502 state labels and 1 edge labels
pnml2lts-mc( 0/ 4): State length is 2502, there are 4008 groups
pnml2lts-mc( 0/ 4): Running ufscc using 4 cores
pnml2lts-mc( 0/ 4): Using a tree table with 2^30 elements
pnml2lts-mc( 0/ 4): Successor permutation: dynamic
pnml2lts-mc( 0/ 4): Global bits: 0, count bits: 0, local bits: 0
pnml2lts-mc( 3/ 4):
pnml2lts-mc( 3/ 4): Accepting cycle FOUND at depth ~1!
pnml2lts-mc( 3/ 4):
pnml2lts-mc( 0/ 4):
pnml2lts-mc( 0/ 4): total scc count: 0
pnml2lts-mc( 0/ 4): unique states count: 1
pnml2lts-mc( 0/ 4): unique transitions count: 2002
pnml2lts-mc( 0/ 4): - self-loop count: 4
pnml2lts-mc( 0/ 4): - claim dead count: 0
pnml2lts-mc( 0/ 4): - claim found count: 0
pnml2lts-mc( 0/ 4): - claim success count: 4
pnml2lts-mc( 0/ 4): - cum. max stack depth: 4
pnml2lts-mc( 0/ 4):
pnml2lts-mc( 0/ 4): Explored 4 states 8012 transitions, fanout: 2003.000
pnml2lts-mc( 0/ 4): Total exploration time 0.090 sec (0.090 sec minimum, 0.090 sec on average)
pnml2lts-mc( 0/ 4): States per second: 44, Transitions per second: 89022
pnml2lts-mc( 0/ 4):
pnml2lts-mc( 0/ 4): Queue width: 12B, total height: 0, memory: 0.00MB
pnml2lts-mc( 0/ 4): Tree memory: 0.1MB, 27.7 B/state, compr.: 0.3%
pnml2lts-mc( 0/ 4): Tree fill ratio (roots/leafs): 0.0%/0.0%
pnml2lts-mc( 0/ 4): Stored 4121 string chucks using 0MB
pnml2lts-mc( 0/ 4): Total memory used for chunk indexing: 0MB
pnml2lts-mc( 0/ 4): Est. total memory use: 0.1MB (~8192.0MB paged-in)
ltl formula name JoinFreeModules-PT-0500-LTLCardinality-15
ltl formula formula --ltl=/tmp/ltl_15_
pnml2lts-mc( 0/ 4): Loading model from model.pnml
pnml2lts-mc( 0/ 4): Edge label is id
pnml2lts-mc( 0/ 4): Petri net has 2501 places, 4001 transitions and 11502 arcs
pnml2lts-mc( 0/ 4): Petri net JoinFreeModules-PT-0500 analyzed
pnml2lts-mc( 0/ 4): There are no safe places
pnml2lts-mc( 0/ 4): Loading Petri net took 0.390 real 0.490 user 0.400 sys
pnml2lts-mc( 1/ 4): LTL layer: formula: /tmp/ltl_15_
pnml2lts-mc( 0/ 4): Weak Buchi automaton detected, adding non-accepting as progress label.
pnml2lts-mc( 0/ 4): There are 4503 state labels and 1 edge labels
pnml2lts-mc( 0/ 4): State length is 2502, there are 4004 groups
pnml2lts-mc( 0/ 4): Running ufscc using 4 cores
pnml2lts-mc( 0/ 4): Using a tree table with 2^30 elements
pnml2lts-mc( 0/ 4): Successor permutation: dynamic
pnml2lts-mc( 0/ 4): Global bits: 0, count bits: 0, local bits: 0
pnml2lts-mc( 3/ 4): ~2500 levels ~10000 states ~9989968 transitions
pnml2lts-mc( 1/ 4): ~5000 levels ~20000 states ~20078576 transitions
pnml2lts-mc( 1/ 4): ~10000 levels ~40000 states ~40193100 transitions
pnml2lts-mc( 0/ 4):
pnml2lts-mc( 0/ 4): Accepting cycle FOUND at depth ~10503!
pnml2lts-mc( 0/ 4):
pnml2lts-mc( 0/ 4):
pnml2lts-mc( 0/ 4): total scc count: 0
pnml2lts-mc( 0/ 4): unique states count: 43407
pnml2lts-mc( 0/ 4): unique transitions count: 43576049
pnml2lts-mc( 0/ 4): - self-loop count: 0
pnml2lts-mc( 0/ 4): - claim dead count: 0
pnml2lts-mc( 0/ 4): - claim found count: 1
pnml2lts-mc( 0/ 4): - claim success count: 43410
pnml2lts-mc( 0/ 4): - cum. max stack depth: 43410
pnml2lts-mc( 0/ 4):
pnml2lts-mc( 0/ 4): Explored 43410 states 43579056 transitions, fanout: 1003.894
pnml2lts-mc( 0/ 4): Total exploration time 77.720 sec (77.710 sec minimum, 77.717 sec on average)
pnml2lts-mc( 0/ 4): States per second: 559, Transitions per second: 560719
pnml2lts-mc( 0/ 4):
pnml2lts-mc( 0/ 4): Queue width: 12B, total height: 0, memory: 0.00MB
pnml2lts-mc( 0/ 4): Tree memory: 676.9MB, 16.3 B/state, compr.: 0.2%
pnml2lts-mc( 0/ 4): Tree fill ratio (roots/leafs): 4.0%/16.0%
pnml2lts-mc( 0/ 4): Stored 4121 string chucks using 0MB
pnml2lts-mc( 0/ 4): Total memory used for chunk indexing: 0MB
pnml2lts-mc( 0/ 4): Est. total memory use: 676.9MB (~8192.0MB paged-in)
Sequence of Actions to be Executed by the VM
This is useful if one wants to reexecute the tool in the VM from the submitted image disk.
set -x
# this is for BenchKit: configuration of major elements for the test
export BK_INPUT="JoinFreeModules-PT-0500"
export BK_EXAMINATION="LTLCardinality"
export BK_TOOL="ltsmin"
export BK_RESULT_DIR="/tmp/BK_RESULTS/OUTPUTS"
export BK_TIME_CONFINEMENT="3600"
export BK_MEMORY_CONFINEMENT="16384"
# this is specific to your benchmark or test
export BIN_DIR="$HOME/BenchKit/bin"
# remove the execution directoty if it exists (to avoid increse of .vmdk images)
if [ -d execution ] ; then
rm -rf execution
fi
tar xzf /home/mcc/BenchKit/INPUTS/JoinFreeModules-PT-0500.tgz
mv JoinFreeModules-PT-0500 execution
cd execution
pwd
ls -lh
# this is for BenchKit: explicit launching of the test
echo "====================================================================="
echo " Generated by BenchKit 2-3637"
echo " Executing tool ltsmin"
echo " Input is JoinFreeModules-PT-0500, examination is LTLCardinality"
echo " Time confinement is $BK_TIME_CONFINEMENT seconds"
echo " Memory confinement is 16384 MBytes"
echo " Number of cores is 4"
echo " Run identifier is r209-smll-152732259100343"
echo "====================================================================="
echo
echo "--------------------"
echo "content from stdout:"
echo
echo "=== Data for post analysis generated by BenchKit (invocation template)"
echo
if [ "LTLCardinality" = "UpperBounds" ] ; then
echo "The expected result is a vector of positive values"
echo NUM_VECTOR
elif [ "LTLCardinality" != "StateSpace" ] ; then
echo "The expected result is a vector of booleans"
echo BOOL_VECTOR
else
echo "no data necessary for post analysis"
fi
echo
if [ -f "LTLCardinality.txt" ] ; then
echo "here is the order used to build the result vector(from text file)"
for x in $(grep Property LTLCardinality.txt | cut -d ' ' -f 2 | sort -u) ; do
echo "FORMULA_NAME $x"
done
elif [ -f "LTLCardinality.xml" ] ; then # for cunf (txt files deleted;-)
echo echo "here is the order used to build the result vector(from xml file)"
for x in $(grep '
echo "FORMULA_NAME $x"
done
fi
echo
echo "=== Now, execution of the tool begins"
echo
echo -n "BK_START "
date -u +%s%3N
echo
timeout -s 9 $BK_TIME_CONFINEMENT bash -c "/home/mcc/BenchKit/BenchKit_head.sh 2> STDERR ; echo ; echo -n \"BK_STOP \" ; date -u +%s%3N"
if [ $? -eq 137 ] ; then
echo
echo "BK_TIME_CONFINEMENT_REACHED"
fi
echo
echo "--------------------"
echo "content from stderr:"
echo
cat STDERR ;