

About the Execution of LTSMin for JoinFreeModules-PT-0100
| Execution Summary | |||||
| Max Memory Used (MB) |
Time wait (ms) | CPU Usage (ms) | I/O Wait (ms) | Computed Result | Execution Status |
| 15919.310 | 761911.00 | 2507454.00 | 20727.10 | ?F?FFFFFFFF??FTF | normal |
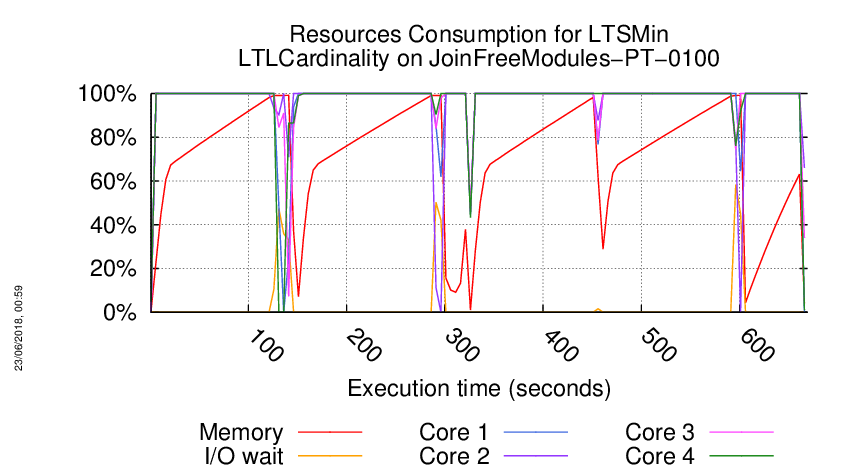
Execution Chart
We display below the execution chart for this examination (boot time has been removed).
Trace from the execution
Waiting for the VM to be ready (probing ssh)
..................
/home/mcc/execution
total 732K
-rw-r--r-- 1 mcc users 3.5K May 15 18:54 CTLCardinality.txt
-rw-r--r-- 1 mcc users 19K May 15 18:54 CTLCardinality.xml
-rw-r--r-- 1 mcc users 2.9K May 15 18:54 CTLFireability.txt
-rw-r--r-- 1 mcc users 21K May 15 18:54 CTLFireability.xml
-rw-r--r-- 1 mcc users 4.0K May 15 18:50 GenericPropertiesDefinition.xml
-rw-r--r-- 1 mcc users 5.7K May 15 18:50 GenericPropertiesVerdict.xml
-rw-r--r-- 1 mcc users 2.4K May 26 09:26 LTLCardinality.txt
-rw-r--r-- 1 mcc users 11K May 26 09:26 LTLCardinality.xml
-rw-r--r-- 1 mcc users 1.9K May 26 09:26 LTLFireability.txt
-rw-r--r-- 1 mcc users 8.3K May 26 09:26 LTLFireability.xml
-rw-r--r-- 1 mcc users 3.3K May 15 18:54 ReachabilityCardinality.txt
-rw-r--r-- 1 mcc users 16K May 15 18:54 ReachabilityCardinality.xml
-rw-r--r-- 1 mcc users 114 May 15 18:54 ReachabilityDeadlock.txt
-rw-r--r-- 1 mcc users 352 May 15 18:54 ReachabilityDeadlock.xml
-rw-r--r-- 1 mcc users 2.7K May 15 18:54 ReachabilityFireability.txt
-rw-r--r-- 1 mcc users 16K May 15 18:54 ReachabilityFireability.xml
-rw-r--r-- 1 mcc users 1.7K May 15 18:54 UpperBounds.txt
-rw-r--r-- 1 mcc users 3.8K May 15 18:54 UpperBounds.xml
-rw-r--r-- 1 mcc users 6 May 15 18:50 equiv_col
-rw-r--r-- 1 mcc users 5 May 15 18:50 instance
-rw-r--r-- 1 mcc users 6 May 15 18:50 iscolored
-rw-r--r-- 1 mcc users 566K May 15 18:50 model.pnml
=====================================================================
Generated by BenchKit 2-3637
Executing tool ltsmin
Input is JoinFreeModules-PT-0100, examination is LTLCardinality
Time confinement is 3600 seconds
Memory confinement is 16384 MBytes
Number of cores is 4
Run identifier is r209-smll-152732259100339
=====================================================================
--------------------
content from stdout:
=== Data for post analysis generated by BenchKit (invocation template)
The expected result is a vector of booleans
BOOL_VECTOR
here is the order used to build the result vector(from text file)
FORMULA_NAME JoinFreeModules-PT-0100-LTLCardinality-00
FORMULA_NAME JoinFreeModules-PT-0100-LTLCardinality-01
FORMULA_NAME JoinFreeModules-PT-0100-LTLCardinality-02
FORMULA_NAME JoinFreeModules-PT-0100-LTLCardinality-03
FORMULA_NAME JoinFreeModules-PT-0100-LTLCardinality-04
FORMULA_NAME JoinFreeModules-PT-0100-LTLCardinality-05
FORMULA_NAME JoinFreeModules-PT-0100-LTLCardinality-06
FORMULA_NAME JoinFreeModules-PT-0100-LTLCardinality-07
FORMULA_NAME JoinFreeModules-PT-0100-LTLCardinality-08
FORMULA_NAME JoinFreeModules-PT-0100-LTLCardinality-09
FORMULA_NAME JoinFreeModules-PT-0100-LTLCardinality-10
FORMULA_NAME JoinFreeModules-PT-0100-LTLCardinality-11
FORMULA_NAME JoinFreeModules-PT-0100-LTLCardinality-12
FORMULA_NAME JoinFreeModules-PT-0100-LTLCardinality-13
FORMULA_NAME JoinFreeModules-PT-0100-LTLCardinality-14
FORMULA_NAME JoinFreeModules-PT-0100-LTLCardinality-15
=== Now, execution of the tool begins
BK_START 1527387065383
FORMULA JoinFreeModules-PT-0100-LTLCardinality-00 CANNOT_COMPUTE
FORMULA JoinFreeModules-PT-0100-LTLCardinality-01 FALSE TECHNIQUES EXPLICIT PARALLEL_PROCESSING USE_NUPN
FORMULA JoinFreeModules-PT-0100-LTLCardinality-02 CANNOT_COMPUTE
FORMULA JoinFreeModules-PT-0100-LTLCardinality-03 FALSE TECHNIQUES EXPLICIT PARALLEL_PROCESSING USE_NUPN
FORMULA JoinFreeModules-PT-0100-LTLCardinality-04 FALSE TECHNIQUES EXPLICIT PARALLEL_PROCESSING USE_NUPN
FORMULA JoinFreeModules-PT-0100-LTLCardinality-05 FALSE TECHNIQUES EXPLICIT PARALLEL_PROCESSING USE_NUPN
FORMULA JoinFreeModules-PT-0100-LTLCardinality-06 FALSE TECHNIQUES EXPLICIT PARALLEL_PROCESSING USE_NUPN
FORMULA JoinFreeModules-PT-0100-LTLCardinality-07 FALSE TECHNIQUES EXPLICIT PARALLEL_PROCESSING USE_NUPN
FORMULA JoinFreeModules-PT-0100-LTLCardinality-08 FALSE TECHNIQUES EXPLICIT PARALLEL_PROCESSING USE_NUPN
FORMULA JoinFreeModules-PT-0100-LTLCardinality-09 FALSE TECHNIQUES EXPLICIT PARALLEL_PROCESSING USE_NUPN
FORMULA JoinFreeModules-PT-0100-LTLCardinality-10 FALSE TECHNIQUES EXPLICIT PARALLEL_PROCESSING USE_NUPN
FORMULA JoinFreeModules-PT-0100-LTLCardinality-11 CANNOT_COMPUTE
FORMULA JoinFreeModules-PT-0100-LTLCardinality-12 CANNOT_COMPUTE
FORMULA JoinFreeModules-PT-0100-LTLCardinality-13 FALSE TECHNIQUES EXPLICIT PARALLEL_PROCESSING USE_NUPN
FORMULA JoinFreeModules-PT-0100-LTLCardinality-14 TRUE TECHNIQUES EXPLICIT PARALLEL_PROCESSING USE_NUPN
FORMULA JoinFreeModules-PT-0100-LTLCardinality-15 FALSE TECHNIQUES EXPLICIT PARALLEL_PROCESSING USE_NUPN
BK_STOP 1527387827294
--------------------
content from stderr:
mcc2018
ltl formula name JoinFreeModules-PT-0100-LTLCardinality-00
ltl formula formula --ltl=/tmp/ltl_0_
pnml2lts-mc( 0/ 4): Loading model from model.pnml
pnml2lts-mc( 0/ 4): Edge label is id
pnml2lts-mc( 0/ 4): Petri net has 501 places, 801 transitions and 2302 arcs
pnml2lts-mc( 0/ 4): Petri net JoinFreeModules-PT-0100 analyzed
pnml2lts-mc( 0/ 4): There are no safe places
pnml2lts-mc( 0/ 4): Loading Petri net took 0.160 real 0.160 user 0.080 sys
pnml2lts-mc( 1/ 4): LTL layer: formula: /tmp/ltl_0_
pnml2lts-mc( 0/ 4): There are 902 state labels and 1 edge labels
pnml2lts-mc( 0/ 4): State length is 502, there are 814 groups
pnml2lts-mc( 0/ 4): Running ufscc using 4 cores
pnml2lts-mc( 0/ 4): Using a tree table with 2^30 elements
pnml2lts-mc( 0/ 4): Successor permutation: dynamic
pnml2lts-mc( 0/ 4): Global bits: 0, count bits: 0, local bits: 0
pnml2lts-mc( 3/ 4): ~1252 levels ~10000 states ~2003876 transitions
pnml2lts-mc( 3/ 4): ~2502 levels ~20000 states ~4012060 transitions
pnml2lts-mc( 3/ 4): ~5002 levels ~40000 states ~8030292 transitions
pnml2lts-mc( 3/ 4): ~10002 levels ~80000 states ~16064940 transitions
pnml2lts-mc( 3/ 4): ~20002 levels ~160000 states ~32207884 transitions
pnml2lts-mc( 3/ 4): ~40002 levels ~320000 states ~64508476 transitions
pnml2lts-mc( 3/ 4): ~80002 levels ~640000 states ~129109492 transitions
ltl formula name JoinFreeModules-PT-0100-LTLCardinality-01
ltl formula formula --ltl=/tmp/ltl_1_
pnml2lts-mc( 0/ 4): Loading model from model.pnml
pnml2lts-mc( 0/ 4): Edge label is id
pnml2lts-mc( 0/ 4): Petri net has 501 places, 801 transitions and 2302 arcs
pnml2lts-mc( 0/ 4): Petri net JoinFreeModules-PT-0100 analyzed
pnml2lts-mc( 0/ 4): There are no safe places
pnml2lts-mc( 0/ 4): Loading Petri net took 0.110 real 0.100 user 0.080 sys
pnml2lts-mc( 0/ 4): LTL layer: formula: /tmp/ltl_1_
pnml2lts-mc( 0/ 4): buchi has 2 states
pnml2lts-mc( 0/ 4): Weak Buchi automaton detected, adding non-accepting as progress label.
pnml2lts-mc( 0/ 4): There are 903 state labels and 1 edge labels
pnml2lts-mc( 0/ 4): State length is 502, there are 803 groups
pnml2lts-mc( 0/ 4): Running ufscc using 4 cores
pnml2lts-mc( 0/ 4): Using a tree table with 2^30 elements
pnml2lts-mc( 0/ 4): Successor permutation: dynamic
pnml2lts-mc( 0/ 4): Global bits: 0, count bits: 0, local bits: 0
pnml2lts-mc( 1/ 4):
pnml2lts-mc( 1/ 4): Accepting cycle FOUND at depth ~665!
pnml2lts-mc( 1/ 4):
pnml2lts-mc( 0/ 4):
pnml2lts-mc( 0/ 4): total scc count: 200
pnml2lts-mc( 0/ 4): unique states count: 2963
pnml2lts-mc( 0/ 4): unique transitions count: 558472
pnml2lts-mc( 0/ 4): - self-loop count: 0
pnml2lts-mc( 0/ 4): - claim dead count: 155
pnml2lts-mc( 0/ 4): - claim found count: 1
pnml2lts-mc( 0/ 4): - claim success count: 2974
pnml2lts-mc( 0/ 4): - cum. max stack depth: 2769
pnml2lts-mc( 0/ 4):
pnml2lts-mc( 0/ 4): Explored 2974 states 559679 transitions, fanout: 188.191
pnml2lts-mc( 0/ 4): Total exploration time 3.890 sec (3.880 sec minimum, 3.885 sec on average)
pnml2lts-mc( 0/ 4): States per second: 765, Transitions per second: 143876
pnml2lts-mc( 0/ 4):
pnml2lts-mc( 0/ 4): Queue width: 12B, total height: 0, memory: 0.00MB
pnml2lts-mc( 0/ 4): Tree memory: 8.8MB, 16.6 B/state, compr.: 0.8%
pnml2lts-mc( 0/ 4): Tree fill ratio (roots/leafs): 0.0%/0.0%
pnml2lts-mc( 0/ 4): Stored 814 string chucks using 0MB
pnml2lts-mc( 0/ 4): Total memory used for chunk indexing: 0MB
pnml2lts-mc( 0/ 4): Est. total memory use: 8.8MB (~8192.0MB paged-in)
ltl formula name JoinFreeModules-PT-0100-LTLCardinality-02
ltl formula formula --ltl=/tmp/ltl_2_
pnml2lts-mc( 0/ 4): Loading model from model.pnml
pnml2lts-mc( 0/ 4): Edge label is id
pnml2lts-mc( 0/ 4): Petri net has 501 places, 801 transitions and 2302 arcs
pnml2lts-mc( 0/ 4): Petri net JoinFreeModules-PT-0100 analyzed
pnml2lts-mc( 0/ 4): There are no safe places
pnml2lts-mc( 0/ 4): Loading Petri net took 0.080 real 0.080 user 0.090 sys
pnml2lts-mc( 2/ 4): LTL layer: formula: /tmp/ltl_2_
pnml2lts-mc( 0/ 4): Weak Buchi automaton detected, adding non-accepting as progress label.
pnml2lts-mc( 0/ 4): There are 903 state labels and 1 edge labels
pnml2lts-mc( 0/ 4): State length is 502, there are 804 groups
pnml2lts-mc( 0/ 4): Running ufscc using 4 cores
pnml2lts-mc( 0/ 4): Using a tree table with 2^30 elements
pnml2lts-mc( 0/ 4): Successor permutation: dynamic
pnml2lts-mc( 0/ 4): Global bits: 0, count bits: 0, local bits: 0
pnml2lts-mc( 0/ 4): ~2500 levels ~10000 states ~2012944 transitions
pnml2lts-mc( 0/ 4): ~5000 levels ~20000 states ~4045064 transitions
pnml2lts-mc( 3/ 4): ~10000 levels ~40000 states ~8146892 transitions
pnml2lts-mc( 3/ 4): ~20000 levels ~80000 states ~16336784 transitions
pnml2lts-mc( 2/ 4): ~40000 levels ~160000 states ~33242160 transitions
pnml2lts-mc( 2/ 4): ~80000 levels ~320000 states ~66303796 transitions
pnml2lts-mc( 2/ 4): ~160000 levels ~640000 states ~132412584 transitions
ltl formula name JoinFreeModules-PT-0100-LTLCardinality-03
ltl formula formula --ltl=/tmp/ltl_3_
pnml2lts-mc( 0/ 4): Loading model from model.pnml
pnml2lts-mc( 0/ 4): Edge label is id
pnml2lts-mc( 0/ 4): Petri net has 501 places, 801 transitions and 2302 arcs
pnml2lts-mc( 0/ 4): Petri net JoinFreeModules-PT-0100 analyzed
pnml2lts-mc( 0/ 4): There are no safe places
pnml2lts-mc( 0/ 4): Loading Petri net took 0.130 real 0.110 user 0.110 sys
pnml2lts-mc( 2/ 4): LTL layer: formula: /tmp/ltl_3_
pnml2lts-mc( 0/ 4): Weak Buchi automaton detected, adding non-accepting as progress label.
pnml2lts-mc( 0/ 4): There are 903 state labels and 1 edge labels
pnml2lts-mc( 0/ 4): State length is 502, there are 803 groups
pnml2lts-mc( 0/ 4): Running ufscc using 4 cores
pnml2lts-mc( 0/ 4): Using a tree table with 2^30 elements
pnml2lts-mc( 0/ 4): Successor permutation: dynamic
pnml2lts-mc( 0/ 4): Global bits: 0, count bits: 0, local bits: 0
pnml2lts-mc( 2/ 4):
pnml2lts-mc( 2/ 4): Accepting cycle FOUND at depth ~622!
pnml2lts-mc( 2/ 4):
pnml2lts-mc( 0/ 4):
pnml2lts-mc( 0/ 4): total scc count: 0
pnml2lts-mc( 0/ 4): unique states count: 2460
pnml2lts-mc( 0/ 4): unique transitions count: 497581
pnml2lts-mc( 0/ 4): - self-loop count: 0
pnml2lts-mc( 0/ 4): - claim dead count: 0
pnml2lts-mc( 0/ 4): - claim found count: 1
pnml2lts-mc( 0/ 4): - claim success count: 2463
pnml2lts-mc( 0/ 4): - cum. max stack depth: 2463
pnml2lts-mc( 0/ 4):
pnml2lts-mc( 0/ 4): Explored 2463 states 498188 transitions, fanout: 202.269
pnml2lts-mc( 0/ 4): Total exploration time 3.540 sec (3.540 sec minimum, 3.540 sec on average)
pnml2lts-mc( 0/ 4): States per second: 696, Transitions per second: 140731
pnml2lts-mc( 0/ 4):
pnml2lts-mc( 0/ 4): Queue width: 12B, total height: 0, memory: 0.00MB
pnml2lts-mc( 0/ 4): Tree memory: 7.7MB, 16.3 B/state, compr.: 0.8%
pnml2lts-mc( 0/ 4): Tree fill ratio (roots/leafs): 0.0%/0.0%
pnml2lts-mc( 0/ 4): Stored 814 string chucks using 0MB
pnml2lts-mc( 0/ 4): Total memory used for chunk indexing: 0MB
pnml2lts-mc( 0/ 4): Est. total memory use: 7.7MB (~8192.0MB paged-in)
ltl formula name JoinFreeModules-PT-0100-LTLCardinality-04
ltl formula formula --ltl=/tmp/ltl_4_
pnml2lts-mc( 0/ 4): Loading model from model.pnml
pnml2lts-mc( 0/ 4): Edge label is id
pnml2lts-mc( 0/ 4): Petri net has 501 places, 801 transitions and 2302 arcs
pnml2lts-mc( 0/ 4): Petri net JoinFreeModules-PT-0100 analyzed
pnml2lts-mc( 0/ 4): There are no safe places
pnml2lts-mc( 0/ 4): Loading Petri net took 0.070 real 0.100 user 0.070 sys
pnml2lts-mc( 1/ 4): LTL layer: formula: /tmp/ltl_4_
pnml2lts-mc( 0/ 4): Weak Buchi automaton detected, adding non-accepting as progress label.
pnml2lts-mc( 0/ 4): There are 903 state labels and 1 edge labels
pnml2lts-mc( 0/ 4): State length is 502, there are 803 groups
pnml2lts-mc( 0/ 4): Running ufscc using 4 cores
pnml2lts-mc( 0/ 4): Using a tree table with 2^30 elements
pnml2lts-mc( 0/ 4): Successor permutation: dynamic
pnml2lts-mc( 0/ 4): Global bits: 0, count bits: 0, local bits: 0
pnml2lts-mc( 2/ 4):
pnml2lts-mc( 2/ 4): Accepting cycle FOUND at depth ~229!
pnml2lts-mc( 2/ 4):
pnml2lts-mc( 0/ 4):
pnml2lts-mc( 0/ 4): total scc count: 0
pnml2lts-mc( 0/ 4): unique states count: 902
pnml2lts-mc( 0/ 4): unique transitions count: 183112
pnml2lts-mc( 0/ 4): - self-loop count: 0
pnml2lts-mc( 0/ 4): - claim dead count: 0
pnml2lts-mc( 0/ 4): - claim found count: 1
pnml2lts-mc( 0/ 4): - claim success count: 905
pnml2lts-mc( 0/ 4): - cum. max stack depth: 905
pnml2lts-mc( 0/ 4):
pnml2lts-mc( 0/ 4): Explored 905 states 183719 transitions, fanout: 203.004
pnml2lts-mc( 0/ 4): Total exploration time 1.420 sec (1.420 sec minimum, 1.420 sec on average)
pnml2lts-mc( 0/ 4): States per second: 637, Transitions per second: 129380
pnml2lts-mc( 0/ 4):
pnml2lts-mc( 0/ 4): Queue width: 12B, total height: 0, memory: 0.00MB
pnml2lts-mc( 0/ 4): Tree memory: 2.9MB, 16.5 B/state, compr.: 0.8%
pnml2lts-mc( 0/ 4): Tree fill ratio (roots/leafs): 0.0%/0.0%
pnml2lts-mc( 0/ 4): Stored 814 string chucks using 0MB
pnml2lts-mc( 0/ 4): Total memory used for chunk indexing: 0MB
pnml2lts-mc( 0/ 4): Est. total memory use: 2.9MB (~8192.0MB paged-in)
ltl formula name JoinFreeModules-PT-0100-LTLCardinality-05
ltl formula formula --ltl=/tmp/ltl_5_
pnml2lts-mc( 0/ 4): Loading model from model.pnml
pnml2lts-mc( 0/ 4): Edge label is id
pnml2lts-mc( 0/ 4): Petri net has 501 places, 801 transitions and 2302 arcs
pnml2lts-mc( 0/ 4): Petri net JoinFreeModules-PT-0100 analyzed
pnml2lts-mc( 0/ 4): There are no safe places
pnml2lts-mc( 0/ 4): Loading Petri net took 0.070 real 0.090 user 0.080 sys
pnml2lts-mc( 2/ 4): LTL layer: formula: /tmp/ltl_5_
pnml2lts-mc( 0/ 4): Weak Buchi automaton detected, adding non-accepting as progress label.
pnml2lts-mc( 0/ 4): There are 903 state labels and 1 edge labels
pnml2lts-mc( 0/ 4): State length is 502, there are 805 groups
pnml2lts-mc( 0/ 4): Running ufscc using 4 cores
pnml2lts-mc( 0/ 4): Using a tree table with 2^30 elements
pnml2lts-mc( 0/ 4): Successor permutation: dynamic
pnml2lts-mc( 0/ 4): Global bits: 0, count bits: 0, local bits: 0
pnml2lts-mc( 2/ 4):
pnml2lts-mc( 2/ 4): Accepting cycle FOUND at depth ~719!
pnml2lts-mc( 2/ 4):
pnml2lts-mc( 0/ 4):
pnml2lts-mc( 0/ 4): total scc count: 0
pnml2lts-mc( 0/ 4): unique states count: 3320
pnml2lts-mc( 0/ 4): unique transitions count: 670465
pnml2lts-mc( 0/ 4): - self-loop count: 0
pnml2lts-mc( 0/ 4): - claim dead count: 0
pnml2lts-mc( 0/ 4): - claim found count: 1
pnml2lts-mc( 0/ 4): - claim success count: 3323
pnml2lts-mc( 0/ 4): - cum. max stack depth: 3323
pnml2lts-mc( 0/ 4):
pnml2lts-mc( 0/ 4): Explored 3323 states 671072 transitions, fanout: 201.948
pnml2lts-mc( 0/ 4): Total exploration time 4.210 sec (4.200 sec minimum, 4.207 sec on average)
pnml2lts-mc( 0/ 4): States per second: 789, Transitions per second: 159400
pnml2lts-mc( 0/ 4):
pnml2lts-mc( 0/ 4): Queue width: 12B, total height: 0, memory: 0.00MB
pnml2lts-mc( 0/ 4): Tree memory: 10.5MB, 16.4 B/state, compr.: 0.8%
pnml2lts-mc( 0/ 4): Tree fill ratio (roots/leafs): 0.0%/0.0%
pnml2lts-mc( 0/ 4): Stored 814 string chucks using 0MB
pnml2lts-mc( 0/ 4): Total memory used for chunk indexing: 0MB
pnml2lts-mc( 0/ 4): Est. total memory use: 10.5MB (~8192.0MB paged-in)
ltl formula name JoinFreeModules-PT-0100-LTLCardinality-06
ltl formula formula --ltl=/tmp/ltl_6_
pnml2lts-mc( 0/ 4): Loading model from model.pnml
pnml2lts-mc( 0/ 4): Edge label is id
pnml2lts-mc( 0/ 4): Petri net has 501 places, 801 transitions and 2302 arcs
pnml2lts-mc( 0/ 4): Petri net JoinFreeModules-PT-0100 analyzed
pnml2lts-mc( 0/ 4): There are no safe places
pnml2lts-mc( 0/ 4): Loading Petri net took 0.090 real 0.130 user 0.060 sys
pnml2lts-mc( 0/ 4): LTL layer: formula: /tmp/ltl_6_
pnml2lts-mc( 0/ 4): buchi has 2 states
pnml2lts-mc( 0/ 4): Weak Buchi automaton detected, adding non-accepting as progress label.
pnml2lts-mc( 0/ 4): There are 903 state labels and 1 edge labels
pnml2lts-mc( 0/ 4): State length is 502, there are 803 groups
pnml2lts-mc( 0/ 4): Running ufscc using 4 cores
pnml2lts-mc( 0/ 4): Using a tree table with 2^30 elements
pnml2lts-mc( 0/ 4): Successor permutation: dynamic
pnml2lts-mc( 0/ 4): Global bits: 0, count bits: 0, local bits: 0
pnml2lts-mc( 3/ 4):
pnml2lts-mc( 3/ 4): Accepting cycle FOUND at depth ~505!
pnml2lts-mc( 3/ 4):
pnml2lts-mc( 0/ 4):
pnml2lts-mc( 0/ 4): total scc count: 0
pnml2lts-mc( 0/ 4): unique states count: 2157
pnml2lts-mc( 0/ 4): unique transitions count: 440074
pnml2lts-mc( 0/ 4): - self-loop count: 0
pnml2lts-mc( 0/ 4): - claim dead count: 0
pnml2lts-mc( 0/ 4): - claim found count: 1
pnml2lts-mc( 0/ 4): - claim success count: 2160
pnml2lts-mc( 0/ 4): - cum. max stack depth: 2160
pnml2lts-mc( 0/ 4):
pnml2lts-mc( 0/ 4): Explored 2160 states 440681 transitions, fanout: 204.019
pnml2lts-mc( 0/ 4): Total exploration time 3.080 sec (3.080 sec minimum, 3.080 sec on average)
pnml2lts-mc( 0/ 4): States per second: 701, Transitions per second: 143078
pnml2lts-mc( 0/ 4):
pnml2lts-mc( 0/ 4): Queue width: 12B, total height: 0, memory: 0.00MB
pnml2lts-mc( 0/ 4): Tree memory: 6.9MB, 16.4 B/state, compr.: 0.8%
pnml2lts-mc( 0/ 4): Tree fill ratio (roots/leafs): 0.0%/0.0%
pnml2lts-mc( 0/ 4): Stored 814 string chucks using 0MB
pnml2lts-mc( 0/ 4): Total memory used for chunk indexing: 0MB
pnml2lts-mc( 0/ 4): Est. total memory use: 6.9MB (~8192.0MB paged-in)
ltl formula name JoinFreeModules-PT-0100-LTLCardinality-07
ltl formula formula --ltl=/tmp/ltl_7_
pnml2lts-mc( 0/ 4): Loading model from model.pnml
pnml2lts-mc( 0/ 4): Edge label is id
pnml2lts-mc( 0/ 4): Petri net has 501 places, 801 transitions and 2302 arcs
pnml2lts-mc( 0/ 4): Petri net JoinFreeModules-PT-0100 analyzed
pnml2lts-mc( 0/ 4): There are no safe places
pnml2lts-mc( 0/ 4): Loading Petri net took 0.070 real 0.080 user 0.080 sys
pnml2lts-mc( 0/ 4): LTL layer: formula: /tmp/ltl_7_
pnml2lts-mc( 0/ 4): buchi has 1 states
pnml2lts-mc( 0/ 4): Weak Buchi automaton detected, adding non-accepting as progress label.
pnml2lts-mc( 0/ 4): There are 903 state labels and 1 edge labels
pnml2lts-mc( 0/ 4): State length is 502, there are 802 groups
pnml2lts-mc( 0/ 4): Running ufscc using 4 cores
pnml2lts-mc( 0/ 4): Using a tree table with 2^30 elements
pnml2lts-mc( 0/ 4): Successor permutation: dynamic
pnml2lts-mc( 0/ 4): Global bits: 0, count bits: 0, local bits: 0
pnml2lts-mc( 0/ 4):
pnml2lts-mc( 0/ 4): Accepting cycle FOUND at depth ~1!
pnml2lts-mc( 0/ 4):
pnml2lts-mc( 0/ 4):
pnml2lts-mc( 0/ 4): total scc count: 0
pnml2lts-mc( 0/ 4): unique states count: 1
pnml2lts-mc( 0/ 4): unique transitions count: 201
pnml2lts-mc( 0/ 4): - self-loop count: 4
pnml2lts-mc( 0/ 4): - claim dead count: 0
pnml2lts-mc( 0/ 4): - claim found count: 0
pnml2lts-mc( 0/ 4): - claim success count: 4
pnml2lts-mc( 0/ 4): - cum. max stack depth: 4
pnml2lts-mc( 0/ 4):
pnml2lts-mc( 0/ 4): Explored 4 states 808 transitions, fanout: 202.000
pnml2lts-mc( 0/ 4): Total exploration time 0.010 sec (0.010 sec minimum, 0.010 sec on average)
pnml2lts-mc( 0/ 4): States per second: 400, Transitions per second: 80800
pnml2lts-mc( 0/ 4):
pnml2lts-mc( 0/ 4): Queue width: 12B, total height: 0, memory: 0.00MB
pnml2lts-mc( 0/ 4): Tree memory: 0.0MB, 38.0 B/state, compr.: 1.9%
pnml2lts-mc( 0/ 4): Tree fill ratio (roots/leafs): 0.0%/0.0%
pnml2lts-mc( 0/ 4): Stored 814 string chucks using 0MB
pnml2lts-mc( 0/ 4): Total memory used for chunk indexing: 0MB
pnml2lts-mc( 0/ 4): Est. total memory use: 0.0MB (~8192.0MB paged-in)
ltl formula name JoinFreeModules-PT-0100-LTLCardinality-08
ltl formula formula --ltl=/tmp/ltl_8_
pnml2lts-mc( 0/ 4): Loading model from model.pnml
pnml2lts-mc( 0/ 4): Edge label is id
pnml2lts-mc( 0/ 4): Petri net has 501 places, 801 transitions and 2302 arcs
pnml2lts-mc( 0/ 4): Petri net JoinFreeModules-PT-0100 analyzed
pnml2lts-mc( 0/ 4): There are no safe places
pnml2lts-mc( 0/ 4): Loading Petri net took 0.080 real 0.090 user 0.080 sys
pnml2lts-mc( 1/ 4): LTL layer: formula: /tmp/ltl_8_
pnml2lts-mc( 0/ 4): Weak Buchi automaton detected, adding non-accepting as progress label.
pnml2lts-mc( 0/ 4): There are 903 state labels and 1 edge labels
pnml2lts-mc( 0/ 4): State length is 502, there are 802 groups
pnml2lts-mc( 0/ 4): Running ufscc using 4 cores
pnml2lts-mc( 0/ 4): Using a tree table with 2^30 elements
pnml2lts-mc( 0/ 4): Successor permutation: dynamic
pnml2lts-mc( 0/ 4): Global bits: 0, count bits: 0, local bits: 0
pnml2lts-mc( 1/ 4):
pnml2lts-mc( 1/ 4): Accepting cycle FOUND at depth ~1!
pnml2lts-mc( 1/ 4):
pnml2lts-mc( 0/ 4):
pnml2lts-mc( 0/ 4): total scc count: 0
pnml2lts-mc( 0/ 4): unique states count: 1
pnml2lts-mc( 0/ 4): unique transitions count: 201
pnml2lts-mc( 0/ 4): - self-loop count: 4
pnml2lts-mc( 0/ 4): - claim dead count: 0
pnml2lts-mc( 0/ 4): - claim found count: 0
pnml2lts-mc( 0/ 4): - claim success count: 4
pnml2lts-mc( 0/ 4): - cum. max stack depth: 4
pnml2lts-mc( 0/ 4):
pnml2lts-mc( 0/ 4): Explored 4 states 808 transitions, fanout: 202.000
pnml2lts-mc( 0/ 4): Total exploration time 0.010 sec (0.010 sec minimum, 0.010 sec on average)
pnml2lts-mc( 0/ 4): States per second: 400, Transitions per second: 80800
pnml2lts-mc( 0/ 4):
pnml2lts-mc( 0/ 4): Queue width: 12B, total height: 0, memory: 0.00MB
pnml2lts-mc( 0/ 4): Tree memory: 0.0MB, 38.0 B/state, compr.: 1.9%
pnml2lts-mc( 0/ 4): Tree fill ratio (roots/leafs): 0.0%/0.0%
pnml2lts-mc( 0/ 4): Stored 814 string chucks using 0MB
pnml2lts-mc( 0/ 4): Total memory used for chunk indexing: 0MB
pnml2lts-mc( 0/ 4): Est. total memory use: 0.0MB (~8192.0MB paged-in)
ltl formula name JoinFreeModules-PT-0100-LTLCardinality-09
ltl formula formula --ltl=/tmp/ltl_9_
pnml2lts-mc( 0/ 4): Loading model from model.pnml
pnml2lts-mc( 0/ 4): Edge label is id
pnml2lts-mc( 0/ 4): Petri net has 501 places, 801 transitions and 2302 arcs
pnml2lts-mc( 0/ 4): Petri net JoinFreeModules-PT-0100 analyzed
pnml2lts-mc( 0/ 4): There are no safe places
pnml2lts-mc( 0/ 4): Loading Petri net took 0.090 real 0.070 user 0.110 sys
pnml2lts-mc( 1/ 4): LTL layer: formula: /tmp/ltl_9_
pnml2lts-mc( 0/ 4): Weak Buchi automaton detected, adding non-accepting as progress label.
pnml2lts-mc( 0/ 4): There are 903 state labels and 1 edge labels
pnml2lts-mc( 0/ 4): State length is 502, there are 809 groups
pnml2lts-mc( 0/ 4): Running ufscc using 4 cores
pnml2lts-mc( 0/ 4): Using a tree table with 2^30 elements
pnml2lts-mc( 0/ 4): Successor permutation: dynamic
pnml2lts-mc( 0/ 4): Global bits: 0, count bits: 0, local bits: 0
pnml2lts-mc( 2/ 4): ~2500 levels ~10000 states ~3969856 transitions
pnml2lts-mc( 1/ 4):
pnml2lts-mc( 1/ 4): Accepting cycle FOUND at depth ~2914!
pnml2lts-mc( 1/ 4):
pnml2lts-mc( 0/ 4):
pnml2lts-mc( 0/ 4): total scc count: 0
pnml2lts-mc( 0/ 4): unique states count: 12371
pnml2lts-mc( 0/ 4): unique transitions count: 4967602
pnml2lts-mc( 0/ 4): - self-loop count: 0
pnml2lts-mc( 0/ 4): - claim dead count: 0
pnml2lts-mc( 0/ 4): - claim found count: 4267
pnml2lts-mc( 0/ 4): - claim success count: 12374
pnml2lts-mc( 0/ 4): - cum. max stack depth: 12374
pnml2lts-mc( 0/ 4):
pnml2lts-mc( 0/ 4): Explored 12374 states 4968209 transitions, fanout: 401.504
pnml2lts-mc( 0/ 4): Total exploration time 10.270 sec (10.260 sec minimum, 10.265 sec on average)
pnml2lts-mc( 0/ 4): States per second: 1205, Transitions per second: 483759
pnml2lts-mc( 0/ 4):
pnml2lts-mc( 0/ 4): Queue width: 12B, total height: 0, memory: 0.00MB
pnml2lts-mc( 0/ 4): Tree memory: 37.1MB, 15.6 B/state, compr.: 0.8%
pnml2lts-mc( 0/ 4): Tree fill ratio (roots/leafs): 0.0%/0.0%
pnml2lts-mc( 0/ 4): Stored 814 string chucks using 0MB
pnml2lts-mc( 0/ 4): Total memory used for chunk indexing: 0MB
pnml2lts-mc( 0/ 4): Est. total memory use: 37.1MB (~8192.0MB paged-in)
ltl formula name JoinFreeModules-PT-0100-LTLCardinality-10
ltl formula formula --ltl=/tmp/ltl_10_
pnml2lts-mc( 0/ 4): Loading model from model.pnml
pnml2lts-mc( 0/ 4): Edge label is id
pnml2lts-mc( 0/ 4): Petri net has 501 places, 801 transitions and 2302 arcs
pnml2lts-mc( 0/ 4): Petri net JoinFreeModules-PT-0100 analyzed
pnml2lts-mc( 0/ 4): There are no safe places
pnml2lts-mc( 0/ 4): Loading Petri net took 0.110 real 0.110 user 0.100 sys
pnml2lts-mc( 3/ 4): LTL layer: formula: /tmp/ltl_10_
pnml2lts-mc( 0/ 4): Weak Buchi automaton detected, adding non-accepting as progress label.
pnml2lts-mc( 0/ 4): There are 903 state labels and 1 edge labels
pnml2lts-mc( 0/ 4): State length is 502, there are 811 groups
pnml2lts-mc( 0/ 4): Running ufscc using 4 cores
pnml2lts-mc( 0/ 4): Using a tree table with 2^30 elements
pnml2lts-mc( 0/ 4): Successor permutation: dynamic
pnml2lts-mc( 0/ 4): Global bits: 0, count bits: 0, local bits: 0
pnml2lts-mc( 3/ 4):
pnml2lts-mc( 3/ 4): Accepting cycle FOUND at depth ~1!
pnml2lts-mc( 3/ 4):
pnml2lts-mc( 0/ 4):
pnml2lts-mc( 0/ 4): total scc count: 0
pnml2lts-mc( 0/ 4): unique states count: 1
pnml2lts-mc( 0/ 4): unique transitions count: 201
pnml2lts-mc( 0/ 4): - self-loop count: 4
pnml2lts-mc( 0/ 4): - claim dead count: 0
pnml2lts-mc( 0/ 4): - claim found count: 0
pnml2lts-mc( 0/ 4): - claim success count: 4
pnml2lts-mc( 0/ 4): - cum. max stack depth: 4
pnml2lts-mc( 0/ 4):
pnml2lts-mc( 0/ 4): Explored 4 states 808 transitions, fanout: 202.000
pnml2lts-mc( 0/ 4): Total exploration time 0.010 sec (0.010 sec minimum, 0.010 sec on average)
pnml2lts-mc( 0/ 4): States per second: 400, Transitions per second: 80800
pnml2lts-mc( 0/ 4):
pnml2lts-mc( 0/ 4): Queue width: 12B, total height: 0, memory: 0.00MB
pnml2lts-mc( 0/ 4): Tree memory: 0.0MB, 38.0 B/state, compr.: 1.9%
pnml2lts-mc( 0/ 4): Tree fill ratio (roots/leafs): 0.0%/0.0%
pnml2lts-mc( 0/ 4): Stored 814 string chucks using 0MB
pnml2lts-mc( 0/ 4): Total memory used for chunk indexing: 0MB
pnml2lts-mc( 0/ 4): Est. total memory use: 0.0MB (~8192.0MB paged-in)
ltl formula name JoinFreeModules-PT-0100-LTLCardinality-11
ltl formula formula --ltl=/tmp/ltl_11_
pnml2lts-mc( 0/ 4): Loading model from model.pnml
pnml2lts-mc( 0/ 4): Edge label is id
pnml2lts-mc( 0/ 4): Petri net has 501 places, 801 transitions and 2302 arcs
pnml2lts-mc( 0/ 4): Petri net JoinFreeModules-PT-0100 analyzed
pnml2lts-mc( 0/ 4): There are no safe places
pnml2lts-mc( 0/ 4): Loading Petri net took 0.260 real 0.120 user 0.210 sys
pnml2lts-mc( 1/ 4): LTL layer: formula: /tmp/ltl_11_
pnml2lts-mc( 0/ 4): Weak Buchi automaton detected, adding non-accepting as progress label.
pnml2lts-mc( 0/ 4): There are 903 state labels and 1 edge labels
pnml2lts-mc( 0/ 4): State length is 502, there are 804 groups
pnml2lts-mc( 0/ 4): Running ufscc using 4 cores
pnml2lts-mc( 0/ 4): Using a tree table with 2^30 elements
pnml2lts-mc( 0/ 4): Successor permutation: dynamic
pnml2lts-mc( 0/ 4): Global bits: 0, count bits: 0, local bits: 0
pnml2lts-mc( 1/ 4): ~2500 levels ~10000 states ~1992128 transitions
pnml2lts-mc( 1/ 4): ~5000 levels ~20000 states ~3971408 transitions
pnml2lts-mc( 1/ 4): ~10000 levels ~40000 states ~7904768 transitions
pnml2lts-mc( 1/ 4): ~20000 levels ~80000 states ~15770904 transitions
pnml2lts-mc( 1/ 4): ~40000 levels ~160000 states ~31407032 transitions
pnml2lts-mc( 1/ 4): ~80000 levels ~320000 states ~62765720 transitions
pnml2lts-mc( 1/ 4): ~160000 levels ~640000 states ~124666028 transitions
ltl formula name JoinFreeModules-PT-0100-LTLCardinality-12
ltl formula formula --ltl=/tmp/ltl_12_
pnml2lts-mc( 0/ 4): Loading model from model.pnml
pnml2lts-mc( 0/ 4): Edge label is id
pnml2lts-mc( 0/ 4): Petri net has 501 places, 801 transitions and 2302 arcs
pnml2lts-mc( 0/ 4): Petri net JoinFreeModules-PT-0100 analyzed
pnml2lts-mc( 0/ 4): There are no safe places
pnml2lts-mc( 0/ 4): Loading Petri net took 0.120 real 0.110 user 0.100 sys
pnml2lts-mc( 3/ 4): LTL layer: formula: /tmp/ltl_12_
pnml2lts-mc( 0/ 4): There are 902 state labels and 1 edge labels
pnml2lts-mc( 0/ 4): State length is 502, there are 805 groups
pnml2lts-mc( 0/ 4): Running ufscc using 4 cores
pnml2lts-mc( 0/ 4): Using a tree table with 2^30 elements
pnml2lts-mc( 0/ 4): Successor permutation: dynamic
pnml2lts-mc( 0/ 4): Global bits: 0, count bits: 0, local bits: 0
pnml2lts-mc( 1/ 4): ~2500 levels ~10000 states ~2058692 transitions
pnml2lts-mc( 2/ 4): ~5000 levels ~20000 states ~4002736 transitions
pnml2lts-mc( 2/ 4): ~10000 levels ~40000 states ~8040252 transitions
pnml2lts-mc( 2/ 4): ~20000 levels ~80000 states ~16124048 transitions
pnml2lts-mc( 2/ 4): ~40000 levels ~160000 states ~32350472 transitions
pnml2lts-mc( 0/ 4): ~80000 levels ~320000 states ~66238184 transitions
pnml2lts-mc( 0/ 4): ~160000 levels ~640000 states ~132627548 transitions
ltl formula name JoinFreeModules-PT-0100-LTLCardinality-13
ltl formula formula --ltl=/tmp/ltl_13_
pnml2lts-mc( 0/ 4): Loading model from model.pnml
pnml2lts-mc( 0/ 4): Edge label is id
pnml2lts-mc( 0/ 4): Petri net has 501 places, 801 transitions and 2302 arcs
pnml2lts-mc( 0/ 4): Petri net JoinFreeModules-PT-0100 analyzed
pnml2lts-mc( 0/ 4): There are no safe places
pnml2lts-mc( 0/ 4): Loading Petri net took 0.160 real 0.050 user 0.100 sys
pnml2lts-mc( 0/ 4): LTL layer: formula: /tmp/ltl_13_
pnml2lts-mc( 0/ 4): buchi has 2 states
pnml2lts-mc( 0/ 4): Weak Buchi automaton detected, adding non-accepting as progress label.
pnml2lts-mc( 0/ 4): There are 903 state labels and 1 edge labels
pnml2lts-mc( 0/ 4): State length is 502, there are 803 groups
pnml2lts-mc( 0/ 4): Running ufscc using 4 cores
pnml2lts-mc( 0/ 4): Using a tree table with 2^30 elements
pnml2lts-mc( 0/ 4): Successor permutation: dynamic
pnml2lts-mc( 0/ 4): Global bits: 0, count bits: 0, local bits: 0
pnml2lts-mc( 3/ 4):
pnml2lts-mc( 3/ 4): Accepting cycle FOUND at depth ~152!
pnml2lts-mc( 3/ 4):
pnml2lts-mc( 0/ 4):
pnml2lts-mc( 0/ 4): total scc count: 0
pnml2lts-mc( 0/ 4): unique states count: 689
pnml2lts-mc( 0/ 4): unique transitions count: 139135
pnml2lts-mc( 0/ 4): - self-loop count: 0
pnml2lts-mc( 0/ 4): - claim dead count: 0
pnml2lts-mc( 0/ 4): - claim found count: 1
pnml2lts-mc( 0/ 4): - claim success count: 692
pnml2lts-mc( 0/ 4): - cum. max stack depth: 692
pnml2lts-mc( 0/ 4):
pnml2lts-mc( 0/ 4): Explored 692 states 139742 transitions, fanout: 201.939
pnml2lts-mc( 0/ 4): Total exploration time 1.460 sec (1.440 sec minimum, 1.450 sec on average)
pnml2lts-mc( 0/ 4): States per second: 474, Transitions per second: 95714
pnml2lts-mc( 0/ 4):
pnml2lts-mc( 0/ 4): Queue width: 12B, total height: 0, memory: 0.00MB
pnml2lts-mc( 0/ 4): Tree memory: 2.1MB, 16.1 B/state, compr.: 0.8%
pnml2lts-mc( 0/ 4): Tree fill ratio (roots/leafs): 0.0%/0.0%
pnml2lts-mc( 0/ 4): Stored 814 string chucks using 0MB
pnml2lts-mc( 0/ 4): Total memory used for chunk indexing: 0MB
pnml2lts-mc( 0/ 4): Est. total memory use: 2.1MB (~8192.0MB paged-in)
ltl formula name JoinFreeModules-PT-0100-LTLCardinality-14
ltl formula formula --ltl=/tmp/ltl_14_
pnml2lts-mc( 0/ 4): Loading model from model.pnml
pnml2lts-mc( 0/ 4): Edge label is id
pnml2lts-mc( 0/ 4): Petri net has 501 places, 801 transitions and 2302 arcs
pnml2lts-mc( 0/ 4): Petri net JoinFreeModules-PT-0100 analyzed
pnml2lts-mc( 0/ 4): There are no safe places
pnml2lts-mc( 0/ 4): Loading Petri net took 0.080 real 0.080 user 0.090 sys
pnml2lts-mc( 1/ 4): LTL layer: formula: /tmp/ltl_14_
pnml2lts-mc( 0/ 4): Weak Buchi automaton detected, adding non-accepting as progress label.
pnml2lts-mc( 0/ 4): There are 903 state labels and 1 edge labels
pnml2lts-mc( 0/ 4): State length is 502, there are 805 groups
pnml2lts-mc( 0/ 4): Running ufscc using 4 cores
pnml2lts-mc( 0/ 4): Using a tree table with 2^30 elements
pnml2lts-mc( 0/ 4): Successor permutation: dynamic
pnml2lts-mc( 0/ 4): Global bits: 0, count bits: 0, local bits: 0
pnml2lts-mc( 3/ 4): ~4 levels ~10000 states ~12076 transitions
pnml2lts-mc( 3/ 4): ~4 levels ~20000 states ~23352 transitions
pnml2lts-mc( 3/ 4): ~4 levels ~40000 states ~48324 transitions
pnml2lts-mc( 3/ 4): ~4 levels ~80000 states ~141044 transitions
pnml2lts-mc( 3/ 4): ~4 levels ~160000 states ~314320 transitions
pnml2lts-mc( 3/ 4): ~4 levels ~320000 states ~644704 transitions
pnml2lts-mc( 3/ 4): ~4 levels ~640000 states ~1360188 transitions
pnml2lts-mc( 3/ 4): ~4 levels ~1280000 states ~3255184 transitions
pnml2lts-mc( 0/ 4):
pnml2lts-mc( 0/ 4): total scc count: 1414504
pnml2lts-mc( 0/ 4): unique states count: 1414504
pnml2lts-mc( 0/ 4): unique transitions count: 4141003
pnml2lts-mc( 0/ 4): - self-loop count: 0
pnml2lts-mc( 0/ 4): - claim dead count: 2730241
pnml2lts-mc( 0/ 4): - claim found count: 0
pnml2lts-mc( 0/ 4): - claim success count: 1414630
pnml2lts-mc( 0/ 4): - cum. max stack depth: 16
pnml2lts-mc( 0/ 4):
pnml2lts-mc( 0/ 4): Explored 1414630 states 4151042 transitions, fanout: 2.934
pnml2lts-mc( 0/ 4): Total exploration time 60.640 sec (60.640 sec minimum, 60.640 sec on average)
pnml2lts-mc( 0/ 4): States per second: 23328, Transitions per second: 68454
pnml2lts-mc( 0/ 4):
pnml2lts-mc( 0/ 4): Queue width: 12B, total height: 0, memory: 0.00MB
pnml2lts-mc( 0/ 4): Tree memory: 14.7MB, 10.9 B/state, compr.: 0.5%
pnml2lts-mc( 0/ 4): Tree fill ratio (roots/leafs): 0.0%/0.0%
pnml2lts-mc( 0/ 4): Stored 814 string chucks using 0MB
pnml2lts-mc( 0/ 4): Total memory used for chunk indexing: 0MB
pnml2lts-mc( 0/ 4): Est. total memory use: 14.7MB (~8192.0MB paged-in)
ltl formula name JoinFreeModules-PT-0100-LTLCardinality-15
ltl formula formula --ltl=/tmp/ltl_15_
pnml2lts-mc( 0/ 4): Loading model from model.pnml
pnml2lts-mc( 0/ 4): Edge label is id
pnml2lts-mc( 0/ 4): Petri net has 501 places, 801 transitions and 2302 arcs
pnml2lts-mc( 0/ 4): Petri net JoinFreeModules-PT-0100 analyzed
pnml2lts-mc( 0/ 4): There are no safe places
pnml2lts-mc( 2/ 4): LTL layer: formula: /tmp/ltl_15_
pnml2lts-mc( 0/ 4): Loading Petri net took 0.350 real 0.170 user 0.480 sys
pnml2lts-mc( 0/ 4): Weak Buchi automaton detected, adding non-accepting as progress label.
pnml2lts-mc( 0/ 4): There are 903 state labels and 1 edge labels
pnml2lts-mc( 0/ 4): State length is 502, there are 803 groups
pnml2lts-mc( 0/ 4): Running ufscc using 4 cores
pnml2lts-mc( 0/ 4): Using a tree table with 2^30 elements
pnml2lts-mc( 0/ 4): Successor permutation: dynamic
pnml2lts-mc( 0/ 4): Global bits: 0, count bits: 0, local bits: 0
pnml2lts-mc( 3/ 4):
pnml2lts-mc( 3/ 4): Accepting cycle FOUND at depth ~155!
pnml2lts-mc( 3/ 4):
pnml2lts-mc( 0/ 4):
pnml2lts-mc( 0/ 4): total scc count: 0
pnml2lts-mc( 0/ 4): unique states count: 653
pnml2lts-mc( 0/ 4): unique transitions count: 132309
pnml2lts-mc( 0/ 4): - self-loop count: 0
pnml2lts-mc( 0/ 4): - claim dead count: 0
pnml2lts-mc( 0/ 4): - claim found count: 1
pnml2lts-mc( 0/ 4): - claim success count: 656
pnml2lts-mc( 0/ 4): - cum. max stack depth: 656
pnml2lts-mc( 0/ 4):
pnml2lts-mc( 0/ 4): Explored 656 states 132916 transitions, fanout: 202.616
pnml2lts-mc( 0/ 4): Total exploration time 1.190 sec (1.170 sec minimum, 1.180 sec on average)
pnml2lts-mc( 0/ 4): States per second: 551, Transitions per second: 111694
pnml2lts-mc( 0/ 4):
pnml2lts-mc( 0/ 4): Queue width: 12B, total height: 0, memory: 0.00MB
pnml2lts-mc( 0/ 4): Tree memory: 2.2MB, 17.2 B/state, compr.: 0.9%
pnml2lts-mc( 0/ 4): Tree fill ratio (roots/leafs): 0.0%/0.0%
pnml2lts-mc( 0/ 4): Stored 814 string chucks using 0MB
pnml2lts-mc( 0/ 4): Total memory used for chunk indexing: 0MB
pnml2lts-mc( 0/ 4): Est. total memory use: 2.2MB (~8192.0MB paged-in)
Sequence of Actions to be Executed by the VM
This is useful if one wants to reexecute the tool in the VM from the submitted image disk.
set -x
# this is for BenchKit: configuration of major elements for the test
export BK_INPUT="JoinFreeModules-PT-0100"
export BK_EXAMINATION="LTLCardinality"
export BK_TOOL="ltsmin"
export BK_RESULT_DIR="/tmp/BK_RESULTS/OUTPUTS"
export BK_TIME_CONFINEMENT="3600"
export BK_MEMORY_CONFINEMENT="16384"
# this is specific to your benchmark or test
export BIN_DIR="$HOME/BenchKit/bin"
# remove the execution directoty if it exists (to avoid increse of .vmdk images)
if [ -d execution ] ; then
rm -rf execution
fi
tar xzf /home/mcc/BenchKit/INPUTS/JoinFreeModules-PT-0100.tgz
mv JoinFreeModules-PT-0100 execution
cd execution
pwd
ls -lh
# this is for BenchKit: explicit launching of the test
echo "====================================================================="
echo " Generated by BenchKit 2-3637"
echo " Executing tool ltsmin"
echo " Input is JoinFreeModules-PT-0100, examination is LTLCardinality"
echo " Time confinement is $BK_TIME_CONFINEMENT seconds"
echo " Memory confinement is 16384 MBytes"
echo " Number of cores is 4"
echo " Run identifier is r209-smll-152732259100339"
echo "====================================================================="
echo
echo "--------------------"
echo "content from stdout:"
echo
echo "=== Data for post analysis generated by BenchKit (invocation template)"
echo
if [ "LTLCardinality" = "UpperBounds" ] ; then
echo "The expected result is a vector of positive values"
echo NUM_VECTOR
elif [ "LTLCardinality" != "StateSpace" ] ; then
echo "The expected result is a vector of booleans"
echo BOOL_VECTOR
else
echo "no data necessary for post analysis"
fi
echo
if [ -f "LTLCardinality.txt" ] ; then
echo "here is the order used to build the result vector(from text file)"
for x in $(grep Property LTLCardinality.txt | cut -d ' ' -f 2 | sort -u) ; do
echo "FORMULA_NAME $x"
done
elif [ -f "LTLCardinality.xml" ] ; then # for cunf (txt files deleted;-)
echo echo "here is the order used to build the result vector(from xml file)"
for x in $(grep '
echo "FORMULA_NAME $x"
done
fi
echo
echo "=== Now, execution of the tool begins"
echo
echo -n "BK_START "
date -u +%s%3N
echo
timeout -s 9 $BK_TIME_CONFINEMENT bash -c "/home/mcc/BenchKit/BenchKit_head.sh 2> STDERR ; echo ; echo -n \"BK_STOP \" ; date -u +%s%3N"
if [ $? -eq 137 ] ; then
echo
echo "BK_TIME_CONFINEMENT_REACHED"
fi
echo
echo "--------------------"
echo "content from stderr:"
echo
cat STDERR ;