

About the Execution of LTSMin for JoinFreeModules-PT-0050
| Execution Summary | |||||
| Max Memory Used (MB) |
Time wait (ms) | CPU Usage (ms) | I/O Wait (ms) | Computed Result | Execution Status |
| 15913.580 | 126897.00 | 424890.00 | 3387.80 | FFFFFT?FFFFTFFFF | normal |
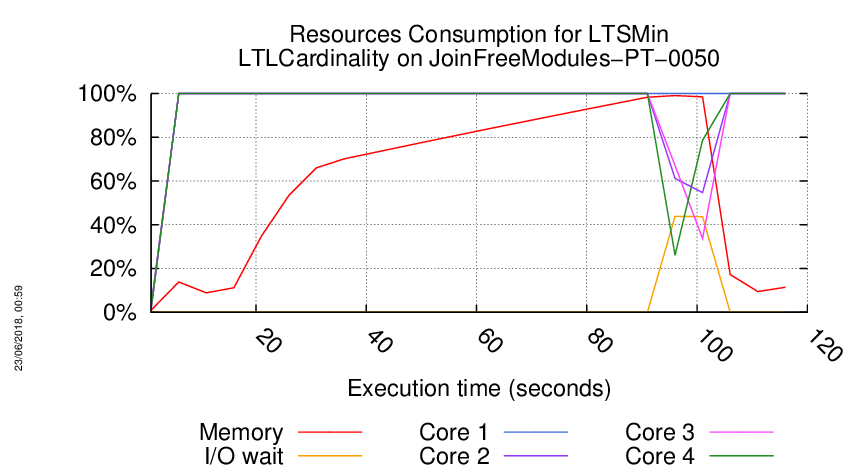
Execution Chart
We display below the execution chart for this examination (boot time has been removed).
Trace from the execution
Waiting for the VM to be ready (probing ssh)
...................
/home/mcc/execution
total 440K
-rw-r--r-- 1 mcc users 3.2K May 15 18:54 CTLCardinality.txt
-rw-r--r-- 1 mcc users 17K May 15 18:54 CTLCardinality.xml
-rw-r--r-- 1 mcc users 2.3K May 15 18:54 CTLFireability.txt
-rw-r--r-- 1 mcc users 13K May 15 18:54 CTLFireability.xml
-rw-r--r-- 1 mcc users 4.0K May 15 18:50 GenericPropertiesDefinition.xml
-rw-r--r-- 1 mcc users 5.7K May 15 18:50 GenericPropertiesVerdict.xml
-rw-r--r-- 1 mcc users 2.4K May 26 09:26 LTLCardinality.txt
-rw-r--r-- 1 mcc users 11K May 26 09:26 LTLCardinality.xml
-rw-r--r-- 1 mcc users 2.0K May 26 09:26 LTLFireability.txt
-rw-r--r-- 1 mcc users 9.3K May 26 09:26 LTLFireability.xml
-rw-r--r-- 1 mcc users 3.6K May 15 18:54 ReachabilityCardinality.txt
-rw-r--r-- 1 mcc users 18K May 15 18:54 ReachabilityCardinality.xml
-rw-r--r-- 1 mcc users 114 May 15 18:54 ReachabilityDeadlock.txt
-rw-r--r-- 1 mcc users 352 May 15 18:54 ReachabilityDeadlock.xml
-rw-r--r-- 1 mcc users 2.3K May 15 18:54 ReachabilityFireability.txt
-rw-r--r-- 1 mcc users 11K May 15 18:54 ReachabilityFireability.xml
-rw-r--r-- 1 mcc users 1.7K May 15 18:54 UpperBounds.txt
-rw-r--r-- 1 mcc users 3.7K May 15 18:54 UpperBounds.xml
-rw-r--r-- 1 mcc users 6 May 15 18:50 equiv_col
-rw-r--r-- 1 mcc users 5 May 15 18:50 instance
-rw-r--r-- 1 mcc users 6 May 15 18:50 iscolored
-rw-r--r-- 1 mcc users 282K May 15 18:50 model.pnml
=====================================================================
Generated by BenchKit 2-3637
Executing tool ltsmin
Input is JoinFreeModules-PT-0050, examination is LTLCardinality
Time confinement is 3600 seconds
Memory confinement is 16384 MBytes
Number of cores is 4
Run identifier is r209-smll-152732259100337
=====================================================================
--------------------
content from stdout:
=== Data for post analysis generated by BenchKit (invocation template)
The expected result is a vector of booleans
BOOL_VECTOR
here is the order used to build the result vector(from text file)
FORMULA_NAME JoinFreeModules-PT-0050-LTLCardinality-00
FORMULA_NAME JoinFreeModules-PT-0050-LTLCardinality-01
FORMULA_NAME JoinFreeModules-PT-0050-LTLCardinality-02
FORMULA_NAME JoinFreeModules-PT-0050-LTLCardinality-03
FORMULA_NAME JoinFreeModules-PT-0050-LTLCardinality-04
FORMULA_NAME JoinFreeModules-PT-0050-LTLCardinality-05
FORMULA_NAME JoinFreeModules-PT-0050-LTLCardinality-06
FORMULA_NAME JoinFreeModules-PT-0050-LTLCardinality-07
FORMULA_NAME JoinFreeModules-PT-0050-LTLCardinality-08
FORMULA_NAME JoinFreeModules-PT-0050-LTLCardinality-09
FORMULA_NAME JoinFreeModules-PT-0050-LTLCardinality-10
FORMULA_NAME JoinFreeModules-PT-0050-LTLCardinality-11
FORMULA_NAME JoinFreeModules-PT-0050-LTLCardinality-12
FORMULA_NAME JoinFreeModules-PT-0050-LTLCardinality-13
FORMULA_NAME JoinFreeModules-PT-0050-LTLCardinality-14
FORMULA_NAME JoinFreeModules-PT-0050-LTLCardinality-15
=== Now, execution of the tool begins
BK_START 1527386889274
FORMULA JoinFreeModules-PT-0050-LTLCardinality-00 FALSE TECHNIQUES EXPLICIT PARALLEL_PROCESSING USE_NUPN
FORMULA JoinFreeModules-PT-0050-LTLCardinality-01 FALSE TECHNIQUES EXPLICIT PARALLEL_PROCESSING USE_NUPN
FORMULA JoinFreeModules-PT-0050-LTLCardinality-02 FALSE TECHNIQUES EXPLICIT PARALLEL_PROCESSING USE_NUPN
FORMULA JoinFreeModules-PT-0050-LTLCardinality-03 FALSE TECHNIQUES EXPLICIT PARALLEL_PROCESSING USE_NUPN
FORMULA JoinFreeModules-PT-0050-LTLCardinality-04 FALSE TECHNIQUES EXPLICIT PARALLEL_PROCESSING USE_NUPN
FORMULA JoinFreeModules-PT-0050-LTLCardinality-05 TRUE TECHNIQUES EXPLICIT PARALLEL_PROCESSING USE_NUPN
FORMULA JoinFreeModules-PT-0050-LTLCardinality-06 CANNOT_COMPUTE
FORMULA JoinFreeModules-PT-0050-LTLCardinality-07 FALSE TECHNIQUES EXPLICIT PARALLEL_PROCESSING USE_NUPN
FORMULA JoinFreeModules-PT-0050-LTLCardinality-08 FALSE TECHNIQUES EXPLICIT PARALLEL_PROCESSING USE_NUPN
FORMULA JoinFreeModules-PT-0050-LTLCardinality-09 FALSE TECHNIQUES EXPLICIT PARALLEL_PROCESSING USE_NUPN
FORMULA JoinFreeModules-PT-0050-LTLCardinality-10 FALSE TECHNIQUES EXPLICIT PARALLEL_PROCESSING USE_NUPN
FORMULA JoinFreeModules-PT-0050-LTLCardinality-11 TRUE TECHNIQUES EXPLICIT PARALLEL_PROCESSING USE_NUPN
FORMULA JoinFreeModules-PT-0050-LTLCardinality-12 FALSE TECHNIQUES EXPLICIT PARALLEL_PROCESSING USE_NUPN
FORMULA JoinFreeModules-PT-0050-LTLCardinality-13 FALSE TECHNIQUES EXPLICIT PARALLEL_PROCESSING USE_NUPN
FORMULA JoinFreeModules-PT-0050-LTLCardinality-14 FALSE TECHNIQUES EXPLICIT PARALLEL_PROCESSING USE_NUPN
FORMULA JoinFreeModules-PT-0050-LTLCardinality-15 FALSE TECHNIQUES EXPLICIT PARALLEL_PROCESSING USE_NUPN
BK_STOP 1527387016171
--------------------
content from stderr:
mcc2018
ltl formula name JoinFreeModules-PT-0050-LTLCardinality-00
ltl formula formula --ltl=/tmp/ltl_0_
pnml2lts-mc( 0/ 4): Loading model from model.pnml
pnml2lts-mc( 0/ 4): Edge label is id
pnml2lts-mc( 0/ 4): Petri net has 251 places, 401 transitions and 1152 arcs
pnml2lts-mc( 0/ 4): Petri net JoinFreeModules-PT-0050 analyzed
pnml2lts-mc( 0/ 4): There are no safe places
pnml2lts-mc( 2/ 4): LTL layer: formula: /tmp/ltl_0_
pnml2lts-mc( 0/ 4): Loading Petri net took 0.050 real 0.040 user 0.060 sys
pnml2lts-mc( 0/ 4): Weak Buchi automaton detected, adding non-accepting as progress label.
pnml2lts-mc( 0/ 4): There are 453 state labels and 1 edge labels
pnml2lts-mc( 0/ 4): State length is 252, there are 407 groups
pnml2lts-mc( 0/ 4): Running ufscc using 4 cores
pnml2lts-mc( 0/ 4): Using a tree table with 2^30 elements
pnml2lts-mc( 0/ 4): Successor permutation: dynamic
pnml2lts-mc( 0/ 4): Global bits: 0, count bits: 0, local bits: 0
pnml2lts-mc( 2/ 4):
pnml2lts-mc( 2/ 4): Accepting cycle FOUND at depth ~460!
pnml2lts-mc( 2/ 4):
pnml2lts-mc( 0/ 4):
pnml2lts-mc( 0/ 4): total scc count: 0
pnml2lts-mc( 0/ 4): unique states count: 1962
pnml2lts-mc( 0/ 4): unique transitions count: 198453
pnml2lts-mc( 0/ 4): - self-loop count: 0
pnml2lts-mc( 0/ 4): - claim dead count: 0
pnml2lts-mc( 0/ 4): - claim found count: 203
pnml2lts-mc( 0/ 4): - claim success count: 1965
pnml2lts-mc( 0/ 4): - cum. max stack depth: 1965
pnml2lts-mc( 0/ 4):
pnml2lts-mc( 0/ 4): Explored 1965 states 198760 transitions, fanout: 101.150
pnml2lts-mc( 0/ 4): Total exploration time 1.950 sec (1.950 sec minimum, 1.950 sec on average)
pnml2lts-mc( 0/ 4): States per second: 1008, Transitions per second: 101928
pnml2lts-mc( 0/ 4):
pnml2lts-mc( 0/ 4): Queue width: 12B, total height: 0, memory: 0.00MB
pnml2lts-mc( 0/ 4): Tree memory: 3.2MB, 16.7 B/state, compr.: 1.7%
pnml2lts-mc( 0/ 4): Tree fill ratio (roots/leafs): 0.0%/0.0%
pnml2lts-mc( 0/ 4): Stored 405 string chucks using 0MB
pnml2lts-mc( 0/ 4): Total memory used for chunk indexing: 0MB
pnml2lts-mc( 0/ 4): Est. total memory use: 3.2MB (~8192.0MB paged-in)
ltl formula name JoinFreeModules-PT-0050-LTLCardinality-01
ltl formula formula --ltl=/tmp/ltl_1_
pnml2lts-mc( 0/ 4): Loading model from model.pnml
pnml2lts-mc( 0/ 4): Edge label is id
pnml2lts-mc( 0/ 4): Petri net has 251 places, 401 transitions and 1152 arcs
pnml2lts-mc( 0/ 4): Petri net JoinFreeModules-PT-0050 analyzed
pnml2lts-mc( 0/ 4): There are no safe places
pnml2lts-mc( 0/ 4): Loading Petri net took 0.040 real 0.050 user 0.040 sys
pnml2lts-mc( 1/ 4): LTL layer: formula: /tmp/ltl_1_
pnml2lts-mc( 0/ 4): Weak Buchi automaton detected, adding non-accepting as progress label.
pnml2lts-mc( 0/ 4): There are 453 state labels and 1 edge labels
pnml2lts-mc( 0/ 4): State length is 252, there are 404 groups
pnml2lts-mc( 0/ 4): Running ufscc using 4 cores
pnml2lts-mc( 0/ 4): Using a tree table with 2^30 elements
pnml2lts-mc( 0/ 4): Successor permutation: dynamic
pnml2lts-mc( 0/ 4): Global bits: 0, count bits: 0, local bits: 0
pnml2lts-mc( 0/ 4):
pnml2lts-mc( 0/ 4): Accepting cycle FOUND at depth ~650!
pnml2lts-mc( 0/ 4):
pnml2lts-mc( 0/ 4):
pnml2lts-mc( 0/ 4): total scc count: 0
pnml2lts-mc( 0/ 4): unique states count: 2395
pnml2lts-mc( 0/ 4): unique transitions count: 491715
pnml2lts-mc( 0/ 4): - self-loop count: 4
pnml2lts-mc( 0/ 4): - claim dead count: 0
pnml2lts-mc( 0/ 4): - claim found count: 132
pnml2lts-mc( 0/ 4): - claim success count: 2398
pnml2lts-mc( 0/ 4): - cum. max stack depth: 2398
pnml2lts-mc( 0/ 4):
pnml2lts-mc( 0/ 4): Explored 2398 states 492325 transitions, fanout: 205.307
pnml2lts-mc( 0/ 4): Total exploration time 3.110 sec (3.100 sec minimum, 3.105 sec on average)
pnml2lts-mc( 0/ 4): States per second: 771, Transitions per second: 158304
pnml2lts-mc( 0/ 4):
pnml2lts-mc( 0/ 4): Queue width: 12B, total height: 0, memory: 0.00MB
pnml2lts-mc( 0/ 4): Tree memory: 6.3MB, 13.4 B/state, compr.: 1.3%
pnml2lts-mc( 0/ 4): Tree fill ratio (roots/leafs): 0.0%/0.0%
pnml2lts-mc( 0/ 4): Stored 405 string chucks using 0MB
pnml2lts-mc( 0/ 4): Total memory used for chunk indexing: 0MB
pnml2lts-mc( 0/ 4): Est. total memory use: 6.3MB (~8192.0MB paged-in)
ltl formula name JoinFreeModules-PT-0050-LTLCardinality-02
ltl formula formula --ltl=/tmp/ltl_2_
pnml2lts-mc( 0/ 4): Loading model from model.pnml
pnml2lts-mc( 0/ 4): Edge label is id
pnml2lts-mc( 0/ 4): Petri net has 251 places, 401 transitions and 1152 arcs
pnml2lts-mc( 0/ 4): Petri net JoinFreeModules-PT-0050 analyzed
pnml2lts-mc( 0/ 4): There are no safe places
pnml2lts-mc( 0/ 4): Loading Petri net took 0.040 real 0.050 user 0.050 sys
pnml2lts-mc( 2/ 4): LTL layer: formula: /tmp/ltl_2_
pnml2lts-mc( 0/ 4): Weak Buchi automaton detected, adding non-accepting as progress label.
pnml2lts-mc( 0/ 4): There are 453 state labels and 1 edge labels
pnml2lts-mc( 0/ 4): State length is 252, there are 403 groups
pnml2lts-mc( 0/ 4): Running ufscc using 4 cores
pnml2lts-mc( 0/ 4): Using a tree table with 2^30 elements
pnml2lts-mc( 0/ 4): Successor permutation: dynamic
pnml2lts-mc( 0/ 4): Global bits: 0, count bits: 0, local bits: 0
pnml2lts-mc( 0/ 4):
pnml2lts-mc( 0/ 4): Accepting cycle FOUND at depth ~280!
pnml2lts-mc( 0/ 4):
pnml2lts-mc( 0/ 4):
pnml2lts-mc( 0/ 4): total scc count: 0
pnml2lts-mc( 0/ 4): unique states count: 1125
pnml2lts-mc( 0/ 4): unique transitions count: 112151
pnml2lts-mc( 0/ 4): - self-loop count: 0
pnml2lts-mc( 0/ 4): - claim dead count: 0
pnml2lts-mc( 0/ 4): - claim found count: 1
pnml2lts-mc( 0/ 4): - claim success count: 1128
pnml2lts-mc( 0/ 4): - cum. max stack depth: 1128
pnml2lts-mc( 0/ 4):
pnml2lts-mc( 0/ 4): Explored 1128 states 112458 transitions, fanout: 99.697
pnml2lts-mc( 0/ 4): Total exploration time 0.890 sec (0.880 sec minimum, 0.885 sec on average)
pnml2lts-mc( 0/ 4): States per second: 1267, Transitions per second: 126357
pnml2lts-mc( 0/ 4):
pnml2lts-mc( 0/ 4): Queue width: 12B, total height: 0, memory: 0.00MB
pnml2lts-mc( 0/ 4): Tree memory: 1.7MB, 15.8 B/state, compr.: 1.6%
pnml2lts-mc( 0/ 4): Tree fill ratio (roots/leafs): 0.0%/0.0%
pnml2lts-mc( 0/ 4): Stored 405 string chucks using 0MB
pnml2lts-mc( 0/ 4): Total memory used for chunk indexing: 0MB
pnml2lts-mc( 0/ 4): Est. total memory use: 1.7MB (~8192.0MB paged-in)
ltl formula name JoinFreeModules-PT-0050-LTLCardinality-03
ltl formula formula --ltl=/tmp/ltl_3_
pnml2lts-mc( 0/ 4): Loading model from model.pnml
pnml2lts-mc( 0/ 4): Edge label is id
pnml2lts-mc( 0/ 4): Petri net has 251 places, 401 transitions and 1152 arcs
pnml2lts-mc( 0/ 4): Petri net JoinFreeModules-PT-0050 analyzed
pnml2lts-mc( 0/ 4): There are no safe places
pnml2lts-mc( 0/ 4): Loading Petri net took 0.040 real 0.050 user 0.040 sys
pnml2lts-mc( 3/ 4): LTL layer: formula: /tmp/ltl_3_
pnml2lts-mc( 0/ 4): Weak Buchi automaton detected, adding non-accepting as progress label.
pnml2lts-mc( 0/ 4): There are 453 state labels and 1 edge labels
pnml2lts-mc( 0/ 4): State length is 252, there are 409 groups
pnml2lts-mc( 0/ 4): Running ufscc using 4 cores
pnml2lts-mc( 0/ 4): Using a tree table with 2^30 elements
pnml2lts-mc( 0/ 4): Successor permutation: dynamic
pnml2lts-mc( 0/ 4): Global bits: 0, count bits: 0, local bits: 0
pnml2lts-mc( 2/ 4):
pnml2lts-mc( 2/ 4): Accepting cycle FOUND at depth ~314!
pnml2lts-mc( 2/ 4):
pnml2lts-mc( 0/ 4):
pnml2lts-mc( 0/ 4): total scc count: 0
pnml2lts-mc( 0/ 4): unique states count: 1217
pnml2lts-mc( 0/ 4): unique transitions count: 122804
pnml2lts-mc( 0/ 4): - self-loop count: 0
pnml2lts-mc( 0/ 4): - claim dead count: 0
pnml2lts-mc( 0/ 4): - claim found count: 1
pnml2lts-mc( 0/ 4): - claim success count: 1220
pnml2lts-mc( 0/ 4): - cum. max stack depth: 1220
pnml2lts-mc( 0/ 4):
pnml2lts-mc( 0/ 4): Explored 1220 states 123111 transitions, fanout: 100.911
pnml2lts-mc( 0/ 4): Total exploration time 0.990 sec (0.990 sec minimum, 0.990 sec on average)
pnml2lts-mc( 0/ 4): States per second: 1232, Transitions per second: 124355
pnml2lts-mc( 0/ 4):
pnml2lts-mc( 0/ 4): Queue width: 12B, total height: 0, memory: 0.00MB
pnml2lts-mc( 0/ 4): Tree memory: 1.9MB, 16.4 B/state, compr.: 1.6%
pnml2lts-mc( 0/ 4): Tree fill ratio (roots/leafs): 0.0%/0.0%
pnml2lts-mc( 0/ 4): Stored 405 string chucks using 0MB
pnml2lts-mc( 0/ 4): Total memory used for chunk indexing: 0MB
pnml2lts-mc( 0/ 4): Est. total memory use: 1.9MB (~8192.0MB paged-in)
ltl formula name JoinFreeModules-PT-0050-LTLCardinality-04
ltl formula formula --ltl=/tmp/ltl_4_
pnml2lts-mc( 0/ 4): Loading model from model.pnml
pnml2lts-mc( 0/ 4): Edge label is id
pnml2lts-mc( 0/ 4): Petri net has 251 places, 401 transitions and 1152 arcs
pnml2lts-mc( 0/ 4): Petri net JoinFreeModules-PT-0050 analyzed
pnml2lts-mc( 0/ 4): There are no safe places
pnml2lts-mc( 0/ 4): Loading Petri net took 0.040 real 0.030 user 0.060 sys
pnml2lts-mc( 1/ 4): LTL layer: formula: /tmp/ltl_4_
pnml2lts-mc( 0/ 4): Weak Buchi automaton detected, adding non-accepting as progress label.
pnml2lts-mc( 0/ 4): There are 453 state labels and 1 edge labels
pnml2lts-mc( 0/ 4): State length is 252, there are 404 groups
pnml2lts-mc( 0/ 4): Running ufscc using 4 cores
pnml2lts-mc( 0/ 4): Using a tree table with 2^30 elements
pnml2lts-mc( 0/ 4): Successor permutation: dynamic
pnml2lts-mc( 0/ 4): Global bits: 0, count bits: 0, local bits: 0
pnml2lts-mc( 2/ 4):
pnml2lts-mc( 2/ 4): Accepting cycle FOUND at depth ~792!
pnml2lts-mc( 2/ 4):
pnml2lts-mc( 0/ 4):
pnml2lts-mc( 0/ 4): total scc count: 0
pnml2lts-mc( 0/ 4): unique states count: 3413
pnml2lts-mc( 0/ 4): unique transitions count: 604983
pnml2lts-mc( 0/ 4): - self-loop count: 4
pnml2lts-mc( 0/ 4): - claim dead count: 0
pnml2lts-mc( 0/ 4): - claim found count: 486
pnml2lts-mc( 0/ 4): - claim success count: 3416
pnml2lts-mc( 0/ 4): - cum. max stack depth: 3416
pnml2lts-mc( 0/ 4):
pnml2lts-mc( 0/ 4): Explored 3416 states 605593 transitions, fanout: 177.281
pnml2lts-mc( 0/ 4): Total exploration time 3.680 sec (3.680 sec minimum, 3.680 sec on average)
pnml2lts-mc( 0/ 4): States per second: 928, Transitions per second: 164563
pnml2lts-mc( 0/ 4):
pnml2lts-mc( 0/ 4): Queue width: 12B, total height: 0, memory: 0.00MB
pnml2lts-mc( 0/ 4): Tree memory: 8.2MB, 14.2 B/state, compr.: 1.4%
pnml2lts-mc( 0/ 4): Tree fill ratio (roots/leafs): 0.0%/0.0%
pnml2lts-mc( 0/ 4): Stored 405 string chucks using 0MB
pnml2lts-mc( 0/ 4): Total memory used for chunk indexing: 0MB
pnml2lts-mc( 0/ 4): Est. total memory use: 8.2MB (~8192.0MB paged-in)
ltl formula name JoinFreeModules-PT-0050-LTLCardinality-05
ltl formula formula --ltl=/tmp/ltl_5_
pnml2lts-mc( 0/ 4): Loading model from model.pnml
pnml2lts-mc( 0/ 4): Edge label is id
pnml2lts-mc( 0/ 4): Petri net has 251 places, 401 transitions and 1152 arcs
pnml2lts-mc( 0/ 4): Petri net JoinFreeModules-PT-0050 analyzed
pnml2lts-mc( 0/ 4): There are no safe places
pnml2lts-mc( 0/ 4): Loading Petri net took 0.040 real 0.050 user 0.050 sys
pnml2lts-mc( 1/ 4): LTL layer: formula: /tmp/ltl_5_
pnml2lts-mc( 0/ 4): Weak Buchi automaton detected, adding non-accepting as progress label.
pnml2lts-mc( 0/ 4): There are 453 state labels and 1 edge labels
pnml2lts-mc( 0/ 4): State length is 252, there are 402 groups
pnml2lts-mc( 0/ 4): Running ufscc using 4 cores
pnml2lts-mc( 0/ 4): Using a tree table with 2^30 elements
pnml2lts-mc( 0/ 4): Successor permutation: dynamic
pnml2lts-mc( 0/ 4): Global bits: 0, count bits: 0, local bits: 0
pnml2lts-mc( 0/ 4):
pnml2lts-mc( 0/ 4): total scc count: 1
pnml2lts-mc( 0/ 4): unique states count: 1
pnml2lts-mc( 0/ 4): unique transitions count: 0
pnml2lts-mc( 0/ 4): - self-loop count: 0
pnml2lts-mc( 0/ 4): - claim dead count: 0
pnml2lts-mc( 0/ 4): - claim found count: 0
pnml2lts-mc( 0/ 4): - claim success count: 4
pnml2lts-mc( 0/ 4): - cum. max stack depth: 4
pnml2lts-mc( 0/ 4):
pnml2lts-mc( 0/ 4): Explored 4 states 4 transitions, fanout: 1.000
pnml2lts-mc( 0/ 4): Total exploration time 0.000 sec (0.000 sec minimum, 0.000 sec on average)
pnml2lts-mc( 0/ 4): States per second: inf, Transitions per second: inf
pnml2lts-mc( 0/ 4):
pnml2lts-mc( 0/ 4): Queue width: 12B, total height: 0, memory: 0.00MB
pnml2lts-mc( 0/ 4): Tree memory: 0.0MB, 288.0 B/state, compr.: 28.5%
pnml2lts-mc( 0/ 4): Tree fill ratio (roots/leafs): 0.0%/0.0%
pnml2lts-mc( 0/ 4): Stored 405 string chucks using 0MB
pnml2lts-mc( 0/ 4): Total memory used for chunk indexing: 0MB
pnml2lts-mc( 0/ 4): Est. total memory use: 0.0MB (~8192.0MB paged-in)
ltl formula name JoinFreeModules-PT-0050-LTLCardinality-06
ltl formula formula --ltl=/tmp/ltl_6_
pnml2lts-mc( 0/ 4): Loading model from model.pnml
pnml2lts-mc( 0/ 4): Edge label is id
pnml2lts-mc( 0/ 4): Petri net has 251 places, 401 transitions and 1152 arcs
pnml2lts-mc( 0/ 4): Petri net JoinFreeModules-PT-0050 analyzed
pnml2lts-mc( 0/ 4): There are no safe places
pnml2lts-mc( 0/ 4): Loading Petri net took 0.090 real 0.220 user 0.060 sys
pnml2lts-mc( 2/ 4): LTL layer: formula: /tmp/ltl_6_
pnml2lts-mc( 0/ 4): There are 452 state labels and 1 edge labels
pnml2lts-mc( 0/ 4): State length is 252, there are 412 groups
pnml2lts-mc( 0/ 4): Running ufscc using 4 cores
pnml2lts-mc( 0/ 4): Using a tree table with 2^30 elements
pnml2lts-mc( 0/ 4): Successor permutation: dynamic
pnml2lts-mc( 0/ 4): Global bits: 0, count bits: 0, local bits: 0
pnml2lts-mc( 0/ 4): ~2500 levels ~10000 states ~1048900 transitions
pnml2lts-mc( 2/ 4): ~5000 levels ~20000 states ~2033852 transitions
pnml2lts-mc( 0/ 4): ~10000 levels ~40000 states ~4197436 transitions
pnml2lts-mc( 3/ 4): ~20000 levels ~80000 states ~8509852 transitions
pnml2lts-mc( 3/ 4): ~40000 levels ~160000 states ~17125668 transitions
pnml2lts-mc( 3/ 4): ~80000 levels ~320000 states ~34481548 transitions
pnml2lts-mc( 0/ 4): ~160000 levels ~640000 states ~65268252 transitions
ltl formula name JoinFreeModules-PT-0050-LTLCardinality-07
ltl formula formula --ltl=/tmp/ltl_7_
pnml2lts-mc( 0/ 4): Loading model from model.pnml
pnml2lts-mc( 0/ 4): Edge label is id
pnml2lts-mc( 0/ 4): Petri net has 251 places, 401 transitions and 1152 arcs
pnml2lts-mc( 0/ 4): Petri net JoinFreeModules-PT-0050 analyzed
pnml2lts-mc( 0/ 4): There are no safe places
pnml2lts-mc( 0/ 4): Loading Petri net took 0.040 real 0.050 user 0.040 sys
pnml2lts-mc( 1/ 4): LTL layer: formula: /tmp/ltl_7_
pnml2lts-mc( 0/ 4): Weak Buchi automaton detected, adding non-accepting as progress label.
pnml2lts-mc( 0/ 4): There are 453 state labels and 1 edge labels
pnml2lts-mc( 0/ 4): State length is 252, there are 404 groups
pnml2lts-mc( 0/ 4): Running ufscc using 4 cores
pnml2lts-mc( 0/ 4): Using a tree table with 2^30 elements
pnml2lts-mc( 0/ 4): Successor permutation: dynamic
pnml2lts-mc( 0/ 4): Global bits: 0, count bits: 0, local bits: 0
pnml2lts-mc( 1/ 4):
pnml2lts-mc( 1/ 4): Accepting cycle FOUND at depth ~1007!
pnml2lts-mc( 1/ 4):
pnml2lts-mc( 0/ 4):
pnml2lts-mc( 0/ 4): total scc count: 0
pnml2lts-mc( 0/ 4): unique states count: 5094
pnml2lts-mc( 0/ 4): unique transitions count: 651467
pnml2lts-mc( 0/ 4): - self-loop count: 4
pnml2lts-mc( 0/ 4): - claim dead count: 0
pnml2lts-mc( 0/ 4): - claim found count: 2576
pnml2lts-mc( 0/ 4): - claim success count: 5097
pnml2lts-mc( 0/ 4): - cum. max stack depth: 5097
pnml2lts-mc( 0/ 4):
pnml2lts-mc( 0/ 4): Explored 5097 states 651774 transitions, fanout: 127.874
pnml2lts-mc( 0/ 4): Total exploration time 3.820 sec (3.810 sec minimum, 3.812 sec on average)
pnml2lts-mc( 0/ 4): States per second: 1334, Transitions per second: 170621
pnml2lts-mc( 0/ 4):
pnml2lts-mc( 0/ 4): Queue width: 12B, total height: 0, memory: 0.00MB
pnml2lts-mc( 0/ 4): Tree memory: 8.5MB, 13.9 B/state, compr.: 1.4%
pnml2lts-mc( 0/ 4): Tree fill ratio (roots/leafs): 0.0%/0.0%
pnml2lts-mc( 0/ 4): Stored 405 string chucks using 0MB
pnml2lts-mc( 0/ 4): Total memory used for chunk indexing: 0MB
pnml2lts-mc( 0/ 4): Est. total memory use: 8.5MB (~8192.0MB paged-in)
ltl formula name JoinFreeModules-PT-0050-LTLCardinality-08
ltl formula formula --ltl=/tmp/ltl_8_
pnml2lts-mc( 0/ 4): Loading model from model.pnml
pnml2lts-mc( 0/ 4): Edge label is id
pnml2lts-mc( 0/ 4): Petri net has 251 places, 401 transitions and 1152 arcs
pnml2lts-mc( 0/ 4): Petri net JoinFreeModules-PT-0050 analyzed
pnml2lts-mc( 0/ 4): There are no safe places
pnml2lts-mc( 0/ 4): Loading Petri net took 0.050 real 0.030 user 0.060 sys
pnml2lts-mc( 1/ 4): LTL layer: formula: /tmp/ltl_8_
pnml2lts-mc( 0/ 4): Weak Buchi automaton detected, adding non-accepting as progress label.
pnml2lts-mc( 0/ 4): There are 453 state labels and 1 edge labels
pnml2lts-mc( 0/ 4): State length is 252, there are 405 groups
pnml2lts-mc( 0/ 4): Running ufscc using 4 cores
pnml2lts-mc( 0/ 4): Using a tree table with 2^30 elements
pnml2lts-mc( 0/ 4): Successor permutation: dynamic
pnml2lts-mc( 0/ 4): Global bits: 0, count bits: 0, local bits: 0
pnml2lts-mc( 2/ 4):
pnml2lts-mc( 2/ 4): Accepting cycle FOUND at depth ~155!
pnml2lts-mc( 2/ 4):
pnml2lts-mc( 0/ 4):
pnml2lts-mc( 0/ 4): total scc count: 0
pnml2lts-mc( 0/ 4): unique states count: 609
pnml2lts-mc( 0/ 4): unique transitions count: 62711
pnml2lts-mc( 0/ 4): - self-loop count: 0
pnml2lts-mc( 0/ 4): - claim dead count: 0
pnml2lts-mc( 0/ 4): - claim found count: 1
pnml2lts-mc( 0/ 4): - claim success count: 612
pnml2lts-mc( 0/ 4): - cum. max stack depth: 612
pnml2lts-mc( 0/ 4):
pnml2lts-mc( 0/ 4): Explored 612 states 63018 transitions, fanout: 102.971
pnml2lts-mc( 0/ 4): Total exploration time 0.550 sec (0.550 sec minimum, 0.550 sec on average)
pnml2lts-mc( 0/ 4): States per second: 1113, Transitions per second: 114578
pnml2lts-mc( 0/ 4):
pnml2lts-mc( 0/ 4): Queue width: 12B, total height: 0, memory: 0.00MB
pnml2lts-mc( 0/ 4): Tree memory: 1.0MB, 17.3 B/state, compr.: 1.7%
pnml2lts-mc( 0/ 4): Tree fill ratio (roots/leafs): 0.0%/0.0%
pnml2lts-mc( 0/ 4): Stored 405 string chucks using 0MB
pnml2lts-mc( 0/ 4): Total memory used for chunk indexing: 0MB
pnml2lts-mc( 0/ 4): Est. total memory use: 1.0MB (~8192.0MB paged-in)
ltl formula name JoinFreeModules-PT-0050-LTLCardinality-09
ltl formula formula --ltl=/tmp/ltl_9_
pnml2lts-mc( 0/ 4): Loading model from model.pnml
pnml2lts-mc( 0/ 4): Edge label is id
pnml2lts-mc( 0/ 4): Petri net has 251 places, 401 transitions and 1152 arcs
pnml2lts-mc( 0/ 4): Petri net JoinFreeModules-PT-0050 analyzed
pnml2lts-mc( 0/ 4): There are no safe places
pnml2lts-mc( 0/ 4): Loading Petri net took 0.050 real 0.070 user 0.030 sys
pnml2lts-mc( 2/ 4): LTL layer: formula: /tmp/ltl_9_
pnml2lts-mc( 0/ 4): Weak Buchi automaton detected, adding non-accepting as progress label.
pnml2lts-mc( 0/ 4): There are 453 state labels and 1 edge labels
pnml2lts-mc( 0/ 4): State length is 252, there are 403 groups
pnml2lts-mc( 0/ 4): Running ufscc using 4 cores
pnml2lts-mc( 0/ 4): Using a tree table with 2^30 elements
pnml2lts-mc( 0/ 4): Successor permutation: dynamic
pnml2lts-mc( 0/ 4): Global bits: 0, count bits: 0, local bits: 0
pnml2lts-mc( 1/ 4):
pnml2lts-mc( 1/ 4): Accepting cycle FOUND at depth ~236!
pnml2lts-mc( 1/ 4):
pnml2lts-mc( 0/ 4):
pnml2lts-mc( 0/ 4): total scc count: 0
pnml2lts-mc( 0/ 4): unique states count: 986
pnml2lts-mc( 0/ 4): unique transitions count: 100249
pnml2lts-mc( 0/ 4): - self-loop count: 0
pnml2lts-mc( 0/ 4): - claim dead count: 0
pnml2lts-mc( 0/ 4): - claim found count: 1
pnml2lts-mc( 0/ 4): - claim success count: 989
pnml2lts-mc( 0/ 4): - cum. max stack depth: 989
pnml2lts-mc( 0/ 4):
pnml2lts-mc( 0/ 4): Explored 989 states 100556 transitions, fanout: 101.674
pnml2lts-mc( 0/ 4): Total exploration time 0.830 sec (0.830 sec minimum, 0.830 sec on average)
pnml2lts-mc( 0/ 4): States per second: 1192, Transitions per second: 121152
pnml2lts-mc( 0/ 4):
pnml2lts-mc( 0/ 4): Queue width: 12B, total height: 0, memory: 0.00MB
pnml2lts-mc( 0/ 4): Tree memory: 1.6MB, 16.3 B/state, compr.: 1.6%
pnml2lts-mc( 0/ 4): Tree fill ratio (roots/leafs): 0.0%/0.0%
pnml2lts-mc( 0/ 4): Stored 405 string chucks using 0MB
pnml2lts-mc( 0/ 4): Total memory used for chunk indexing: 0MB
pnml2lts-mc( 0/ 4): Est. total memory use: 1.6MB (~8192.0MB paged-in)
ltl formula name JoinFreeModules-PT-0050-LTLCardinality-10
ltl formula formula --ltl=/tmp/ltl_10_
pnml2lts-mc( 0/ 4): Loading model from model.pnml
pnml2lts-mc( 0/ 4): Edge label is id
pnml2lts-mc( 0/ 4): Petri net has 251 places, 401 transitions and 1152 arcs
pnml2lts-mc( 0/ 4): Petri net JoinFreeModules-PT-0050 analyzed
pnml2lts-mc( 0/ 4): There are no safe places
pnml2lts-mc( 0/ 4): Loading Petri net took 0.040 real 0.040 user 0.050 sys
pnml2lts-mc( 3/ 4): LTL layer: formula: /tmp/ltl_10_
pnml2lts-mc( 0/ 4): Weak Buchi automaton detected, adding non-accepting as progress label.
pnml2lts-mc( 0/ 4): There are 453 state labels and 1 edge labels
pnml2lts-mc( 0/ 4): State length is 252, there are 404 groups
pnml2lts-mc( 0/ 4): Running ufscc using 4 cores
pnml2lts-mc( 0/ 4): Using a tree table with 2^30 elements
pnml2lts-mc( 0/ 4): Successor permutation: dynamic
pnml2lts-mc( 0/ 4): Global bits: 0, count bits: 0, local bits: 0
pnml2lts-mc( 2/ 4):
pnml2lts-mc( 2/ 4): Accepting cycle FOUND at depth ~1071!
pnml2lts-mc( 2/ 4):
pnml2lts-mc( 0/ 4):
pnml2lts-mc( 0/ 4): total scc count: 34
pnml2lts-mc( 0/ 4): unique states count: 4473
pnml2lts-mc( 0/ 4): unique transitions count: 474872
pnml2lts-mc( 0/ 4): - self-loop count: 4
pnml2lts-mc( 0/ 4): - claim dead count: 0
pnml2lts-mc( 0/ 4): - claim found count: 2084
pnml2lts-mc( 0/ 4): - claim success count: 4476
pnml2lts-mc( 0/ 4): - cum. max stack depth: 4442
pnml2lts-mc( 0/ 4):
pnml2lts-mc( 0/ 4): Explored 4476 states 475179 transitions, fanout: 106.162
pnml2lts-mc( 0/ 4): Total exploration time 3.160 sec (3.160 sec minimum, 3.160 sec on average)
pnml2lts-mc( 0/ 4): States per second: 1416, Transitions per second: 150373
pnml2lts-mc( 0/ 4):
pnml2lts-mc( 0/ 4): Queue width: 12B, total height: 0, memory: 0.00MB
pnml2lts-mc( 0/ 4): Tree memory: 6.8MB, 15.2 B/state, compr.: 1.5%
pnml2lts-mc( 0/ 4): Tree fill ratio (roots/leafs): 0.0%/0.0%
pnml2lts-mc( 0/ 4): Stored 405 string chucks using 0MB
pnml2lts-mc( 0/ 4): Total memory used for chunk indexing: 0MB
pnml2lts-mc( 0/ 4): Est. total memory use: 6.8MB (~8192.0MB paged-in)
ltl formula name JoinFreeModules-PT-0050-LTLCardinality-11
ltl formula formula --ltl=/tmp/ltl_11_
pnml2lts-mc( 0/ 4): Loading model from model.pnml
pnml2lts-mc( 0/ 4): Edge label is id
pnml2lts-mc( 0/ 4): Petri net has 251 places, 401 transitions and 1152 arcs
pnml2lts-mc( 0/ 4): Petri net JoinFreeModules-PT-0050 analyzed
pnml2lts-mc( 0/ 4): There are no safe places
pnml2lts-mc( 0/ 4): Loading Petri net took 0.050 real 0.060 user 0.050 sys
pnml2lts-mc( 0/ 4): LTL layer: formula: /tmp/ltl_11_
pnml2lts-mc( 0/ 4): buchi has 2 states
pnml2lts-mc( 0/ 4): Weak Buchi automaton detected, adding non-accepting as progress label.
pnml2lts-mc( 0/ 4): There are 453 state labels and 1 edge labels
pnml2lts-mc( 0/ 4): State length is 252, there are 403 groups
pnml2lts-mc( 0/ 4): Running ufscc using 4 cores
pnml2lts-mc( 0/ 4): Using a tree table with 2^30 elements
pnml2lts-mc( 0/ 4): Successor permutation: dynamic
pnml2lts-mc( 0/ 4): Global bits: 0, count bits: 0, local bits: 0
pnml2lts-mc( 0/ 4):
pnml2lts-mc( 0/ 4): total scc count: 1
pnml2lts-mc( 0/ 4): unique states count: 1
pnml2lts-mc( 0/ 4): unique transitions count: 0
pnml2lts-mc( 0/ 4): - self-loop count: 0
pnml2lts-mc( 0/ 4): - claim dead count: 0
pnml2lts-mc( 0/ 4): - claim found count: 0
pnml2lts-mc( 0/ 4): - claim success count: 4
pnml2lts-mc( 0/ 4): - cum. max stack depth: 4
pnml2lts-mc( 0/ 4):
pnml2lts-mc( 0/ 4): Explored 4 states 4 transitions, fanout: 1.000
pnml2lts-mc( 0/ 4): Total exploration time 0.000 sec (0.000 sec minimum, 0.000 sec on average)
pnml2lts-mc( 0/ 4): States per second: inf, Transitions per second: inf
pnml2lts-mc( 0/ 4):
pnml2lts-mc( 0/ 4): Queue width: 12B, total height: 0, memory: 0.00MB
pnml2lts-mc( 0/ 4): Tree memory: 0.0MB, 288.0 B/state, compr.: 28.5%
pnml2lts-mc( 0/ 4): Tree fill ratio (roots/leafs): 0.0%/0.0%
pnml2lts-mc( 0/ 4): Stored 405 string chucks using 0MB
pnml2lts-mc( 0/ 4): Total memory used for chunk indexing: 0MB
pnml2lts-mc( 0/ 4): Est. total memory use: 0.0MB (~8192.0MB paged-in)
ltl formula name JoinFreeModules-PT-0050-LTLCardinality-12
ltl formula formula --ltl=/tmp/ltl_12_
pnml2lts-mc( 0/ 4): Loading model from model.pnml
pnml2lts-mc( 0/ 4): Edge label is id
pnml2lts-mc( 0/ 4): Petri net has 251 places, 401 transitions and 1152 arcs
pnml2lts-mc( 0/ 4): Petri net JoinFreeModules-PT-0050 analyzed
pnml2lts-mc( 0/ 4): There are no safe places
pnml2lts-mc( 0/ 4): Loading Petri net took 0.050 real 0.050 user 0.050 sys
pnml2lts-mc( 0/ 4): LTL layer: formula: /tmp/ltl_12_
pnml2lts-mc( 0/ 4): buchi has 5 states
pnml2lts-mc( 0/ 4): There are 452 state labels and 1 edge labels
pnml2lts-mc( 0/ 4): State length is 252, there are 416 groups
pnml2lts-mc( 0/ 4): Running ufscc using 4 cores
pnml2lts-mc( 0/ 4): Using a tree table with 2^30 elements
pnml2lts-mc( 0/ 4): Successor permutation: dynamic
pnml2lts-mc( 0/ 4): Global bits: 0, count bits: 0, local bits: 0
pnml2lts-mc( 2/ 4):
pnml2lts-mc( 2/ 4): Accepting cycle FOUND at depth ~102!
pnml2lts-mc( 2/ 4):
pnml2lts-mc( 0/ 4):
pnml2lts-mc( 0/ 4): total scc count: 0
pnml2lts-mc( 0/ 4): unique states count: 424
pnml2lts-mc( 0/ 4): unique transitions count: 43181
pnml2lts-mc( 0/ 4): - self-loop count: 0
pnml2lts-mc( 0/ 4): - claim dead count: 0
pnml2lts-mc( 0/ 4): - claim found count: 1
pnml2lts-mc( 0/ 4): - claim success count: 427
pnml2lts-mc( 0/ 4): - cum. max stack depth: 427
pnml2lts-mc( 0/ 4):
pnml2lts-mc( 0/ 4): Explored 427 states 43488 transitions, fanout: 101.845
pnml2lts-mc( 0/ 4): Total exploration time 0.500 sec (0.490 sec minimum, 0.495 sec on average)
pnml2lts-mc( 0/ 4): States per second: 854, Transitions per second: 86976
pnml2lts-mc( 0/ 4):
pnml2lts-mc( 0/ 4): Queue width: 12B, total height: 0, memory: 0.00MB
pnml2lts-mc( 0/ 4): Tree memory: 0.7MB, 16.8 B/state, compr.: 1.7%
pnml2lts-mc( 0/ 4): Tree fill ratio (roots/leafs): 0.0%/0.0%
pnml2lts-mc( 0/ 4): Stored 405 string chucks using 0MB
pnml2lts-mc( 0/ 4): Total memory used for chunk indexing: 0MB
pnml2lts-mc( 0/ 4): Est. total memory use: 0.7MB (~8192.0MB paged-in)
ltl formula name JoinFreeModules-PT-0050-LTLCardinality-13
ltl formula formula --ltl=/tmp/ltl_13_
pnml2lts-mc( 0/ 4): Loading model from model.pnml
pnml2lts-mc( 0/ 4): Edge label is id
pnml2lts-mc( 0/ 4): Petri net has 251 places, 401 transitions and 1152 arcs
pnml2lts-mc( 0/ 4): Petri net JoinFreeModules-PT-0050 analyzed
pnml2lts-mc( 0/ 4): There are no safe places
pnml2lts-mc( 0/ 4): Loading Petri net took 0.040 real 0.070 user 0.030 sys
pnml2lts-mc( 1/ 4): LTL layer: formula: /tmp/ltl_13_
pnml2lts-mc( 0/ 4): Weak Buchi automaton detected, adding non-accepting as progress label.
pnml2lts-mc( 0/ 4): There are 453 state labels and 1 edge labels
pnml2lts-mc( 0/ 4): State length is 252, there are 404 groups
pnml2lts-mc( 0/ 4): Running ufscc using 4 cores
pnml2lts-mc( 0/ 4): Using a tree table with 2^30 elements
pnml2lts-mc( 0/ 4): Successor permutation: dynamic
pnml2lts-mc( 0/ 4): Global bits: 0, count bits: 0, local bits: 0
pnml2lts-mc( 0/ 4):
pnml2lts-mc( 0/ 4): Accepting cycle FOUND at depth ~381!
pnml2lts-mc( 0/ 4):
pnml2lts-mc( 0/ 4):
pnml2lts-mc( 0/ 4): total scc count: 0
pnml2lts-mc( 0/ 4): unique states count: 1616
pnml2lts-mc( 0/ 4): unique transitions count: 294615
pnml2lts-mc( 0/ 4): - self-loop count: 4
pnml2lts-mc( 0/ 4): - claim dead count: 0
pnml2lts-mc( 0/ 4): - claim found count: 113
pnml2lts-mc( 0/ 4): - claim success count: 1619
pnml2lts-mc( 0/ 4): - cum. max stack depth: 1619
pnml2lts-mc( 0/ 4):
pnml2lts-mc( 0/ 4): Explored 1619 states 295225 transitions, fanout: 182.350
pnml2lts-mc( 0/ 4): Total exploration time 2.010 sec (2.010 sec minimum, 2.010 sec on average)
pnml2lts-mc( 0/ 4): States per second: 805, Transitions per second: 146878
pnml2lts-mc( 0/ 4):
pnml2lts-mc( 0/ 4): Queue width: 12B, total height: 0, memory: 0.00MB
pnml2lts-mc( 0/ 4): Tree memory: 3.8MB, 13.7 B/state, compr.: 1.4%
pnml2lts-mc( 0/ 4): Tree fill ratio (roots/leafs): 0.0%/0.0%
pnml2lts-mc( 0/ 4): Stored 405 string chucks using 0MB
pnml2lts-mc( 0/ 4): Total memory used for chunk indexing: 0MB
pnml2lts-mc( 0/ 4): Est. total memory use: 3.8MB (~8192.0MB paged-in)
ltl formula name JoinFreeModules-PT-0050-LTLCardinality-14
ltl formula formula --ltl=/tmp/ltl_14_
pnml2lts-mc( 0/ 4): Loading model from model.pnml
pnml2lts-mc( 0/ 4): Edge label is id
pnml2lts-mc( 0/ 4): Petri net has 251 places, 401 transitions and 1152 arcs
pnml2lts-mc( 0/ 4): Petri net JoinFreeModules-PT-0050 analyzed
pnml2lts-mc( 0/ 4): There are no safe places
pnml2lts-mc( 0/ 4): Loading Petri net took 0.050 real 0.010 user 0.070 sys
pnml2lts-mc( 0/ 4): LTL layer: formula: /tmp/ltl_14_
pnml2lts-mc( 0/ 4): buchi has 2 states
pnml2lts-mc( 0/ 4): Weak Buchi automaton detected, adding non-accepting as progress label.
pnml2lts-mc( 0/ 4): There are 453 state labels and 1 edge labels
pnml2lts-mc( 0/ 4): State length is 252, there are 403 groups
pnml2lts-mc( 0/ 4): Running ufscc using 4 cores
pnml2lts-mc( 0/ 4): Using a tree table with 2^30 elements
pnml2lts-mc( 0/ 4): Successor permutation: dynamic
pnml2lts-mc( 0/ 4): Global bits: 0, count bits: 0, local bits: 0
pnml2lts-mc( 0/ 4):
pnml2lts-mc( 0/ 4): Accepting cycle FOUND at depth ~55!
pnml2lts-mc( 0/ 4):
pnml2lts-mc( 0/ 4):
pnml2lts-mc( 0/ 4): total scc count: 0
pnml2lts-mc( 0/ 4): unique states count: 218
pnml2lts-mc( 0/ 4): unique transitions count: 22120
pnml2lts-mc( 0/ 4): - self-loop count: 0
pnml2lts-mc( 0/ 4): - claim dead count: 0
pnml2lts-mc( 0/ 4): - claim found count: 1
pnml2lts-mc( 0/ 4): - claim success count: 221
pnml2lts-mc( 0/ 4): - cum. max stack depth: 221
pnml2lts-mc( 0/ 4):
pnml2lts-mc( 0/ 4): Explored 221 states 22427 transitions, fanout: 101.480
pnml2lts-mc( 0/ 4): Total exploration time 0.210 sec (0.210 sec minimum, 0.210 sec on average)
pnml2lts-mc( 0/ 4): States per second: 1052, Transitions per second: 106795
pnml2lts-mc( 0/ 4):
pnml2lts-mc( 0/ 4): Queue width: 12B, total height: 0, memory: 0.00MB
pnml2lts-mc( 0/ 4): Tree memory: 0.4MB, 18.6 B/state, compr.: 1.8%
pnml2lts-mc( 0/ 4): Tree fill ratio (roots/leafs): 0.0%/0.0%
pnml2lts-mc( 0/ 4): Stored 405 string chucks using 0MB
pnml2lts-mc( 0/ 4): Total memory used for chunk indexing: 0MB
pnml2lts-mc( 0/ 4): Est. total memory use: 0.4MB (~8192.0MB paged-in)
ltl formula name JoinFreeModules-PT-0050-LTLCardinality-15
ltl formula formula --ltl=/tmp/ltl_15_
pnml2lts-mc( 0/ 4): Loading model from model.pnml
pnml2lts-mc( 0/ 4): Edge label is id
pnml2lts-mc( 0/ 4): Petri net has 251 places, 401 transitions and 1152 arcs
pnml2lts-mc( 0/ 4): Petri net JoinFreeModules-PT-0050 analyzed
pnml2lts-mc( 0/ 4): There are no safe places
pnml2lts-mc( 0/ 4): Loading Petri net took 0.040 real 0.040 user 0.050 sys
pnml2lts-mc( 3/ 4): LTL layer: formula: /tmp/ltl_15_
pnml2lts-mc( 0/ 4): There are 452 state labels and 1 edge labels
pnml2lts-mc( 0/ 4): State length is 252, there are 411 groups
pnml2lts-mc( 0/ 4): Running ufscc using 4 cores
pnml2lts-mc( 0/ 4): Using a tree table with 2^30 elements
pnml2lts-mc( 0/ 4): Successor permutation: dynamic
pnml2lts-mc( 0/ 4): Global bits: 0, count bits: 0, local bits: 0
pnml2lts-mc( 3/ 4):
pnml2lts-mc( 3/ 4): Accepting cycle FOUND at depth ~305!
pnml2lts-mc( 3/ 4):
pnml2lts-mc( 0/ 4):
pnml2lts-mc( 0/ 4): total scc count: 0
pnml2lts-mc( 0/ 4): unique states count: 1264
pnml2lts-mc( 0/ 4): unique transitions count: 257876
pnml2lts-mc( 0/ 4): - self-loop count: 0
pnml2lts-mc( 0/ 4): - claim dead count: 0
pnml2lts-mc( 0/ 4): - claim found count: 232
pnml2lts-mc( 0/ 4): - claim success count: 1267
pnml2lts-mc( 0/ 4): - cum. max stack depth: 1267
pnml2lts-mc( 0/ 4):
pnml2lts-mc( 0/ 4): Explored 1267 states 258486 transitions, fanout: 204.014
pnml2lts-mc( 0/ 4): Total exploration time 1.560 sec (1.560 sec minimum, 1.560 sec on average)
pnml2lts-mc( 0/ 4): States per second: 812, Transitions per second: 165696
pnml2lts-mc( 0/ 4):
pnml2lts-mc( 0/ 4): Queue width: 12B, total height: 0, memory: 0.00MB
pnml2lts-mc( 0/ 4): Tree memory: 3.2MB, 14.4 B/state, compr.: 1.4%
pnml2lts-mc( 0/ 4): Tree fill ratio (roots/leafs): 0.0%/0.0%
pnml2lts-mc( 0/ 4): Stored 405 string chucks using 0MB
pnml2lts-mc( 0/ 4): Total memory used for chunk indexing: 0MB
pnml2lts-mc( 0/ 4): Est. total memory use: 3.2MB (~8192.0MB paged-in)
Sequence of Actions to be Executed by the VM
This is useful if one wants to reexecute the tool in the VM from the submitted image disk.
set -x
# this is for BenchKit: configuration of major elements for the test
export BK_INPUT="JoinFreeModules-PT-0050"
export BK_EXAMINATION="LTLCardinality"
export BK_TOOL="ltsmin"
export BK_RESULT_DIR="/tmp/BK_RESULTS/OUTPUTS"
export BK_TIME_CONFINEMENT="3600"
export BK_MEMORY_CONFINEMENT="16384"
# this is specific to your benchmark or test
export BIN_DIR="$HOME/BenchKit/bin"
# remove the execution directoty if it exists (to avoid increse of .vmdk images)
if [ -d execution ] ; then
rm -rf execution
fi
tar xzf /home/mcc/BenchKit/INPUTS/JoinFreeModules-PT-0050.tgz
mv JoinFreeModules-PT-0050 execution
cd execution
pwd
ls -lh
# this is for BenchKit: explicit launching of the test
echo "====================================================================="
echo " Generated by BenchKit 2-3637"
echo " Executing tool ltsmin"
echo " Input is JoinFreeModules-PT-0050, examination is LTLCardinality"
echo " Time confinement is $BK_TIME_CONFINEMENT seconds"
echo " Memory confinement is 16384 MBytes"
echo " Number of cores is 4"
echo " Run identifier is r209-smll-152732259100337"
echo "====================================================================="
echo
echo "--------------------"
echo "content from stdout:"
echo
echo "=== Data for post analysis generated by BenchKit (invocation template)"
echo
if [ "LTLCardinality" = "UpperBounds" ] ; then
echo "The expected result is a vector of positive values"
echo NUM_VECTOR
elif [ "LTLCardinality" != "StateSpace" ] ; then
echo "The expected result is a vector of booleans"
echo BOOL_VECTOR
else
echo "no data necessary for post analysis"
fi
echo
if [ -f "LTLCardinality.txt" ] ; then
echo "here is the order used to build the result vector(from text file)"
for x in $(grep Property LTLCardinality.txt | cut -d ' ' -f 2 | sort -u) ; do
echo "FORMULA_NAME $x"
done
elif [ -f "LTLCardinality.xml" ] ; then # for cunf (txt files deleted;-)
echo echo "here is the order used to build the result vector(from xml file)"
for x in $(grep '
echo "FORMULA_NAME $x"
done
fi
echo
echo "=== Now, execution of the tool begins"
echo
echo -n "BK_START "
date -u +%s%3N
echo
timeout -s 9 $BK_TIME_CONFINEMENT bash -c "/home/mcc/BenchKit/BenchKit_head.sh 2> STDERR ; echo ; echo -n \"BK_STOP \" ; date -u +%s%3N"
if [ $? -eq 137 ] ; then
echo
echo "BK_TIME_CONFINEMENT_REACHED"
fi
echo
echo "--------------------"
echo "content from stderr:"
echo
cat STDERR ;