

About the Execution of LTSMin for DLCround-PT-11a
| Execution Summary | |||||
| Max Memory Used (MB) |
Time wait (ms) | CPU Usage (ms) | I/O Wait (ms) | Computed Result | Execution Status |
| 11687.360 | 235191.00 | 918618.00 | 74.00 | FTFFFFFTFFF?FFFT | normal |
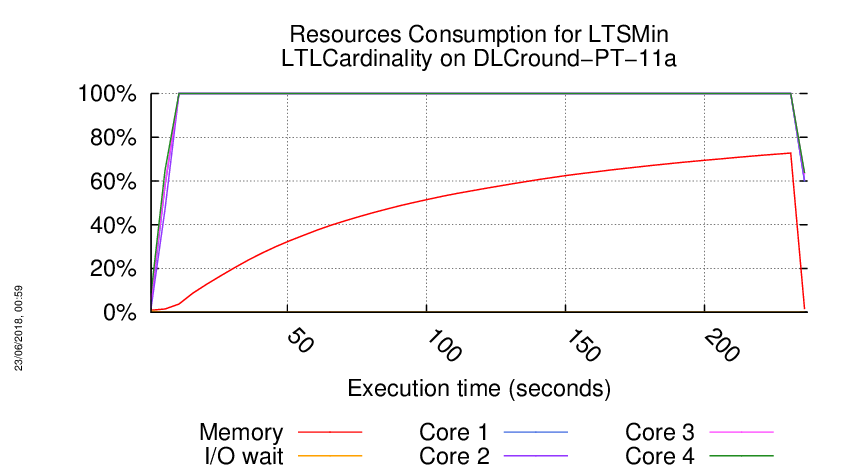
Execution Chart
We display below the execution chart for this examination (boot time has been removed).
Trace from the execution
Waiting for the VM to be ready (probing ssh)
..................
/home/mcc/execution
total 924K
-rw-r--r-- 1 mcc users 3.3K May 15 18:54 CTLCardinality.txt
-rw-r--r-- 1 mcc users 18K May 15 18:54 CTLCardinality.xml
-rw-r--r-- 1 mcc users 2.3K May 15 18:54 CTLFireability.txt
-rw-r--r-- 1 mcc users 15K May 15 18:54 CTLFireability.xml
-rw-r--r-- 1 mcc users 4.0K May 15 18:50 GenericPropertiesDefinition.xml
-rw-r--r-- 1 mcc users 5.9K May 15 18:50 GenericPropertiesVerdict.xml
-rw-r--r-- 1 mcc users 2.3K May 26 09:26 LTLCardinality.txt
-rw-r--r-- 1 mcc users 10K May 26 09:26 LTLCardinality.xml
-rw-r--r-- 1 mcc users 1.7K May 26 09:26 LTLFireability.txt
-rw-r--r-- 1 mcc users 7.2K May 26 09:26 LTLFireability.xml
-rw-r--r-- 1 mcc users 3.4K May 15 18:54 ReachabilityCardinality.txt
-rw-r--r-- 1 mcc users 18K May 15 18:54 ReachabilityCardinality.xml
-rw-r--r-- 1 mcc users 106 May 15 18:54 ReachabilityDeadlock.txt
-rw-r--r-- 1 mcc users 344 May 15 18:54 ReachabilityDeadlock.xml
-rw-r--r-- 1 mcc users 2.8K May 15 18:54 ReachabilityFireability.txt
-rw-r--r-- 1 mcc users 18K May 15 18:54 ReachabilityFireability.xml
-rw-r--r-- 1 mcc users 1.6K May 15 18:54 UpperBounds.txt
-rw-r--r-- 1 mcc users 3.6K May 15 18:54 UpperBounds.xml
-rw-r--r-- 1 mcc users 6 May 15 18:50 equiv_col
-rw-r--r-- 1 mcc users 4 May 15 18:50 instance
-rw-r--r-- 1 mcc users 6 May 15 18:50 iscolored
-rw-r--r-- 1 mcc users 762K May 15 18:50 model.pnml
=====================================================================
Generated by BenchKit 2-3637
Executing tool ltsmin
Input is DLCround-PT-11a, examination is LTLCardinality
Time confinement is 3600 seconds
Memory confinement is 16384 MBytes
Number of cores is 4
Run identifier is r209-smll-152732258800195
=====================================================================
--------------------
content from stdout:
=== Data for post analysis generated by BenchKit (invocation template)
The expected result is a vector of booleans
BOOL_VECTOR
here is the order used to build the result vector(from text file)
FORMULA_NAME DLCround-PT-11a-LTLCardinality-00
FORMULA_NAME DLCround-PT-11a-LTLCardinality-01
FORMULA_NAME DLCround-PT-11a-LTLCardinality-02
FORMULA_NAME DLCround-PT-11a-LTLCardinality-03
FORMULA_NAME DLCround-PT-11a-LTLCardinality-04
FORMULA_NAME DLCround-PT-11a-LTLCardinality-05
FORMULA_NAME DLCround-PT-11a-LTLCardinality-06
FORMULA_NAME DLCround-PT-11a-LTLCardinality-07
FORMULA_NAME DLCround-PT-11a-LTLCardinality-08
FORMULA_NAME DLCround-PT-11a-LTLCardinality-09
FORMULA_NAME DLCround-PT-11a-LTLCardinality-10
FORMULA_NAME DLCround-PT-11a-LTLCardinality-11
FORMULA_NAME DLCround-PT-11a-LTLCardinality-12
FORMULA_NAME DLCround-PT-11a-LTLCardinality-13
FORMULA_NAME DLCround-PT-11a-LTLCardinality-14
FORMULA_NAME DLCround-PT-11a-LTLCardinality-15
=== Now, execution of the tool begins
BK_START 1527368550668
FORMULA DLCround-PT-11a-LTLCardinality-00 FALSE TECHNIQUES EXPLICIT PARALLEL_PROCESSING USE_NUPN
FORMULA DLCround-PT-11a-LTLCardinality-01 TRUE TECHNIQUES EXPLICIT PARALLEL_PROCESSING USE_NUPN
FORMULA DLCround-PT-11a-LTLCardinality-02 FALSE TECHNIQUES EXPLICIT PARALLEL_PROCESSING USE_NUPN
FORMULA DLCround-PT-11a-LTLCardinality-03 FALSE TECHNIQUES EXPLICIT PARALLEL_PROCESSING USE_NUPN
FORMULA DLCround-PT-11a-LTLCardinality-04 FALSE TECHNIQUES EXPLICIT PARALLEL_PROCESSING USE_NUPN
FORMULA DLCround-PT-11a-LTLCardinality-05 FALSE TECHNIQUES EXPLICIT PARALLEL_PROCESSING USE_NUPN
FORMULA DLCround-PT-11a-LTLCardinality-06 FALSE TECHNIQUES EXPLICIT PARALLEL_PROCESSING USE_NUPN
FORMULA DLCround-PT-11a-LTLCardinality-07 TRUE TECHNIQUES EXPLICIT PARALLEL_PROCESSING USE_NUPN
FORMULA DLCround-PT-11a-LTLCardinality-08 FALSE TECHNIQUES EXPLICIT PARALLEL_PROCESSING USE_NUPN
FORMULA DLCround-PT-11a-LTLCardinality-09 FALSE TECHNIQUES EXPLICIT PARALLEL_PROCESSING USE_NUPN
FORMULA DLCround-PT-11a-LTLCardinality-10 FALSE TECHNIQUES EXPLICIT PARALLEL_PROCESSING USE_NUPN
FORMULA DLCround-PT-11a-LTLCardinality-11 CANNOT_COMPUTE
FORMULA DLCround-PT-11a-LTLCardinality-12 FALSE TECHNIQUES EXPLICIT PARALLEL_PROCESSING USE_NUPN
FORMULA DLCround-PT-11a-LTLCardinality-13 FALSE TECHNIQUES EXPLICIT PARALLEL_PROCESSING USE_NUPN
FORMULA DLCround-PT-11a-LTLCardinality-14 FALSE TECHNIQUES EXPLICIT PARALLEL_PROCESSING USE_NUPN
FORMULA DLCround-PT-11a-LTLCardinality-15 TRUE TECHNIQUES EXPLICIT PARALLEL_PROCESSING USE_NUPN
BK_STOP 1527368785859
--------------------
content from stderr:
mcc2018
ltl formula name DLCround-PT-11a-LTLCardinality-00
ltl formula formula --ltl=/tmp/ltl_0_
pnml2lts-mc( 0/ 4): Loading model from model.pnml
pnml2lts-mc( 0/ 4): Edge label is id
pnml2lts-mc( 0/ 4): Petri net has 377 places, 2993 transitions and 11677 arcs
pnml2lts-mc( 0/ 4): Petri net DLCround-PT-11a analyzed
pnml2lts-mc( 0/ 4): There are safe places
pnml2lts-mc( 3/ 4): LTL layer: formula: /tmp/ltl_0_
pnml2lts-mc( 0/ 4): Loading Petri net took 0.370 real 0.240 user 0.250 sys
pnml2lts-mc( 0/ 4): There are 378 state labels and 1 edge labels
pnml2lts-mc( 0/ 4): State length is 378, there are 2997 groups
pnml2lts-mc( 0/ 4): Running ufscc using 4 cores
pnml2lts-mc( 0/ 4): Using a tree table with 2^30 elements
pnml2lts-mc( 0/ 4): Successor permutation: dynamic
pnml2lts-mc( 0/ 4): Global bits: 0, count bits: 0, local bits: 0
pnml2lts-mc( 0/ 4):
pnml2lts-mc( 0/ 4): Accepting cycle FOUND at depth ~367!
pnml2lts-mc( 0/ 4):
pnml2lts-mc( 0/ 4):
pnml2lts-mc( 0/ 4): total scc count: 0
pnml2lts-mc( 0/ 4): unique states count: 1492
pnml2lts-mc( 0/ 4): unique transitions count: 331423
pnml2lts-mc( 0/ 4): - self-loop count: 231346
pnml2lts-mc( 0/ 4): - claim dead count: 0
pnml2lts-mc( 0/ 4): - claim found count: 20883
pnml2lts-mc( 0/ 4): - claim success count: 1500
pnml2lts-mc( 0/ 4): - cum. max stack depth: 1500
pnml2lts-mc( 0/ 4):
pnml2lts-mc( 0/ 4): Explored 1500 states 333722 transitions, fanout: 222.481
pnml2lts-mc( 0/ 4): Total exploration time 1.230 sec (1.220 sec minimum, 1.223 sec on average)
pnml2lts-mc( 0/ 4): States per second: 1220, Transitions per second: 271319
pnml2lts-mc( 0/ 4):
pnml2lts-mc( 0/ 4): Queue width: 12B, total height: 0, memory: 0.00MB
pnml2lts-mc( 0/ 4): Tree memory: 0.4MB, 15.4 B/state, compr.: 1.0%
pnml2lts-mc( 0/ 4): Tree fill ratio (roots/leafs): 0.0%/0.0%
pnml2lts-mc( 0/ 4): Stored 3050 string chucks using 0MB
pnml2lts-mc( 0/ 4): Total memory used for chunk indexing: 0MB
pnml2lts-mc( 0/ 4): Est. total memory use: 0.4MB (~8192.0MB paged-in)
ltl formula name DLCround-PT-11a-LTLCardinality-01
ltl formula formula --ltl=/tmp/ltl_1_
pnml2lts-mc( 0/ 4): Loading model from model.pnml
pnml2lts-mc( 0/ 4): Edge label is id
pnml2lts-mc( 0/ 4): Petri net has 377 places, 2993 transitions and 11677 arcs
pnml2lts-mc( 0/ 4): Petri net DLCround-PT-11a analyzed
pnml2lts-mc( 0/ 4): There are safe places
pnml2lts-mc( 0/ 4): Loading Petri net took 0.270 real 0.310 user 0.220 sys
pnml2lts-mc( 2/ 4): LTL layer: formula: /tmp/ltl_1_
pnml2lts-mc( 0/ 4): Weak Buchi automaton detected, adding non-accepting as progress label.
pnml2lts-mc( 0/ 4): There are 379 state labels and 1 edge labels
pnml2lts-mc( 0/ 4): State length is 378, there are 2997 groups
pnml2lts-mc( 0/ 4): Running ufscc using 4 cores
pnml2lts-mc( 0/ 4): Using a tree table with 2^30 elements
pnml2lts-mc( 0/ 4): Successor permutation: dynamic
pnml2lts-mc( 0/ 4): Global bits: 0, count bits: 0, local bits: 0
pnml2lts-mc( 0/ 4):
pnml2lts-mc( 0/ 4): total scc count: 742
pnml2lts-mc( 0/ 4): unique states count: 742
pnml2lts-mc( 0/ 4): unique transitions count: 17053
pnml2lts-mc( 0/ 4): - self-loop count: 0
pnml2lts-mc( 0/ 4): - claim dead count: 21982
pnml2lts-mc( 0/ 4): - claim found count: 0
pnml2lts-mc( 0/ 4): - claim success count: 836
pnml2lts-mc( 0/ 4): - cum. max stack depth: 16
pnml2lts-mc( 0/ 4):
pnml2lts-mc( 0/ 4): Explored 836 states 27609 transitions, fanout: 33.025
pnml2lts-mc( 0/ 4): Total exploration time 0.090 sec (0.090 sec minimum, 0.090 sec on average)
pnml2lts-mc( 0/ 4): States per second: 9289, Transitions per second: 306767
pnml2lts-mc( 0/ 4):
pnml2lts-mc( 0/ 4): Queue width: 12B, total height: 0, memory: 0.00MB
pnml2lts-mc( 0/ 4): Tree memory: 0.0MB, 22.8 B/state, compr.: 1.5%
pnml2lts-mc( 0/ 4): Tree fill ratio (roots/leafs): 0.0%/0.0%
pnml2lts-mc( 0/ 4): Stored 3050 string chucks using 0MB
pnml2lts-mc( 0/ 4): Total memory used for chunk indexing: 0MB
pnml2lts-mc( 0/ 4): Est. total memory use: 0.0MB (~8192.0MB paged-in)
ltl formula name DLCround-PT-11a-LTLCardinality-02
ltl formula formula --ltl=/tmp/ltl_2_
pnml2lts-mc( 0/ 4): Loading model from model.pnml
pnml2lts-mc( 0/ 4): Edge label is id
pnml2lts-mc( 0/ 4): Petri net has 377 places, 2993 transitions and 11677 arcs
pnml2lts-mc( 0/ 4): Petri net DLCround-PT-11a analyzed
pnml2lts-mc( 0/ 4): There are safe places
pnml2lts-mc( 0/ 4): Loading Petri net took 0.270 real 0.260 user 0.310 sys
pnml2lts-mc( 2/ 4): LTL layer: formula: /tmp/ltl_2_
pnml2lts-mc( 0/ 4): Weak Buchi automaton detected, adding non-accepting as progress label.
pnml2lts-mc( 0/ 4): There are 379 state labels and 1 edge labels
pnml2lts-mc( 0/ 4): State length is 378, there are 2996 groups
pnml2lts-mc( 0/ 4): Running ufscc using 4 cores
pnml2lts-mc( 0/ 4): Using a tree table with 2^30 elements
pnml2lts-mc( 0/ 4): Successor permutation: dynamic
pnml2lts-mc( 0/ 4): Global bits: 0, count bits: 0, local bits: 0
pnml2lts-mc( 1/ 4):
pnml2lts-mc( 1/ 4): Accepting cycle FOUND at depth ~2!
pnml2lts-mc( 1/ 4):
pnml2lts-mc( 0/ 4):
pnml2lts-mc( 0/ 4): total scc count: 0
pnml2lts-mc( 0/ 4): unique states count: 2
pnml2lts-mc( 0/ 4): unique transitions count: 453
pnml2lts-mc( 0/ 4): - self-loop count: 640
pnml2lts-mc( 0/ 4): - claim dead count: 0
pnml2lts-mc( 0/ 4): - claim found count: 0
pnml2lts-mc( 0/ 4): - claim success count: 8
pnml2lts-mc( 0/ 4): - cum. max stack depth: 8
pnml2lts-mc( 0/ 4):
pnml2lts-mc( 0/ 4): Explored 8 states 1816 transitions, fanout: 227.000
pnml2lts-mc( 0/ 4): Total exploration time 0.000 sec (0.000 sec minimum, 0.000 sec on average)
pnml2lts-mc( 0/ 4): States per second: inf, Transitions per second: inf
pnml2lts-mc( 0/ 4):
pnml2lts-mc( 0/ 4): Queue width: 12B, total height: 0, memory: 0.00MB
pnml2lts-mc( 0/ 4): Tree memory: 0.0MB, 53.3 B/state, compr.: 3.5%
pnml2lts-mc( 0/ 4): Tree fill ratio (roots/leafs): 0.0%/0.0%
pnml2lts-mc( 0/ 4): Stored 3050 string chucks using 0MB
pnml2lts-mc( 0/ 4): Total memory used for chunk indexing: 0MB
pnml2lts-mc( 0/ 4): Est. total memory use: 0.0MB (~8192.0MB paged-in)
ltl formula name DLCround-PT-11a-LTLCardinality-03
ltl formula formula --ltl=/tmp/ltl_3_
pnml2lts-mc( 0/ 4): Loading model from model.pnml
pnml2lts-mc( 0/ 4): Edge label is id
pnml2lts-mc( 0/ 4): Petri net has 377 places, 2993 transitions and 11677 arcs
pnml2lts-mc( 0/ 4): Petri net DLCround-PT-11a analyzed
pnml2lts-mc( 0/ 4): There are safe places
pnml2lts-mc( 0/ 4): Loading Petri net took 0.250 real 0.240 user 0.280 sys
pnml2lts-mc( 0/ 4): LTL layer: formula: /tmp/ltl_3_
pnml2lts-mc( 0/ 4): buchi has 4 states
pnml2lts-mc( 0/ 4): Weak Buchi automaton detected, adding non-accepting as progress label.
pnml2lts-mc( 0/ 4): There are 379 state labels and 1 edge labels
pnml2lts-mc( 0/ 4): State length is 378, there are 3003 groups
pnml2lts-mc( 0/ 4): Running ufscc using 4 cores
pnml2lts-mc( 0/ 4): Using a tree table with 2^30 elements
pnml2lts-mc( 0/ 4): Successor permutation: dynamic
pnml2lts-mc( 0/ 4): Global bits: 0, count bits: 0, local bits: 0
pnml2lts-mc( 0/ 4):
pnml2lts-mc( 0/ 4): Accepting cycle FOUND at depth ~3!
pnml2lts-mc( 0/ 4):
pnml2lts-mc( 0/ 4):
pnml2lts-mc( 0/ 4): total scc count: 0
pnml2lts-mc( 0/ 4): unique states count: 6
pnml2lts-mc( 0/ 4): unique transitions count: 2187
pnml2lts-mc( 0/ 4): - self-loop count: 580
pnml2lts-mc( 0/ 4): - claim dead count: 0
pnml2lts-mc( 0/ 4): - claim found count: 0
pnml2lts-mc( 0/ 4): - claim success count: 12
pnml2lts-mc( 0/ 4): - cum. max stack depth: 12
pnml2lts-mc( 0/ 4):
pnml2lts-mc( 0/ 4): Explored 12 states 3550 transitions, fanout: 295.833
pnml2lts-mc( 0/ 4): Total exploration time 0.010 sec (0.010 sec minimum, 0.010 sec on average)
pnml2lts-mc( 0/ 4): States per second: 1200, Transitions per second: 355000
pnml2lts-mc( 0/ 4):
pnml2lts-mc( 0/ 4): Queue width: 12B, total height: 0, memory: 0.00MB
pnml2lts-mc( 0/ 4): Tree memory: 0.0MB, 31.3 B/state, compr.: 2.1%
pnml2lts-mc( 0/ 4): Tree fill ratio (roots/leafs): 0.0%/0.0%
pnml2lts-mc( 0/ 4): Stored 3050 string chucks using 0MB
pnml2lts-mc( 0/ 4): Total memory used for chunk indexing: 0MB
pnml2lts-mc( 0/ 4): Est. total memory use: 0.0MB (~8192.0MB paged-in)
ltl formula name DLCround-PT-11a-LTLCardinality-04
ltl formula formula --ltl=/tmp/ltl_4_
pnml2lts-mc( 0/ 4): Loading model from model.pnml
pnml2lts-mc( 0/ 4): Edge label is id
pnml2lts-mc( 0/ 4): Petri net has 377 places, 2993 transitions and 11677 arcs
pnml2lts-mc( 0/ 4): Petri net DLCround-PT-11a analyzed
pnml2lts-mc( 0/ 4): There are safe places
pnml2lts-mc( 0/ 4): Loading Petri net took 0.240 real 0.250 user 0.260 sys
pnml2lts-mc( 1/ 4): LTL layer: formula: /tmp/ltl_4_
pnml2lts-mc( 0/ 4): There are 378 state labels and 1 edge labels
pnml2lts-mc( 0/ 4): State length is 378, there are 2997 groups
pnml2lts-mc( 0/ 4): Running ufscc using 4 cores
pnml2lts-mc( 0/ 4): Using a tree table with 2^30 elements
pnml2lts-mc( 0/ 4): Successor permutation: dynamic
pnml2lts-mc( 0/ 4): Global bits: 0, count bits: 0, local bits: 0
pnml2lts-mc( 0/ 4):
pnml2lts-mc( 0/ 4): Accepting cycle FOUND at depth ~2!
pnml2lts-mc( 0/ 4):
pnml2lts-mc( 0/ 4):
pnml2lts-mc( 0/ 4): total scc count: 0
pnml2lts-mc( 0/ 4): unique states count: 2
pnml2lts-mc( 0/ 4): unique transitions count: 453
pnml2lts-mc( 0/ 4): - self-loop count: 640
pnml2lts-mc( 0/ 4): - claim dead count: 0
pnml2lts-mc( 0/ 4): - claim found count: 0
pnml2lts-mc( 0/ 4): - claim success count: 8
pnml2lts-mc( 0/ 4): - cum. max stack depth: 8
pnml2lts-mc( 0/ 4):
pnml2lts-mc( 0/ 4): Explored 8 states 1816 transitions, fanout: 227.000
pnml2lts-mc( 0/ 4): Total exploration time 0.010 sec (0.010 sec minimum, 0.010 sec on average)
pnml2lts-mc( 0/ 4): States per second: 800, Transitions per second: 181600
pnml2lts-mc( 0/ 4):
pnml2lts-mc( 0/ 4): Queue width: 12B, total height: 0, memory: 0.00MB
pnml2lts-mc( 0/ 4): Tree memory: 0.0MB, 53.3 B/state, compr.: 3.5%
pnml2lts-mc( 0/ 4): Tree fill ratio (roots/leafs): 0.0%/0.0%
pnml2lts-mc( 0/ 4): Stored 3050 string chucks using 0MB
pnml2lts-mc( 0/ 4): Total memory used for chunk indexing: 0MB
pnml2lts-mc( 0/ 4): Est. total memory use: 0.0MB (~8192.0MB paged-in)
ltl formula name DLCround-PT-11a-LTLCardinality-05
ltl formula formula --ltl=/tmp/ltl_5_
pnml2lts-mc( 0/ 4): Loading model from model.pnml
pnml2lts-mc( 0/ 4): Edge label is id
pnml2lts-mc( 0/ 4): Petri net has 377 places, 2993 transitions and 11677 arcs
pnml2lts-mc( 0/ 4): Petri net DLCround-PT-11a analyzed
pnml2lts-mc( 0/ 4): There are safe places
pnml2lts-mc( 0/ 4): Loading Petri net took 0.280 real 0.260 user 0.290 sys
pnml2lts-mc( 2/ 4): LTL layer: formula: /tmp/ltl_5_
pnml2lts-mc( 0/ 4): Weak Buchi automaton detected, adding non-accepting as progress label.
pnml2lts-mc( 0/ 4): There are 379 state labels and 1 edge labels
pnml2lts-mc( 0/ 4): State length is 378, there are 2995 groups
pnml2lts-mc( 0/ 4): Running ufscc using 4 cores
pnml2lts-mc( 0/ 4): Using a tree table with 2^30 elements
pnml2lts-mc( 0/ 4): Successor permutation: dynamic
pnml2lts-mc( 0/ 4): Global bits: 0, count bits: 0, local bits: 0
pnml2lts-mc( 3/ 4):
pnml2lts-mc( 3/ 4): Accepting cycle FOUND at depth ~2!
pnml2lts-mc( 3/ 4):
pnml2lts-mc( 0/ 4):
pnml2lts-mc( 0/ 4): total scc count: 0
pnml2lts-mc( 0/ 4): unique states count: 2
pnml2lts-mc( 0/ 4): unique transitions count: 453
pnml2lts-mc( 0/ 4): - self-loop count: 640
pnml2lts-mc( 0/ 4): - claim dead count: 0
pnml2lts-mc( 0/ 4): - claim found count: 0
pnml2lts-mc( 0/ 4): - claim success count: 8
pnml2lts-mc( 0/ 4): - cum. max stack depth: 8
pnml2lts-mc( 0/ 4):
pnml2lts-mc( 0/ 4): Explored 8 states 1816 transitions, fanout: 227.000
pnml2lts-mc( 0/ 4): Total exploration time 0.000 sec (0.000 sec minimum, 0.000 sec on average)
pnml2lts-mc( 0/ 4): States per second: inf, Transitions per second: inf
pnml2lts-mc( 0/ 4):
pnml2lts-mc( 0/ 4): Queue width: 12B, total height: 0, memory: 0.00MB
pnml2lts-mc( 0/ 4): Tree memory: 0.0MB, 53.3 B/state, compr.: 3.5%
pnml2lts-mc( 0/ 4): Tree fill ratio (roots/leafs): 0.0%/0.0%
pnml2lts-mc( 0/ 4): Stored 3050 string chucks using 0MB
pnml2lts-mc( 0/ 4): Total memory used for chunk indexing: 0MB
pnml2lts-mc( 0/ 4): Est. total memory use: 0.0MB (~8192.0MB paged-in)
ltl formula name DLCround-PT-11a-LTLCardinality-06
ltl formula formula --ltl=/tmp/ltl_6_
pnml2lts-mc( 0/ 4): Loading model from model.pnml
pnml2lts-mc( 0/ 4): Edge label is id
pnml2lts-mc( 0/ 4): Petri net has 377 places, 2993 transitions and 11677 arcs
pnml2lts-mc( 0/ 4): Petri net DLCround-PT-11a analyzed
pnml2lts-mc( 0/ 4): There are safe places
pnml2lts-mc( 0/ 4): Loading Petri net took 0.250 real 0.310 user 0.210 sys
pnml2lts-mc( 1/ 4): LTL layer: formula: /tmp/ltl_6_
pnml2lts-mc( 0/ 4): Weak Buchi automaton detected, adding non-accepting as progress label.
pnml2lts-mc( 0/ 4): There are 379 state labels and 1 edge labels
pnml2lts-mc( 0/ 4): State length is 378, there are 2995 groups
pnml2lts-mc( 0/ 4): Running ufscc using 4 cores
pnml2lts-mc( 0/ 4): Using a tree table with 2^30 elements
pnml2lts-mc( 0/ 4): Successor permutation: dynamic
pnml2lts-mc( 0/ 4): Global bits: 0, count bits: 0, local bits: 0
pnml2lts-mc( 1/ 4):
pnml2lts-mc( 1/ 4): Accepting cycle FOUND at depth ~2!
pnml2lts-mc( 1/ 4):
pnml2lts-mc( 0/ 4):
pnml2lts-mc( 0/ 4): total scc count: 0
pnml2lts-mc( 0/ 4): unique states count: 2
pnml2lts-mc( 0/ 4): unique transitions count: 453
pnml2lts-mc( 0/ 4): - self-loop count: 640
pnml2lts-mc( 0/ 4): - claim dead count: 0
pnml2lts-mc( 0/ 4): - claim found count: 0
pnml2lts-mc( 0/ 4): - claim success count: 8
pnml2lts-mc( 0/ 4): - cum. max stack depth: 8
pnml2lts-mc( 0/ 4):
pnml2lts-mc( 0/ 4): Explored 8 states 1816 transitions, fanout: 227.000
pnml2lts-mc( 0/ 4): Total exploration time 0.010 sec (0.010 sec minimum, 0.010 sec on average)
pnml2lts-mc( 0/ 4): States per second: 800, Transitions per second: 181600
pnml2lts-mc( 0/ 4):
pnml2lts-mc( 0/ 4): Queue width: 12B, total height: 0, memory: 0.00MB
pnml2lts-mc( 0/ 4): Tree memory: 0.0MB, 53.3 B/state, compr.: 3.5%
pnml2lts-mc( 0/ 4): Tree fill ratio (roots/leafs): 0.0%/0.0%
pnml2lts-mc( 0/ 4): Stored 3050 string chucks using 0MB
pnml2lts-mc( 0/ 4): Total memory used for chunk indexing: 0MB
pnml2lts-mc( 0/ 4): Est. total memory use: 0.0MB (~8192.0MB paged-in)
ltl formula name DLCround-PT-11a-LTLCardinality-07
ltl formula formula --ltl=/tmp/ltl_7_
pnml2lts-mc( 0/ 4): Loading model from model.pnml
pnml2lts-mc( 0/ 4): Edge label is id
pnml2lts-mc( 0/ 4): Petri net has 377 places, 2993 transitions and 11677 arcs
pnml2lts-mc( 0/ 4): Petri net DLCround-PT-11a analyzed
pnml2lts-mc( 0/ 4): There are safe places
pnml2lts-mc( 0/ 4): Loading Petri net took 0.250 real 0.300 user 0.210 sys
pnml2lts-mc( 3/ 4): LTL layer: formula: /tmp/ltl_7_
pnml2lts-mc( 0/ 4): Weak Buchi automaton detected, adding non-accepting as progress label.
pnml2lts-mc( 0/ 4): There are 379 state labels and 1 edge labels
pnml2lts-mc( 0/ 4): State length is 378, there are 2995 groups
pnml2lts-mc( 0/ 4): Running ufscc using 4 cores
pnml2lts-mc( 0/ 4): Using a tree table with 2^30 elements
pnml2lts-mc( 0/ 4): Successor permutation: dynamic
pnml2lts-mc( 0/ 4): Global bits: 0, count bits: 0, local bits: 0
pnml2lts-mc( 0/ 4):
pnml2lts-mc( 0/ 4): total scc count: 1
pnml2lts-mc( 0/ 4): unique states count: 1
pnml2lts-mc( 0/ 4): unique transitions count: 0
pnml2lts-mc( 0/ 4): - self-loop count: 0
pnml2lts-mc( 0/ 4): - claim dead count: 0
pnml2lts-mc( 0/ 4): - claim found count: 0
pnml2lts-mc( 0/ 4): - claim success count: 4
pnml2lts-mc( 0/ 4): - cum. max stack depth: 4
pnml2lts-mc( 0/ 4):
pnml2lts-mc( 0/ 4): Explored 4 states 4 transitions, fanout: 1.000
pnml2lts-mc( 0/ 4): Total exploration time 0.000 sec (0.000 sec minimum, 0.000 sec on average)
pnml2lts-mc( 0/ 4): States per second: inf, Transitions per second: inf
pnml2lts-mc( 0/ 4):
pnml2lts-mc( 0/ 4): Queue width: 12B, total height: 0, memory: 0.00MB
pnml2lts-mc( 0/ 4): Tree memory: 0.0MB, 72.0 B/state, compr.: 4.8%
pnml2lts-mc( 0/ 4): Tree fill ratio (roots/leafs): 0.0%/0.0%
pnml2lts-mc( 0/ 4): Stored 3050 string chucks using 0MB
pnml2lts-mc( 0/ 4): Total memory used for chunk indexing: 0MB
pnml2lts-mc( 0/ 4): Est. total memory use: 0.0MB (~8192.0MB paged-in)
ltl formula name DLCround-PT-11a-LTLCardinality-08
ltl formula formula --ltl=/tmp/ltl_8_
pnml2lts-mc( 0/ 4): Loading model from model.pnml
pnml2lts-mc( 0/ 4): Edge label is id
pnml2lts-mc( 0/ 4): Petri net has 377 places, 2993 transitions and 11677 arcs
pnml2lts-mc( 0/ 4): Petri net DLCround-PT-11a analyzed
pnml2lts-mc( 0/ 4): There are safe places
pnml2lts-mc( 0/ 4): Loading Petri net took 0.260 real 0.290 user 0.240 sys
pnml2lts-mc( 1/ 4): LTL layer: formula: /tmp/ltl_8_
pnml2lts-mc( 0/ 4): Weak Buchi automaton detected, adding non-accepting as progress label.
pnml2lts-mc( 0/ 4): There are 379 state labels and 1 edge labels
pnml2lts-mc( 0/ 4): State length is 378, there are 2994 groups
pnml2lts-mc( 0/ 4): Running ufscc using 4 cores
pnml2lts-mc( 0/ 4): Using a tree table with 2^30 elements
pnml2lts-mc( 0/ 4): Successor permutation: dynamic
pnml2lts-mc( 0/ 4): Global bits: 0, count bits: 0, local bits: 0
pnml2lts-mc( 3/ 4):
pnml2lts-mc( 3/ 4): Accepting cycle FOUND at depth ~2!
pnml2lts-mc( 3/ 4):
pnml2lts-mc( 0/ 4):
pnml2lts-mc( 0/ 4): total scc count: 0
pnml2lts-mc( 0/ 4): unique states count: 2
pnml2lts-mc( 0/ 4): unique transitions count: 453
pnml2lts-mc( 0/ 4): - self-loop count: 640
pnml2lts-mc( 0/ 4): - claim dead count: 0
pnml2lts-mc( 0/ 4): - claim found count: 0
pnml2lts-mc( 0/ 4): - claim success count: 8
pnml2lts-mc( 0/ 4): - cum. max stack depth: 8
pnml2lts-mc( 0/ 4):
pnml2lts-mc( 0/ 4): Explored 8 states 1816 transitions, fanout: 227.000
pnml2lts-mc( 0/ 4): Total exploration time 0.010 sec (0.010 sec minimum, 0.010 sec on average)
pnml2lts-mc( 0/ 4): States per second: 800, Transitions per second: 181600
pnml2lts-mc( 0/ 4):
pnml2lts-mc( 0/ 4): Queue width: 12B, total height: 0, memory: 0.00MB
pnml2lts-mc( 0/ 4): Tree memory: 0.0MB, 53.3 B/state, compr.: 3.5%
pnml2lts-mc( 0/ 4): Tree fill ratio (roots/leafs): 0.0%/0.0%
pnml2lts-mc( 0/ 4): Stored 3050 string chucks using 0MB
pnml2lts-mc( 0/ 4): Total memory used for chunk indexing: 0MB
pnml2lts-mc( 0/ 4): Est. total memory use: 0.0MB (~8192.0MB paged-in)
ltl formula name DLCround-PT-11a-LTLCardinality-09
ltl formula formula --ltl=/tmp/ltl_9_
pnml2lts-mc( 0/ 4): Loading model from model.pnml
pnml2lts-mc( 0/ 4): Edge label is id
pnml2lts-mc( 0/ 4): Petri net has 377 places, 2993 transitions and 11677 arcs
pnml2lts-mc( 0/ 4): Petri net DLCround-PT-11a analyzed
pnml2lts-mc( 0/ 4): There are safe places
pnml2lts-mc( 0/ 4): Loading Petri net took 0.270 real 0.250 user 0.310 sys
pnml2lts-mc( 0/ 4): LTL layer: formula: /tmp/ltl_9_
pnml2lts-mc( 0/ 4): buchi has 4 states
pnml2lts-mc( 0/ 4): Weak Buchi automaton detected, adding non-accepting as progress label.
pnml2lts-mc( 0/ 4): There are 379 state labels and 1 edge labels
pnml2lts-mc( 0/ 4): State length is 378, there are 2998 groups
pnml2lts-mc( 0/ 4): Running ufscc using 4 cores
pnml2lts-mc( 0/ 4): Using a tree table with 2^30 elements
pnml2lts-mc( 0/ 4): Successor permutation: dynamic
pnml2lts-mc( 0/ 4): Global bits: 0, count bits: 0, local bits: 0
pnml2lts-mc( 2/ 4):
pnml2lts-mc( 2/ 4): Accepting cycle FOUND at depth ~4!
pnml2lts-mc( 2/ 4):
pnml2lts-mc( 0/ 4):
pnml2lts-mc( 0/ 4): total scc count: 0
pnml2lts-mc( 0/ 4): unique states count: 6
pnml2lts-mc( 0/ 4): unique transitions count: 2247
pnml2lts-mc( 0/ 4): - self-loop count: 320
pnml2lts-mc( 0/ 4): - claim dead count: 0
pnml2lts-mc( 0/ 4): - claim found count: 0
pnml2lts-mc( 0/ 4): - claim success count: 14
pnml2lts-mc( 0/ 4): - cum. max stack depth: 14
pnml2lts-mc( 0/ 4):
pnml2lts-mc( 0/ 4): Explored 14 states 4514 transitions, fanout: 322.429
pnml2lts-mc( 0/ 4): Total exploration time 0.010 sec (0.010 sec minimum, 0.010 sec on average)
pnml2lts-mc( 0/ 4): States per second: 1400, Transitions per second: 451400
pnml2lts-mc( 0/ 4):
pnml2lts-mc( 0/ 4): Queue width: 12B, total height: 0, memory: 0.00MB
pnml2lts-mc( 0/ 4): Tree memory: 0.0MB, 28.6 B/state, compr.: 1.9%
pnml2lts-mc( 0/ 4): Tree fill ratio (roots/leafs): 0.0%/0.0%
pnml2lts-mc( 0/ 4): Stored 3050 string chucks using 0MB
pnml2lts-mc( 0/ 4): Total memory used for chunk indexing: 0MB
pnml2lts-mc( 0/ 4): Est. total memory use: 0.0MB (~8192.0MB paged-in)
ltl formula name DLCround-PT-11a-LTLCardinality-10
ltl formula formula --ltl=/tmp/ltl_10_
pnml2lts-mc( 0/ 4): Loading model from model.pnml
pnml2lts-mc( 0/ 4): Edge label is id
pnml2lts-mc( 0/ 4): Petri net has 377 places, 2993 transitions and 11677 arcs
pnml2lts-mc( 0/ 4): Petri net DLCround-PT-11a analyzed
pnml2lts-mc( 0/ 4): There are safe places
pnml2lts-mc( 0/ 4): Loading Petri net took 0.320 real 0.280 user 0.320 sys
pnml2lts-mc( 3/ 4): LTL layer: formula: /tmp/ltl_10_
pnml2lts-mc( 0/ 4): Weak Buchi automaton detected, adding non-accepting as progress label.
pnml2lts-mc( 0/ 4): There are 379 state labels and 1 edge labels
pnml2lts-mc( 0/ 4): State length is 378, there are 2996 groups
pnml2lts-mc( 0/ 4): Running ufscc using 4 cores
pnml2lts-mc( 0/ 4): Using a tree table with 2^30 elements
pnml2lts-mc( 0/ 4): Successor permutation: dynamic
pnml2lts-mc( 0/ 4): Global bits: 0, count bits: 0, local bits: 0
pnml2lts-mc( 0/ 4):
pnml2lts-mc( 0/ 4): Accepting cycle FOUND at depth ~3!
pnml2lts-mc( 0/ 4):
pnml2lts-mc( 0/ 4):
pnml2lts-mc( 0/ 4): total scc count: 0
pnml2lts-mc( 0/ 4): unique states count: 6
pnml2lts-mc( 0/ 4): unique transitions count: 4346
pnml2lts-mc( 0/ 4): - self-loop count: 1322
pnml2lts-mc( 0/ 4): - claim dead count: 0
pnml2lts-mc( 0/ 4): - claim found count: 0
pnml2lts-mc( 0/ 4): - claim success count: 12
pnml2lts-mc( 0/ 4): - cum. max stack depth: 12
pnml2lts-mc( 0/ 4):
pnml2lts-mc( 0/ 4): Explored 12 states 7068 transitions, fanout: 589.000
pnml2lts-mc( 0/ 4): Total exploration time 0.010 sec (0.010 sec minimum, 0.010 sec on average)
pnml2lts-mc( 0/ 4): States per second: 1200, Transitions per second: 706800
pnml2lts-mc( 0/ 4):
pnml2lts-mc( 0/ 4): Queue width: 12B, total height: 0, memory: 0.00MB
pnml2lts-mc( 0/ 4): Tree memory: 0.0MB, 19.7 B/state, compr.: 1.3%
pnml2lts-mc( 0/ 4): Tree fill ratio (roots/leafs): 0.0%/0.0%
pnml2lts-mc( 0/ 4): Stored 3050 string chucks using 0MB
pnml2lts-mc( 0/ 4): Total memory used for chunk indexing: 0MB
pnml2lts-mc( 0/ 4): Est. total memory use: 0.0MB (~8192.0MB paged-in)
ltl formula name DLCround-PT-11a-LTLCardinality-11
ltl formula formula --ltl=/tmp/ltl_11_
pnml2lts-mc( 0/ 4): Loading model from model.pnml
pnml2lts-mc( 0/ 4): Edge label is id
pnml2lts-mc( 0/ 4): Petri net has 377 places, 2993 transitions and 11677 arcs
pnml2lts-mc( 0/ 4): Petri net DLCround-PT-11a analyzed
pnml2lts-mc( 0/ 4): There are safe places
pnml2lts-mc( 0/ 4): Loading Petri net took 0.360 real 0.300 user 0.300 sys
pnml2lts-mc( 2/ 4): LTL layer: formula: /tmp/ltl_11_
pnml2lts-mc( 0/ 4): There are 378 state labels and 1 edge labels
pnml2lts-mc( 0/ 4): State length is 378, there are 2997 groups
pnml2lts-mc( 0/ 4): Running ufscc using 4 cores
pnml2lts-mc( 0/ 4): Using a tree table with 2^30 elements
pnml2lts-mc( 0/ 4): Successor permutation: dynamic
pnml2lts-mc( 0/ 4): Global bits: 0, count bits: 0, local bits: 0
pnml2lts-mc( 0/ 4): ~2500 levels ~10000 states ~2461364 transitions
pnml2lts-mc( 0/ 4): ~5000 levels ~20000 states ~5079080 transitions
pnml2lts-mc( 3/ 4): ~10000 levels ~40000 states ~10194976 transitions
pnml2lts-mc( 3/ 4): ~20000 levels ~80000 states ~20313376 transitions
pnml2lts-mc( 3/ 4): ~40000 levels ~160000 states ~40936572 transitions
pnml2lts-mc( 3/ 4): ~80000 levels ~320000 states ~83303200 transitions
ltl formula name DLCround-PT-11a-LTLCardinality-12
ltl formula formula --ltl=/tmp/ltl_12_
pnml2lts-mc( 0/ 4): Loading model from model.pnml
pnml2lts-mc( 0/ 4): Edge label is id
pnml2lts-mc( 0/ 4): Petri net has 377 places, 2993 transitions and 11677 arcs
pnml2lts-mc( 0/ 4): Petri net DLCround-PT-11a analyzed
pnml2lts-mc( 0/ 4): There are safe places
pnml2lts-mc( 0/ 4): Loading Petri net took 0.250 real 0.310 user 0.190 sys
pnml2lts-mc( 3/ 4): LTL layer: formula: /tmp/ltl_12_
pnml2lts-mc( 0/ 4): There are 378 state labels and 1 edge labels
pnml2lts-mc( 0/ 4): State length is 378, there are 2997 groups
pnml2lts-mc( 0/ 4): Running ufscc using 4 cores
pnml2lts-mc( 0/ 4): Using a tree table with 2^30 elements
pnml2lts-mc( 0/ 4): Successor permutation: dynamic
pnml2lts-mc( 0/ 4): Global bits: 0, count bits: 0, local bits: 0
pnml2lts-mc( 3/ 4):
pnml2lts-mc( 3/ 4): Accepting cycle FOUND at depth ~3!
pnml2lts-mc( 3/ 4):
pnml2lts-mc( 0/ 4):
pnml2lts-mc( 0/ 4): total scc count: 0
pnml2lts-mc( 0/ 4): unique states count: 5
pnml2lts-mc( 0/ 4): unique transitions count: 1901
pnml2lts-mc( 0/ 4): - self-loop count: 668
pnml2lts-mc( 0/ 4): - claim dead count: 0
pnml2lts-mc( 0/ 4): - claim found count: 0
pnml2lts-mc( 0/ 4): - claim success count: 12
pnml2lts-mc( 0/ 4): - cum. max stack depth: 12
pnml2lts-mc( 0/ 4):
pnml2lts-mc( 0/ 4): Explored 12 states 3716 transitions, fanout: 309.667
pnml2lts-mc( 0/ 4): Total exploration time 0.010 sec (0.010 sec minimum, 0.010 sec on average)
pnml2lts-mc( 0/ 4): States per second: 1200, Transitions per second: 371600
pnml2lts-mc( 0/ 4):
pnml2lts-mc( 0/ 4): Queue width: 12B, total height: 0, memory: 0.00MB
pnml2lts-mc( 0/ 4): Tree memory: 0.0MB, 33.1 B/state, compr.: 2.2%
pnml2lts-mc( 0/ 4): Tree fill ratio (roots/leafs): 0.0%/0.0%
pnml2lts-mc( 0/ 4): Stored 3050 string chucks using 0MB
pnml2lts-mc( 0/ 4): Total memory used for chunk indexing: 0MB
pnml2lts-mc( 0/ 4): Est. total memory use: 0.0MB (~8192.0MB paged-in)
ltl formula name DLCround-PT-11a-LTLCardinality-13
ltl formula formula --ltl=/tmp/ltl_13_
pnml2lts-mc( 0/ 4): Loading model from model.pnml
pnml2lts-mc( 0/ 4): Edge label is id
pnml2lts-mc( 0/ 4): Petri net has 377 places, 2993 transitions and 11677 arcs
pnml2lts-mc( 0/ 4): Petri net DLCround-PT-11a analyzed
pnml2lts-mc( 0/ 4): There are safe places
pnml2lts-mc( 0/ 4): Loading Petri net took 0.240 real 0.250 user 0.250 sys
pnml2lts-mc( 1/ 4): LTL layer: formula: /tmp/ltl_13_
pnml2lts-mc( 0/ 4): Weak Buchi automaton detected, adding non-accepting as progress label.
pnml2lts-mc( 0/ 4): There are 379 state labels and 1 edge labels
pnml2lts-mc( 0/ 4): State length is 378, there are 3000 groups
pnml2lts-mc( 0/ 4): Running ufscc using 4 cores
pnml2lts-mc( 0/ 4): Using a tree table with 2^30 elements
pnml2lts-mc( 0/ 4): Successor permutation: dynamic
pnml2lts-mc( 0/ 4): Global bits: 0, count bits: 0, local bits: 0
pnml2lts-mc( 2/ 4):
pnml2lts-mc( 2/ 4): Accepting cycle FOUND at depth ~230!
pnml2lts-mc( 2/ 4):
pnml2lts-mc( 0/ 4):
pnml2lts-mc( 0/ 4): total scc count: 0
pnml2lts-mc( 0/ 4): unique states count: 840
pnml2lts-mc( 0/ 4): unique transitions count: 394699
pnml2lts-mc( 0/ 4): - self-loop count: 263714
pnml2lts-mc( 0/ 4): - claim dead count: 0
pnml2lts-mc( 0/ 4): - claim found count: 19635
pnml2lts-mc( 0/ 4): - claim success count: 846
pnml2lts-mc( 0/ 4): - cum. max stack depth: 846
pnml2lts-mc( 0/ 4):
pnml2lts-mc( 0/ 4): Explored 846 states 397418 transitions, fanout: 469.761
pnml2lts-mc( 0/ 4): Total exploration time 0.770 sec (0.770 sec minimum, 0.770 sec on average)
pnml2lts-mc( 0/ 4): States per second: 1099, Transitions per second: 516127
pnml2lts-mc( 0/ 4):
pnml2lts-mc( 0/ 4): Queue width: 12B, total height: 0, memory: 0.00MB
pnml2lts-mc( 0/ 4): Tree memory: 0.2MB, 16.7 B/state, compr.: 1.1%
pnml2lts-mc( 0/ 4): Tree fill ratio (roots/leafs): 0.0%/0.0%
pnml2lts-mc( 0/ 4): Stored 3050 string chucks using 0MB
pnml2lts-mc( 0/ 4): Total memory used for chunk indexing: 0MB
pnml2lts-mc( 0/ 4): Est. total memory use: 0.2MB (~8192.0MB paged-in)
ltl formula name DLCround-PT-11a-LTLCardinality-14
ltl formula formula --ltl=/tmp/ltl_14_
pnml2lts-mc( 0/ 4): Loading model from model.pnml
pnml2lts-mc( 0/ 4): Edge label is id
pnml2lts-mc( 0/ 4): Petri net has 377 places, 2993 transitions and 11677 arcs
pnml2lts-mc( 0/ 4): Petri net DLCround-PT-11a analyzed
pnml2lts-mc( 0/ 4): There are safe places
pnml2lts-mc( 0/ 4): Loading Petri net took 0.250 real 0.290 user 0.230 sys
pnml2lts-mc( 2/ 4): LTL layer: formula: /tmp/ltl_14_
pnml2lts-mc( 0/ 4): Weak Buchi automaton detected, adding non-accepting as progress label.
pnml2lts-mc( 0/ 4): There are 379 state labels and 1 edge labels
pnml2lts-mc( 0/ 4): State length is 378, there are 2996 groups
pnml2lts-mc( 0/ 4): Running ufscc using 4 cores
pnml2lts-mc( 0/ 4): Using a tree table with 2^30 elements
pnml2lts-mc( 0/ 4): Successor permutation: dynamic
pnml2lts-mc( 0/ 4): Global bits: 0, count bits: 0, local bits: 0
pnml2lts-mc( 1/ 4):
pnml2lts-mc( 1/ 4): Accepting cycle FOUND at depth ~3!
pnml2lts-mc( 1/ 4):
pnml2lts-mc( 0/ 4):
pnml2lts-mc( 0/ 4): total scc count: 0
pnml2lts-mc( 0/ 4): unique states count: 6
pnml2lts-mc( 0/ 4): unique transitions count: 2399
pnml2lts-mc( 0/ 4): - self-loop count: 682
pnml2lts-mc( 0/ 4): - claim dead count: 0
pnml2lts-mc( 0/ 4): - claim found count: 0
pnml2lts-mc( 0/ 4): - claim success count: 12
pnml2lts-mc( 0/ 4): - cum. max stack depth: 12
pnml2lts-mc( 0/ 4):
pnml2lts-mc( 0/ 4): Explored 12 states 3762 transitions, fanout: 313.500
pnml2lts-mc( 0/ 4): Total exploration time 0.010 sec (0.000 sec minimum, 0.005 sec on average)
pnml2lts-mc( 0/ 4): States per second: 1200, Transitions per second: 376200
pnml2lts-mc( 0/ 4):
pnml2lts-mc( 0/ 4): Queue width: 12B, total height: 0, memory: 0.00MB
pnml2lts-mc( 0/ 4): Tree memory: 0.0MB, 30.8 B/state, compr.: 2.0%
pnml2lts-mc( 0/ 4): Tree fill ratio (roots/leafs): 0.0%/0.0%
pnml2lts-mc( 0/ 4): Stored 3050 string chucks using 0MB
pnml2lts-mc( 0/ 4): Total memory used for chunk indexing: 0MB
pnml2lts-mc( 0/ 4): Est. total memory use: 0.0MB (~8192.0MB paged-in)
ltl formula name DLCround-PT-11a-LTLCardinality-15
ltl formula formula --ltl=/tmp/ltl_15_
pnml2lts-mc( 0/ 4): Loading model from model.pnml
pnml2lts-mc( 0/ 4): Edge label is id
pnml2lts-mc( 0/ 4): Petri net has 377 places, 2993 transitions and 11677 arcs
pnml2lts-mc( 0/ 4): Petri net DLCround-PT-11a analyzed
pnml2lts-mc( 0/ 4): There are safe places
pnml2lts-mc( 0/ 4): Loading Petri net took 0.260 real 0.250 user 0.270 sys
pnml2lts-mc( 0/ 4): LTL layer: formula: /tmp/ltl_15_
pnml2lts-mc( 0/ 4): buchi has 2 states
pnml2lts-mc( 0/ 4): Weak Buchi automaton detected, adding non-accepting as progress label.
pnml2lts-mc( 0/ 4): There are 379 state labels and 1 edge labels
pnml2lts-mc( 0/ 4): State length is 378, there are 2995 groups
pnml2lts-mc( 0/ 4): Running ufscc using 4 cores
pnml2lts-mc( 0/ 4): Using a tree table with 2^30 elements
pnml2lts-mc( 0/ 4): Successor permutation: dynamic
pnml2lts-mc( 0/ 4): Global bits: 0, count bits: 0, local bits: 0
pnml2lts-mc( 0/ 4):
pnml2lts-mc( 0/ 4): total scc count: 1
pnml2lts-mc( 0/ 4): unique states count: 1
pnml2lts-mc( 0/ 4): unique transitions count: 0
pnml2lts-mc( 0/ 4): - self-loop count: 0
pnml2lts-mc( 0/ 4): - claim dead count: 0
pnml2lts-mc( 0/ 4): - claim found count: 0
pnml2lts-mc( 0/ 4): - claim success count: 4
pnml2lts-mc( 0/ 4): - cum. max stack depth: 4
pnml2lts-mc( 0/ 4):
pnml2lts-mc( 0/ 4): Explored 4 states 4 transitions, fanout: 1.000
pnml2lts-mc( 0/ 4): Total exploration time 0.000 sec (0.000 sec minimum, 0.000 sec on average)
pnml2lts-mc( 0/ 4): States per second: inf, Transitions per second: inf
pnml2lts-mc( 0/ 4):
pnml2lts-mc( 0/ 4): Queue width: 12B, total height: 0, memory: 0.00MB
pnml2lts-mc( 0/ 4): Tree memory: 0.0MB, 72.0 B/state, compr.: 4.8%
pnml2lts-mc( 0/ 4): Tree fill ratio (roots/leafs): 0.0%/0.0%
pnml2lts-mc( 0/ 4): Stored 3050 string chucks using 0MB
pnml2lts-mc( 0/ 4): Total memory used for chunk indexing: 0MB
pnml2lts-mc( 0/ 4): Est. total memory use: 0.0MB (~8192.0MB paged-in)
Sequence of Actions to be Executed by the VM
This is useful if one wants to reexecute the tool in the VM from the submitted image disk.
set -x
# this is for BenchKit: configuration of major elements for the test
export BK_INPUT="DLCround-PT-11a"
export BK_EXAMINATION="LTLCardinality"
export BK_TOOL="ltsmin"
export BK_RESULT_DIR="/tmp/BK_RESULTS/OUTPUTS"
export BK_TIME_CONFINEMENT="3600"
export BK_MEMORY_CONFINEMENT="16384"
# this is specific to your benchmark or test
export BIN_DIR="$HOME/BenchKit/bin"
# remove the execution directoty if it exists (to avoid increse of .vmdk images)
if [ -d execution ] ; then
rm -rf execution
fi
tar xzf /home/mcc/BenchKit/INPUTS/DLCround-PT-11a.tgz
mv DLCround-PT-11a execution
cd execution
pwd
ls -lh
# this is for BenchKit: explicit launching of the test
echo "====================================================================="
echo " Generated by BenchKit 2-3637"
echo " Executing tool ltsmin"
echo " Input is DLCround-PT-11a, examination is LTLCardinality"
echo " Time confinement is $BK_TIME_CONFINEMENT seconds"
echo " Memory confinement is 16384 MBytes"
echo " Number of cores is 4"
echo " Run identifier is r209-smll-152732258800195"
echo "====================================================================="
echo
echo "--------------------"
echo "content from stdout:"
echo
echo "=== Data for post analysis generated by BenchKit (invocation template)"
echo
if [ "LTLCardinality" = "UpperBounds" ] ; then
echo "The expected result is a vector of positive values"
echo NUM_VECTOR
elif [ "LTLCardinality" != "StateSpace" ] ; then
echo "The expected result is a vector of booleans"
echo BOOL_VECTOR
else
echo "no data necessary for post analysis"
fi
echo
if [ -f "LTLCardinality.txt" ] ; then
echo "here is the order used to build the result vector(from text file)"
for x in $(grep Property LTLCardinality.txt | cut -d ' ' -f 2 | sort -u) ; do
echo "FORMULA_NAME $x"
done
elif [ -f "LTLCardinality.xml" ] ; then # for cunf (txt files deleted;-)
echo echo "here is the order used to build the result vector(from xml file)"
for x in $(grep '
echo "FORMULA_NAME $x"
done
fi
echo
echo "=== Now, execution of the tool begins"
echo
echo -n "BK_START "
date -u +%s%3N
echo
timeout -s 9 $BK_TIME_CONFINEMENT bash -c "/home/mcc/BenchKit/BenchKit_head.sh 2> STDERR ; echo ; echo -n \"BK_STOP \" ; date -u +%s%3N"
if [ $? -eq 137 ] ; then
echo
echo "BK_TIME_CONFINEMENT_REACHED"
fi
echo
echo "--------------------"
echo "content from stderr:"
echo
cat STDERR ;